On August 30th Cable has entered an interesting phase in the wave count.
Both the operating and alternate counts were calling for a drop to a new low and I released this chart.

Wave (i) or (b) was targeted to break 1.20 at the previous low.
I wrote;
The price sold off sharply in a possible wave ‘iii’ of (i) this afternoon.
Wave ‘iii’ should continue lower in the early trade next week
and it should find support at 1.2063.
The next week the price did continue lower and break 1.20 as expected in wave (i) or (b).
This is the chart I published on the following Monday the 3rd of September.

The price fell 250 pips into the low and then the market began a correction higher.
There was two specific possibilities in the wave count.
Wave (ii) could rally to 1.2150,
Or wave (c) of [ii] could rally into the upper target at about 1.2380 minimum.
Both counts were calling for a rally,
and the alternate count had about 300 points on the table.
Here what I said that night;
There is two distinct ways to view the recent decline,
and both counts call for a rally off the low.The current count views todays lows as wave (i) of [iii] down.
And now we are seeing a rally in wave (ii) of [iii].
Wave (ii) should create a three wave rally overall
and top out at about 1.2170.The alternate count views todays low as wave (b) of [ii] in an expanded flat configuration.
Wave (c) of [ii] should rally from here and break 1.2300 at the wave (a) high.
So what happened next?

Cable rallied all the way up to 1.2580 and topped out in wave (c) of [ii].
Thats a 500 pip rally over the following week to complete an expanded flat correction in wave [ii],
all called for by the wave count!
On September 20th I published this article:
Daily Elliott Wave Analysis – 09-20-19 – GBPUSD entering danger territory
And I was calling for a five wave decline to occur off that high in wave (i) down.
Heres the chart:
And here is what happened over the following week.
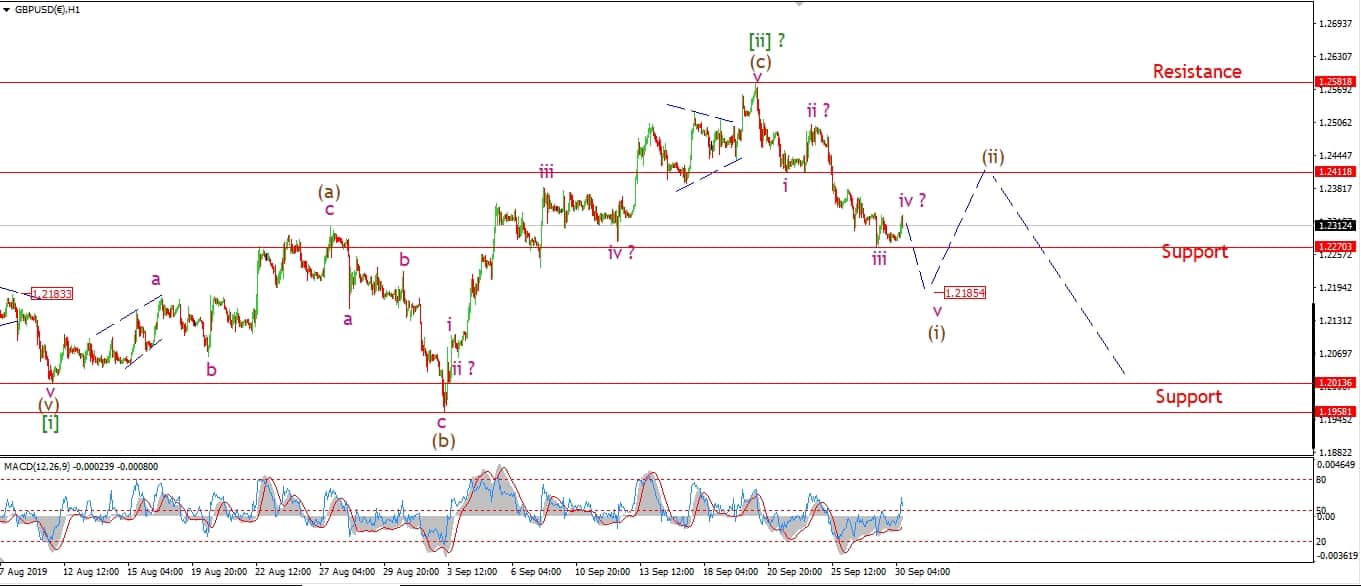
The wave count is progressing just fine,
the price fell 300 pips off that high.
With five waves down almost complete in wave (i) down.
The wave count can prove invaluable
when you are trying to sort through some very messy price action.
This example shows how you can spot turns on the fly
Check out the membership options today!