
[vc_row][vc_column][vc_separator border_width=”5″][/vc_column][/vc_row]
[vc_row][vc_column][vc_column_text]
Hi folks!
I am still working on fixing the website problem that occurred overnight.
I hope to be up and running soon.
I have posted tonights update on the blog to allow access to all.
Ok down to it.
[/vc_column_text][/vc_column][/vc_row]
[vc_row][vc_column][vc_separator border_width=”5″][/vc_column][/vc_row]
[vc_row][vc_column][vc_column_text]
EURUSD
[/vc_column_text][/vc_column][/vc_row]
[vc_row][vc_column][vc_separator border_width=”5″][/vc_column][/vc_row][vc_row][vc_column width=”2/3″][vc_custom_heading text=”1 hr” use_theme_fonts=”yes”][vc_column_text]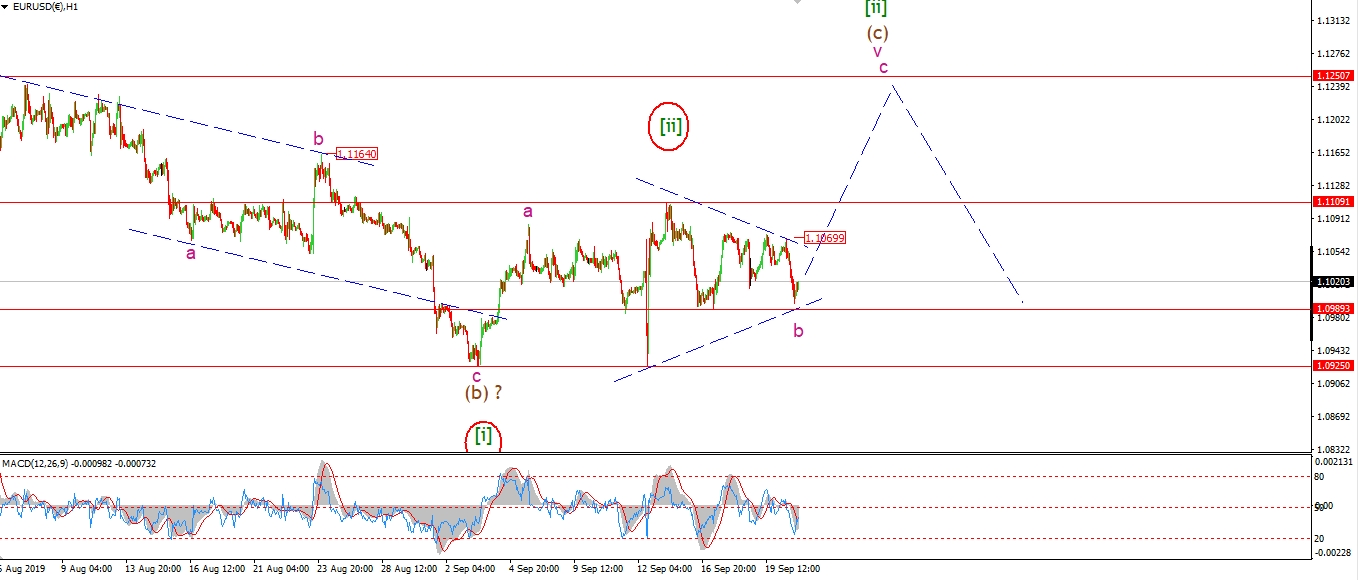 [/vc_column_text][/vc_column][vc_column width=”1/3″][vc_custom_heading text=”4 Hours” use_theme_fonts=”yes”][vc_column_text]
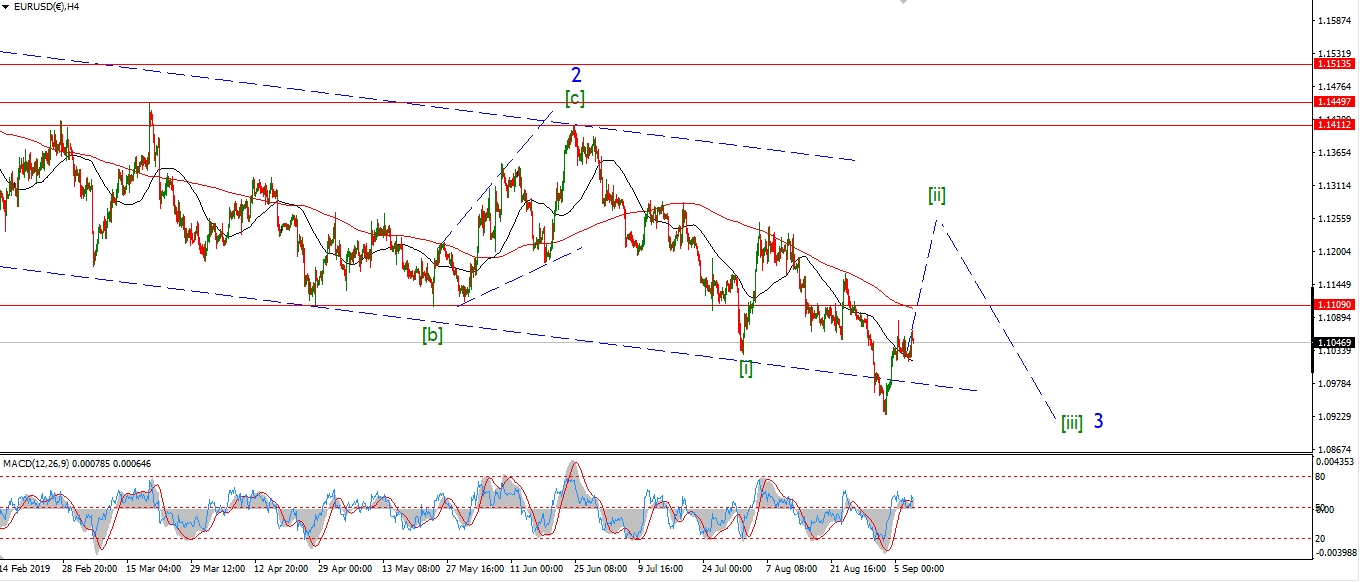 [/vc_column_text][vc_custom_heading text=”Daily” use_theme_fonts=”yes”][vc_column_text]
 [/vc_column_text][/vc_column][/vc_row]
[vc_row][vc_column][vc_column_text]
I have switched to the triangle idea fr wave ‘b’ of (c) this evening.
The decline today did not break 1.0989,
so that triangle is still valid so far.
If we see a bounce early on Monday that breaks 1.1070,
then we can confirm wave ‘c’ has begun.
Monday.
Watch for wave ‘b’ to complete the triangle above 1.0989 and run higher in wave ‘c’.
we should see an end to the larger wave (c) and [ii] by the end of next week.
[/vc_column_text][/vc_column][/vc_row]
[vc_row][vc_column][vc_separator border_width=”5″][/vc_column][/vc_row][vc_row][vc_column][vc_column_text]
GBPUSD
[/vc_column_text][/vc_column][/vc_row][vc_row][vc_column][vc_separator border_width=”5″][/vc_column][/vc_row][vc_row][vc_column width=”2/3″][vc_custom_heading text=”1 hr” use_theme_fonts=”yes”][vc_column_text]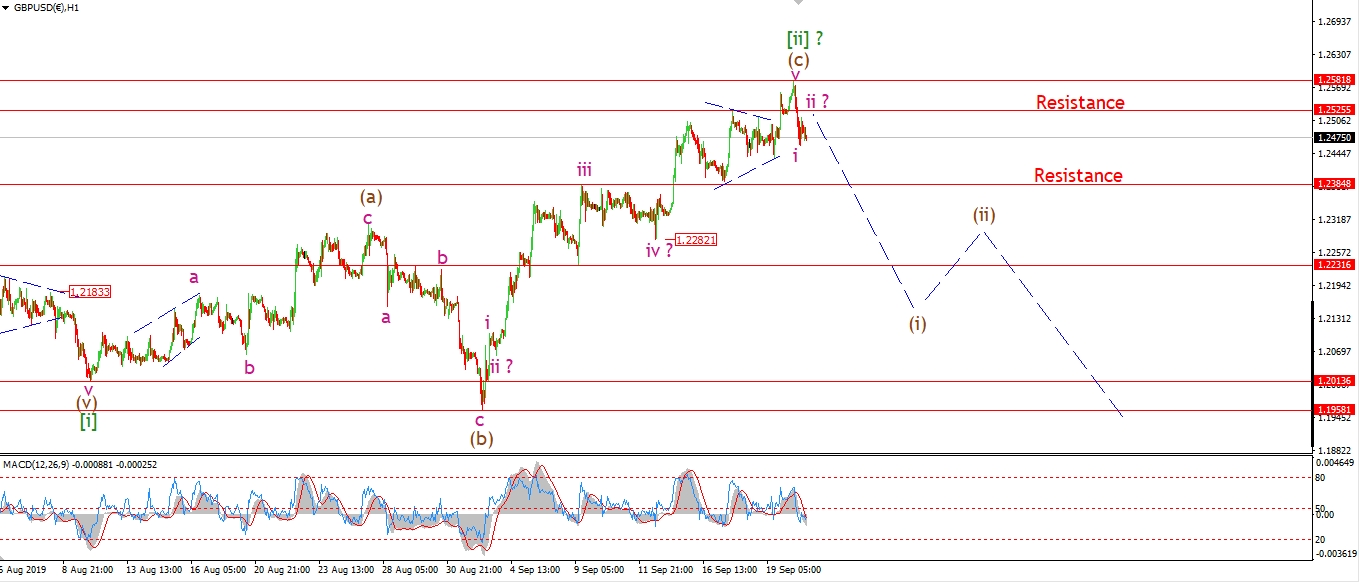 [/vc_column_text][/vc_column][vc_column width=”1/3″][vc_custom_heading text=”4 Hours” use_theme_fonts=”yes”][vc_column_text]
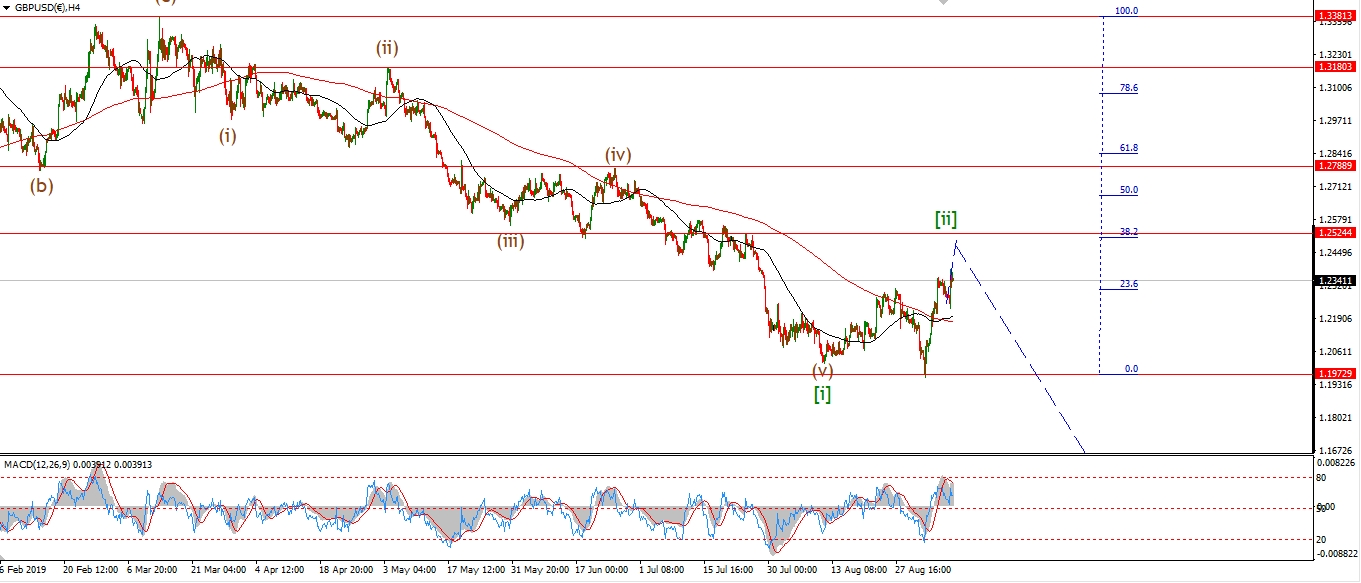 [/vc_column_text][vc_custom_heading text=”Daily” use_theme_fonts=”yes”][vc_column_text]
 [/vc_column_text][/vc_column][/vc_row]
[vc_row][vc_column][vc_column_text]
Cable spiked lower today off a slight new high at 1.2581.
This may be the initial drop that I have been looking for to begin wave (i) down.
I have labelled the decline as wave ‘i’ of (i),
with wave ‘ii’ now underway.
Wave ‘ii’ must complete below 1.2581 on Monday and then head lower again in wave ‘iii’ of (i).
If wave [ii] is now complete and wave [iii] has begun,
then then outlook of cable is very bleak for the rest of the year!
Monday;
Watch for wave (i) to continue lower and trace out a five wave pattern.
A bearish lower high is expected in wave (ii) which will lead to a sharp move down in wave (iii) of [iii] over the next month or so.
Lets see if we get five waves down next week.
[/vc_column_text][/vc_column][/vc_row]
[vc_row][vc_column][vc_separator border_width=”5″][/vc_column][/vc_row][vc_row][vc_column][vc_column_text]
USDJPY
[/vc_column_text][/vc_column][/vc_row][vc_row][vc_column][vc_separator border_width=”5″][/vc_column][/vc_row][vc_row][vc_column width=”2/3″][vc_custom_heading text=”1 hr” use_theme_fonts=”yes”][vc_column_text]
[/vc_column_text][/vc_column][vc_column width=”1/3″][vc_custom_heading text=”4 Hours” use_theme_fonts=”yes”][vc_column_text]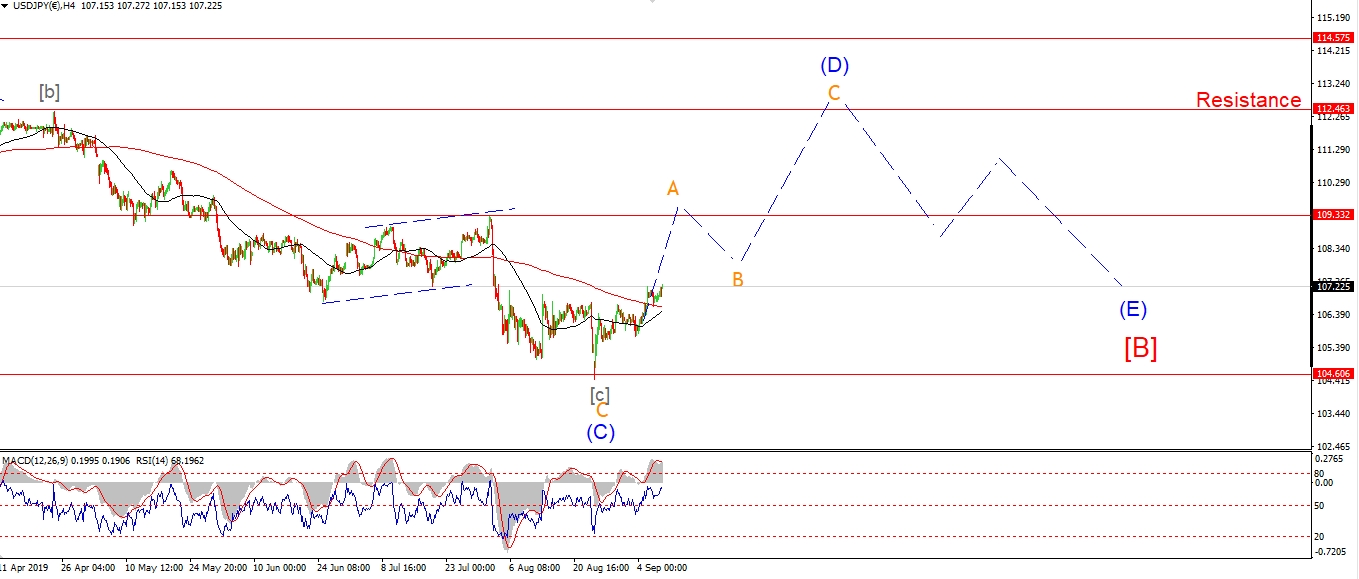 [/vc_column_text][vc_custom_heading text=”Daily” use_theme_fonts=”yes”][vc_column_text]
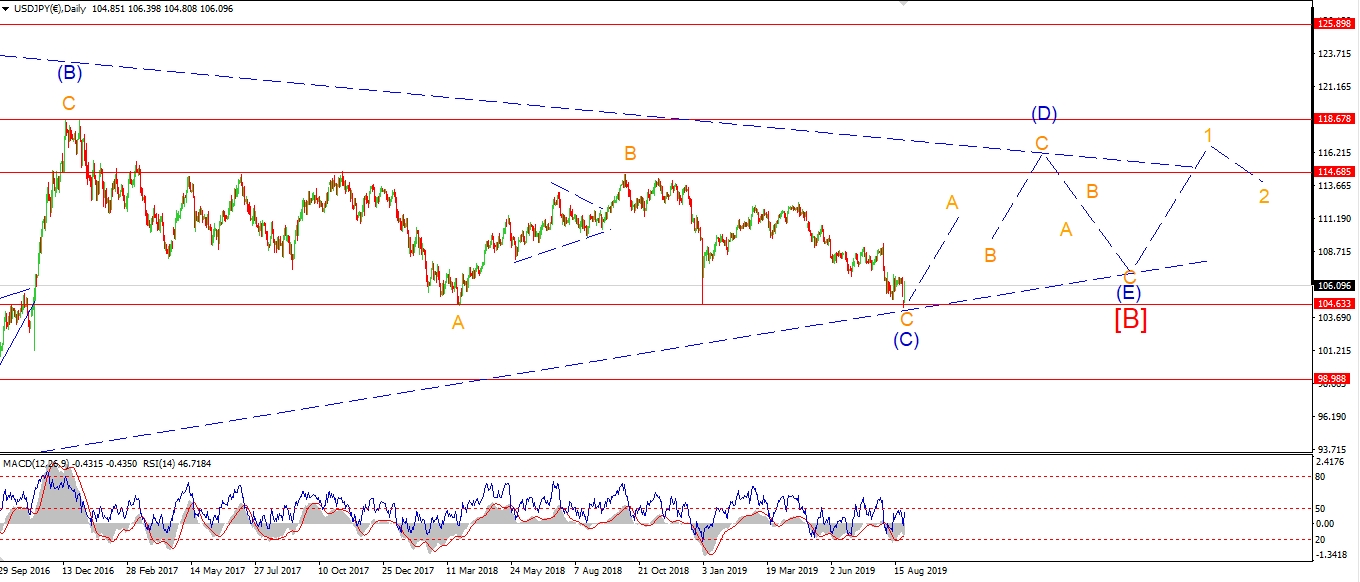 [/vc_column_text][/vc_column][/vc_row]
[vc_row][vc_column][vc_column_text]
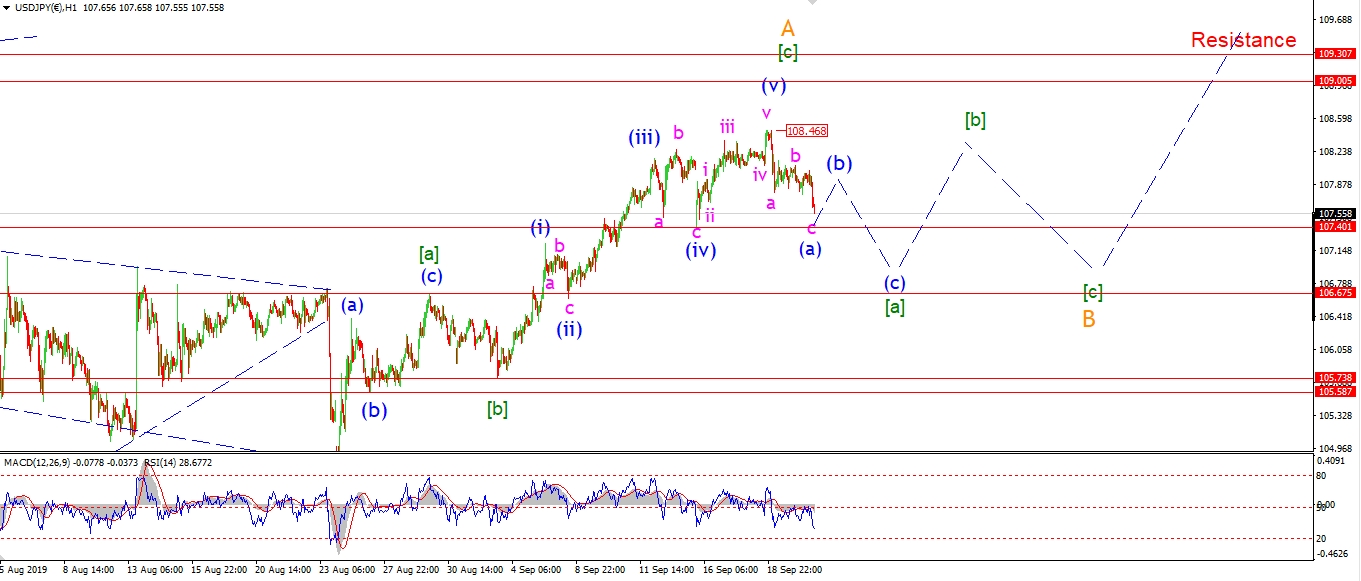
USDJPY has fallen in three waves into this evenings lows.
This three wave pattern should bring us close to the end of wave (a) of [a].
With waves (b) and (c) expected over the coming week.
The pattern in the larger wave ‘B’ is likely to be a very frustrating mess.
Overall it should simply churn sideways,
and ideally complete in the area of 106.70.
It’s going to be interesting,
but I expect some false starts and headaches with this one!
Monday;
Watch for wave (a) to complete
and wave (b) to rise in three waves to a lower high by midweek.
[/vc_column_text][/vc_column][/vc_row]
[vc_row][vc_column][vc_separator border_width=”5″][/vc_column][/vc_row][vc_row][vc_column][vc_column_text]
DOW JONES INDUSTRIALS
[/vc_column_text][/vc_column][/vc_row][vc_row][vc_column][vc_separator border_width=”5″][/vc_column][/vc_row][vc_row][vc_column width=”2/3″][vc_custom_heading text=”1 hr” use_theme_fonts=”yes”][vc_column_text]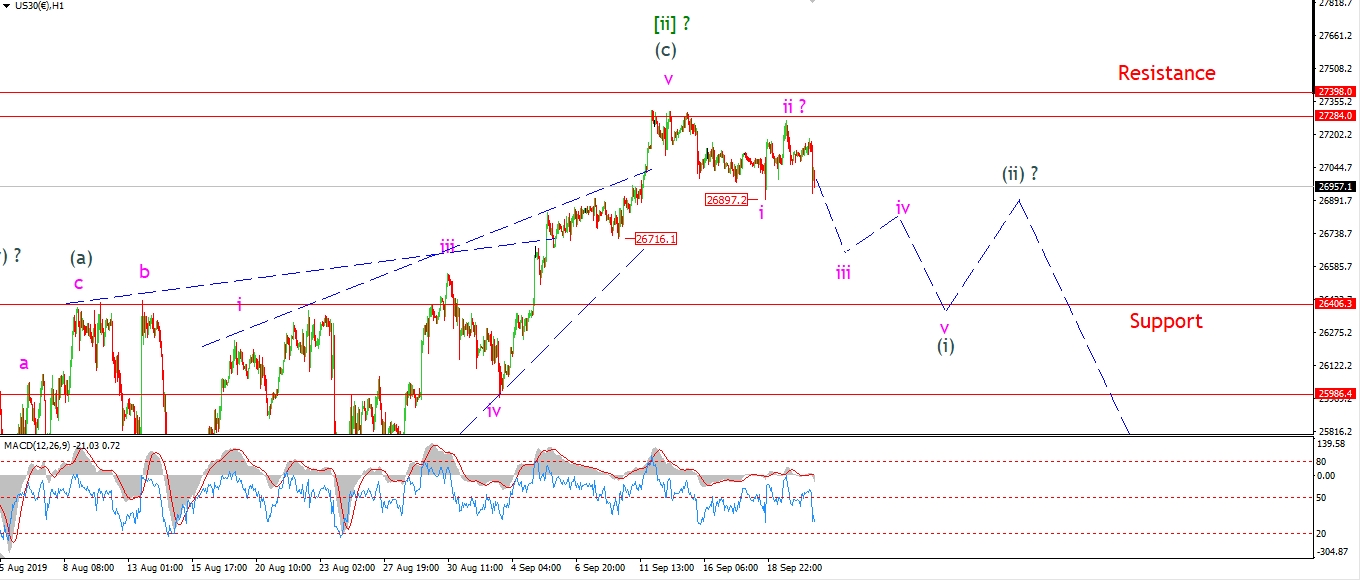 [/vc_column_text][/vc_column][vc_column width=”1/3″][vc_custom_heading text=”4 Hours” use_theme_fonts=”yes”][vc_column_text]
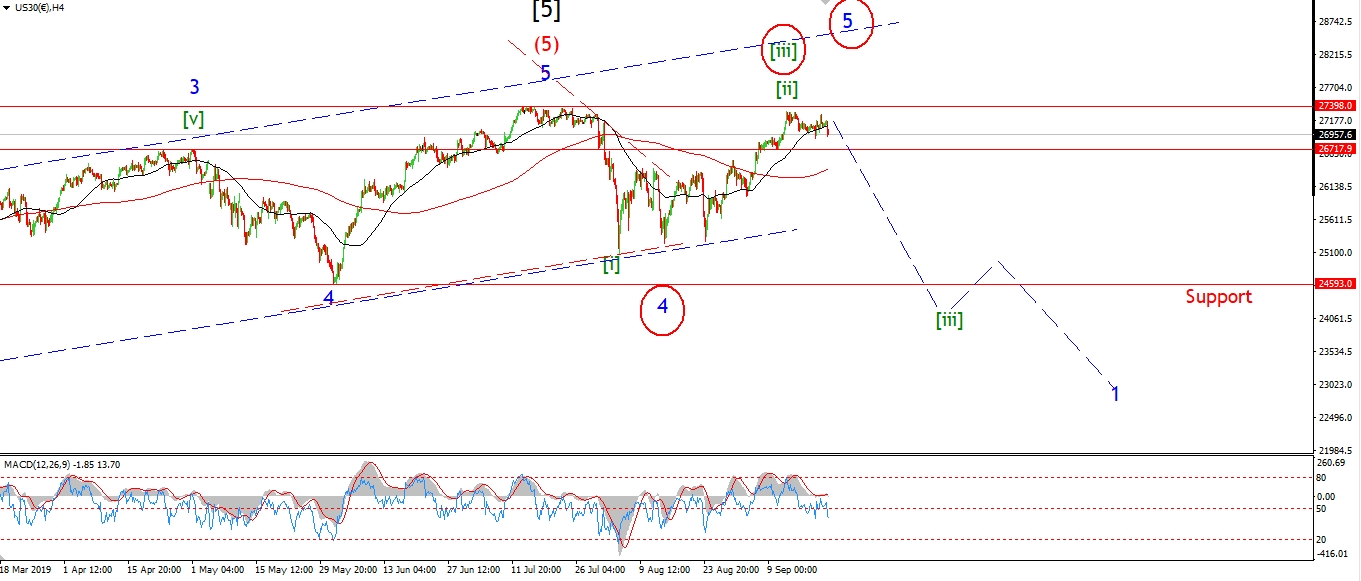 [/vc_column_text][vc_custom_heading text=”Daily” use_theme_fonts=”yes”][vc_column_text]
 [/vc_column_text][/vc_column][/vc_row]
[vc_row][vc_column][vc_column_text]
The DOW has again failed to break that all time high.
And the price did create a spike lower late in the trade.
The short term count is calling for a decline in a third wave,
but that has not happened yet.
The wave ‘i’ low lies at 26899.
If that low breaks in an impulsive fashion,
it will again favor the bearish count.
As the price is so close to breaking the bearish short term count,
I have to watch the alternate count on the 4hr chart.
This count views the whole sideways grind this year as a triangle in wave ‘4’ blue.
With wave ‘5’ blue now carrying the price higher again towards 28500 or so.
If we get a break of 27398 again next week,
then I will switch to that count.
Monday;
Watch for a possible drop in wave ‘iii’ to break 26899.
[/vc_column_text][/vc_column][/vc_row]
[vc_row][vc_column][vc_separator border_width=”5″][/vc_column][/vc_row][vc_row][vc_column][vc_column_text]
GOLD
[/vc_column_text][/vc_column][/vc_row][vc_row][vc_column][vc_separator border_width=”5″][/vc_column][/vc_row][vc_row][vc_column width=”2/3″][vc_custom_heading text=”1 hr” use_theme_fonts=”yes”][vc_column_text]
 [/vc_column_text][/vc_column][vc_column width=”1/3″][vc_custom_heading text=”4 Hours” use_theme_fonts=”yes”][vc_column_text]
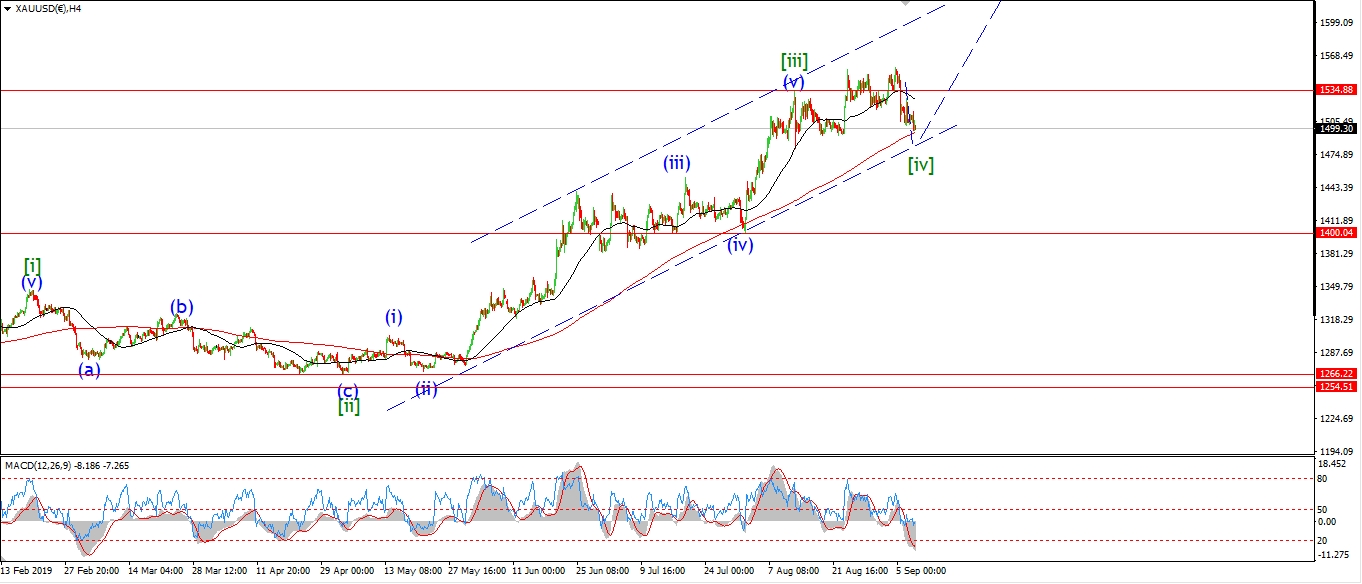 [/vc_column_text][vc_custom_heading text=”Daily” use_theme_fonts=”yes”][vc_column_text]
 [/vc_column_text][/vc_column][/vc_row]
[vc_row][vc_column][vc_column_text]
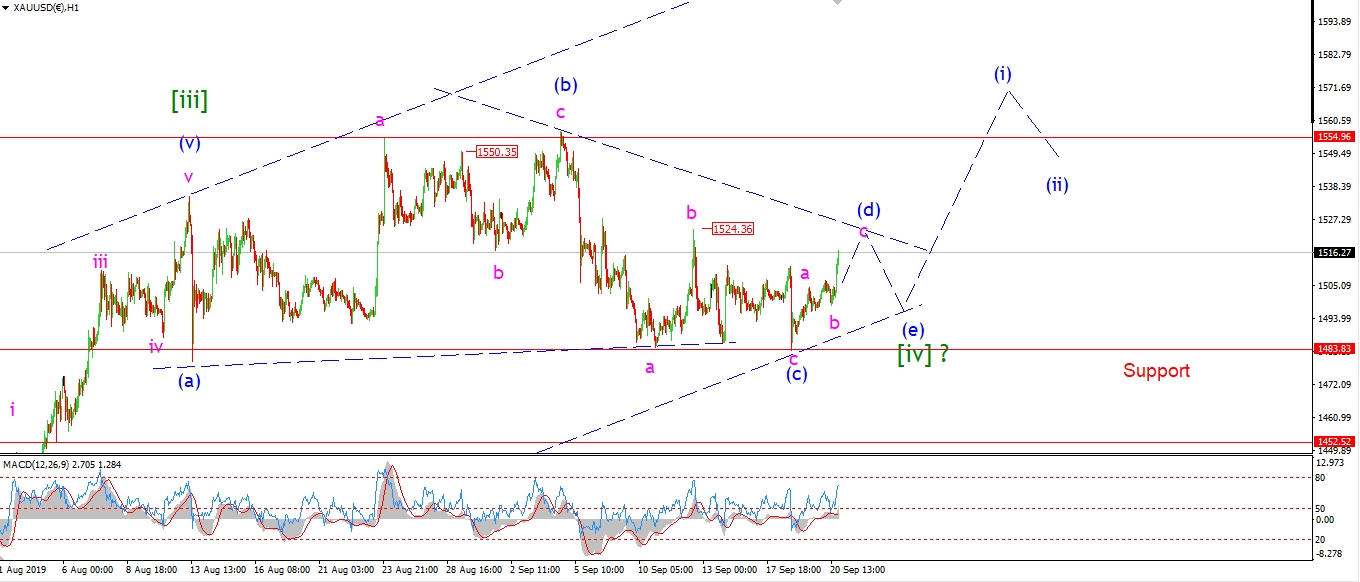
Gold is pushing higher again today in a three wave form off the 1483 low formed on Wednesday.
This action fits well in the triangle scenario for wave (d) of [iv].
And wave (d) should top out around 1520 again,
with the previous wave ‘b’ acting as a target / resistance.
Monday;
this triangle will likely take up much of the trade next week,
for now we can expect wave (d) to top out by Monday evening,
and wave (e) to turn lower again and complete above 1483.
[/vc_column_text][/vc_column][/vc_row]
[vc_row][vc_column][vc_separator border_width=”5″][/vc_column][/vc_row][vc_row][vc_column][vc_column_text]
U.S CRUDE OIL
[/vc_column_text][/vc_column][/vc_row][vc_row][vc_column][vc_separator border_width=”5″][/vc_column][/vc_row][vc_row][vc_column width=”2/3″][vc_custom_heading text=”1 hr” use_theme_fonts=”yes”][vc_column_text]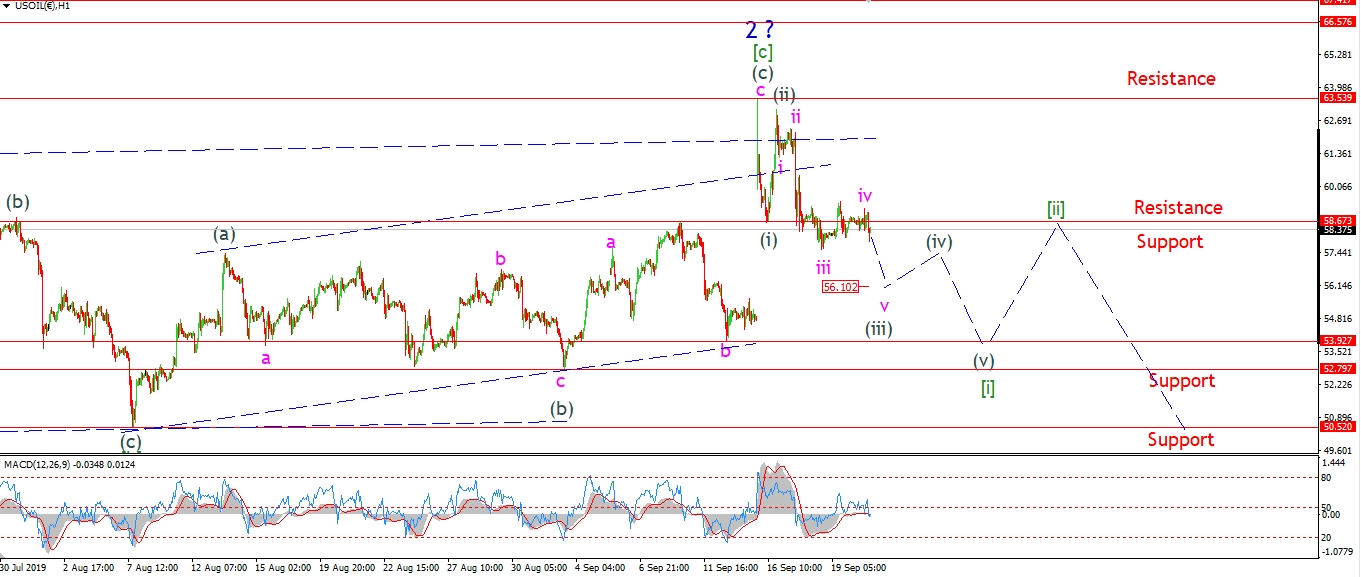 [/vc_column_text][/vc_column][vc_column width=”1/3″][vc_custom_heading text=”4 Hours” use_theme_fonts=”yes”][vc_column_text]
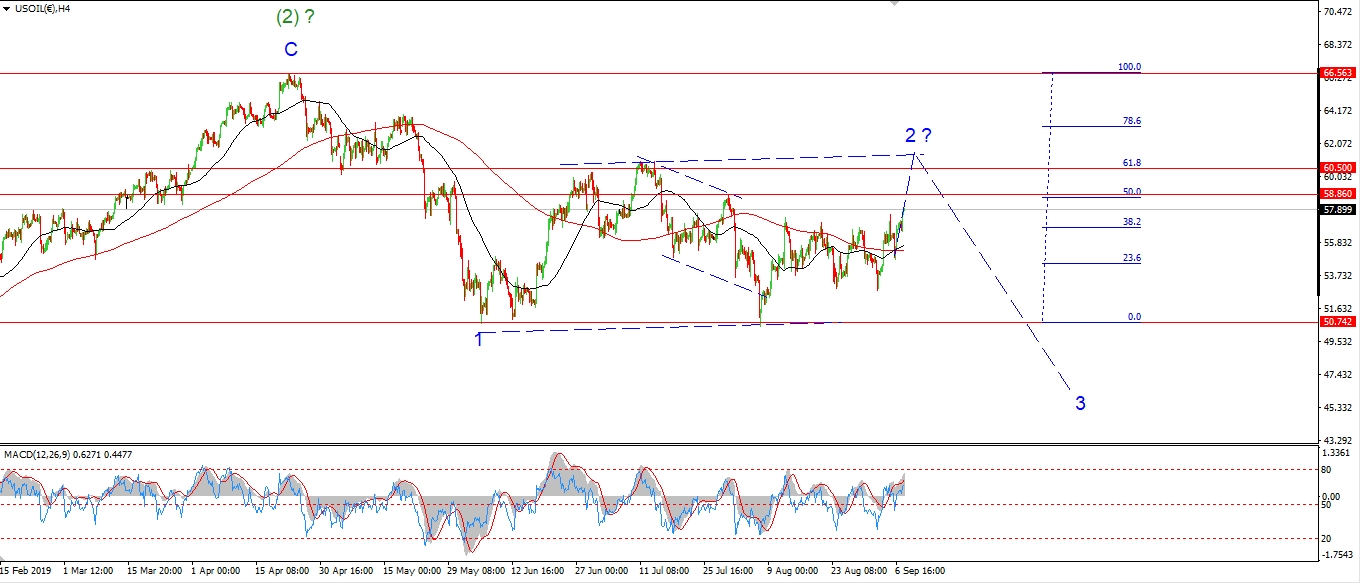 [/vc_column_text][vc_custom_heading text=”Daily” use_theme_fonts=”yes”][vc_column_text]
 [/vc_column_text][/vc_column][/vc_row]
[vc_row][vc_column][vc_column_text]
Crude is falling again this evening after a small correction sideways in wave ‘iv’ over the last few sessions.
The price should continue lower in wave ‘v’ of (iii) next week.
And wave ‘v’ should fill that gap created last Monday.
If the current short term count is correct,
then we should see further declines next week as wave [i] continues.
Wave [i] should break the 52.70 level at a minimum,
but I would prefer to see a break of 50.52 in wave [i] to confirm that wave ‘3’ blue was underway.
Monday;
Watch for wave ‘v’ of (iii) to drop to about 56.00 to complete a five wave pattern in wave (iii).
[/vc_column_text][/vc_column][/vc_row]
[vc_row][vc_column][vc_separator border_width=”5″][/vc_column][/vc_row][vc_row][vc_column][vc_column_text]
US 10 yr Treasuries.
[/vc_column_text][/vc_column][/vc_row][vc_row][vc_column][vc_separator border_width=”5″][/vc_column][/vc_row][vc_row][vc_column width=”2/3″][vc_custom_heading text=”1 hr” use_theme_fonts=”yes”][vc_column_text]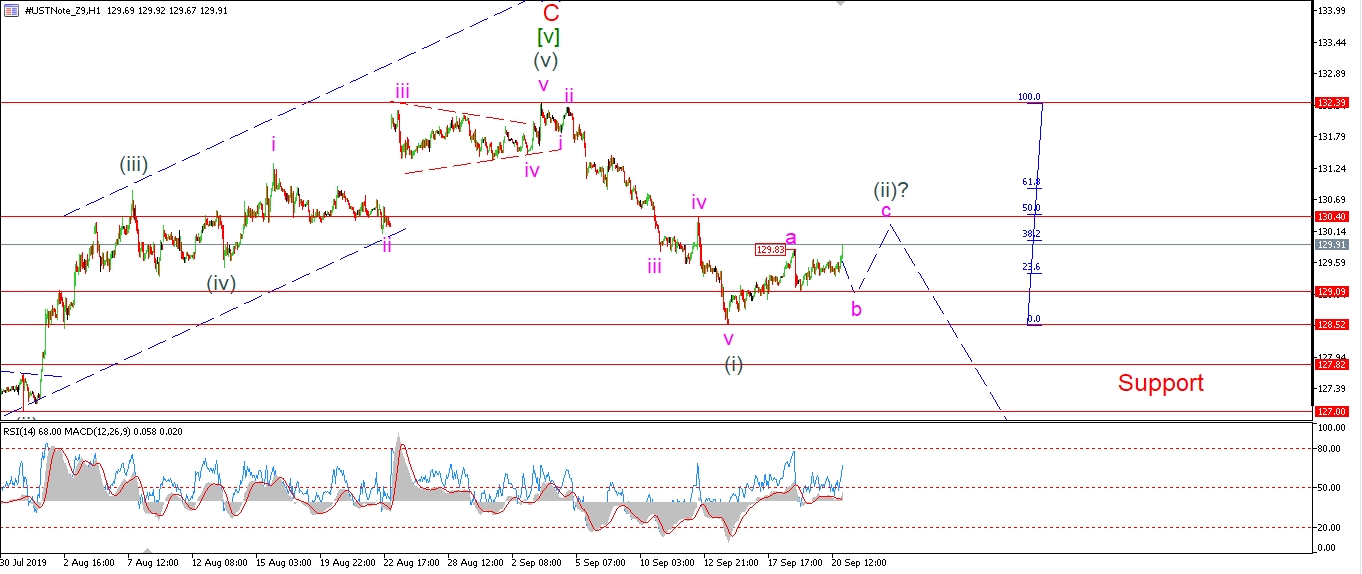 [/vc_column_text][/vc_column][vc_column width=”1/3″][vc_custom_heading text=”4 Hours” use_theme_fonts=”yes”][vc_column_text]
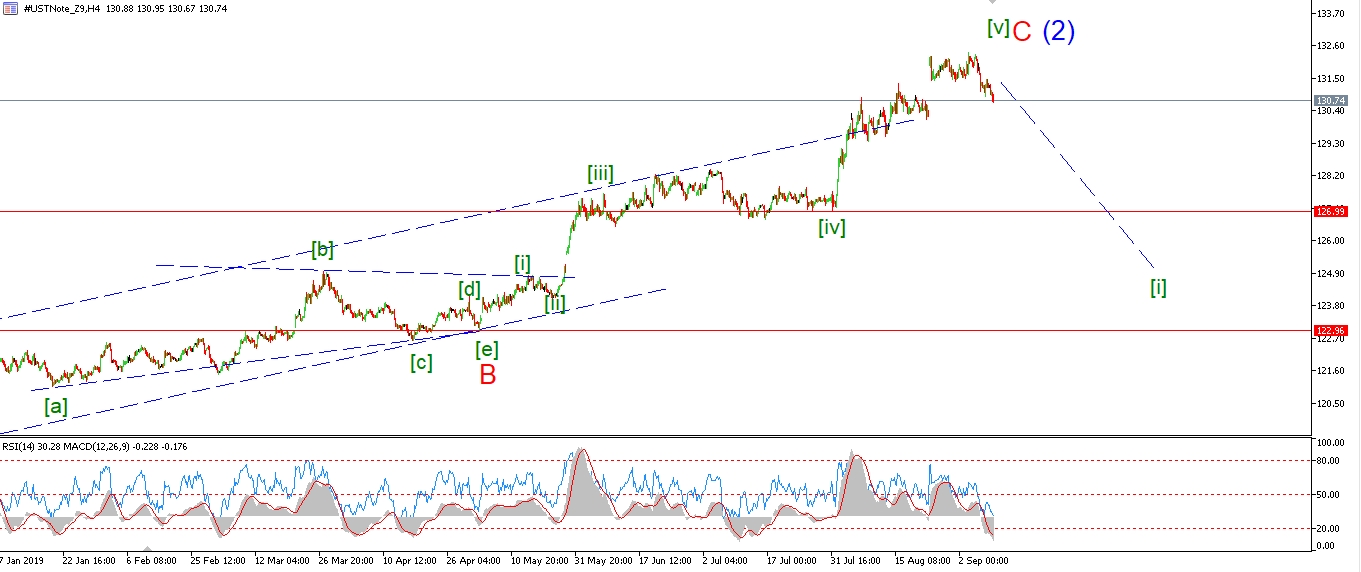 [/vc_column_text][vc_custom_heading text=”Daily” use_theme_fonts=”yes”][vc_column_text]
 [/vc_column_text][/vc_column][/vc_row]
[vc_row][vc_column][vc_column_text]
Wave ‘b’ of (ii) is tracing out a three wave rise off Thursdays low.
I thing this is the central wave within wave ‘b’,
and we should see another drop to a small double bottom on Monday
to complete wave ‘b’ at about 129.09.
Wave ‘c’ of (ii) is set to rally again to about 130.40 by the middle of next week.
Monday;
Watch for wave ‘b’ to complete a flat correction and then turn higher into wave ‘c’.
A lower high in wave (ii) will complete a bearish signal in Bonds.
[/vc_column_text][/vc_column][/vc_row]
[vc_row][vc_column][vc_separator border_width=”5″][/vc_column][/vc_row][vc_row][vc_column][vc_column_text]
SILVER
[/vc_column_text][/vc_column][/vc_row][vc_row][vc_column][vc_separator border_width=”5″][/vc_column][/vc_row][vc_row][vc_column width=”2/3″][vc_custom_heading text=”1 hr” use_theme_fonts=”yes”][vc_column_text]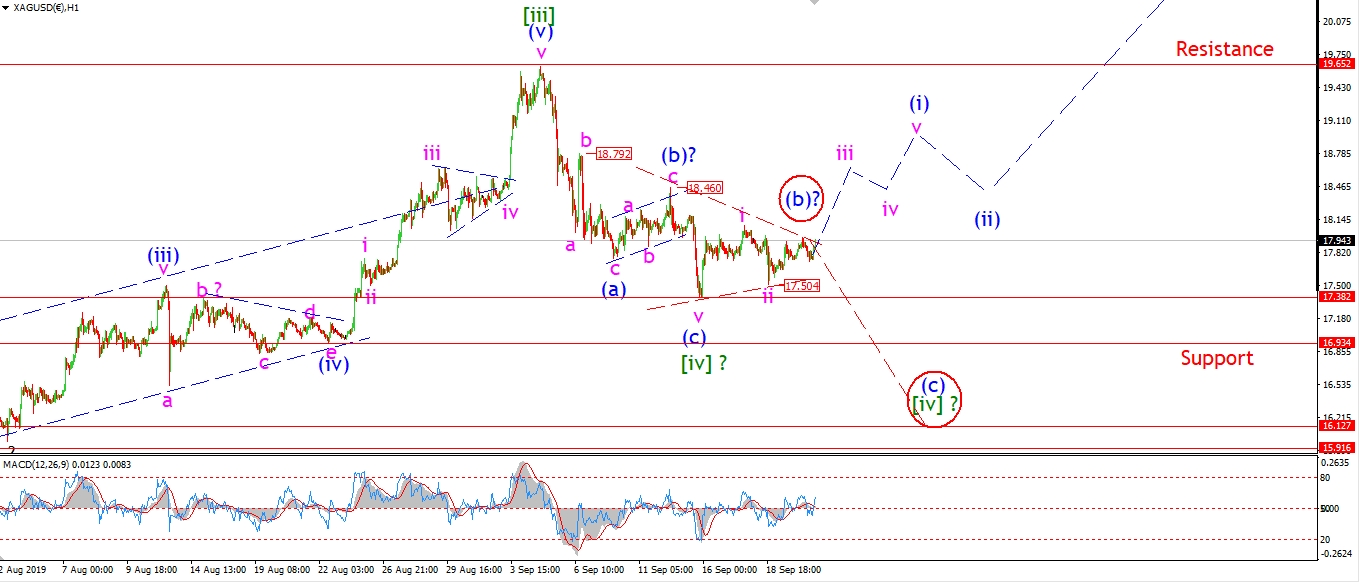 [/vc_column_text][/vc_column][vc_column width=”1/3″][vc_custom_heading text=”4 Hours” use_theme_fonts=”yes”][vc_column_text]
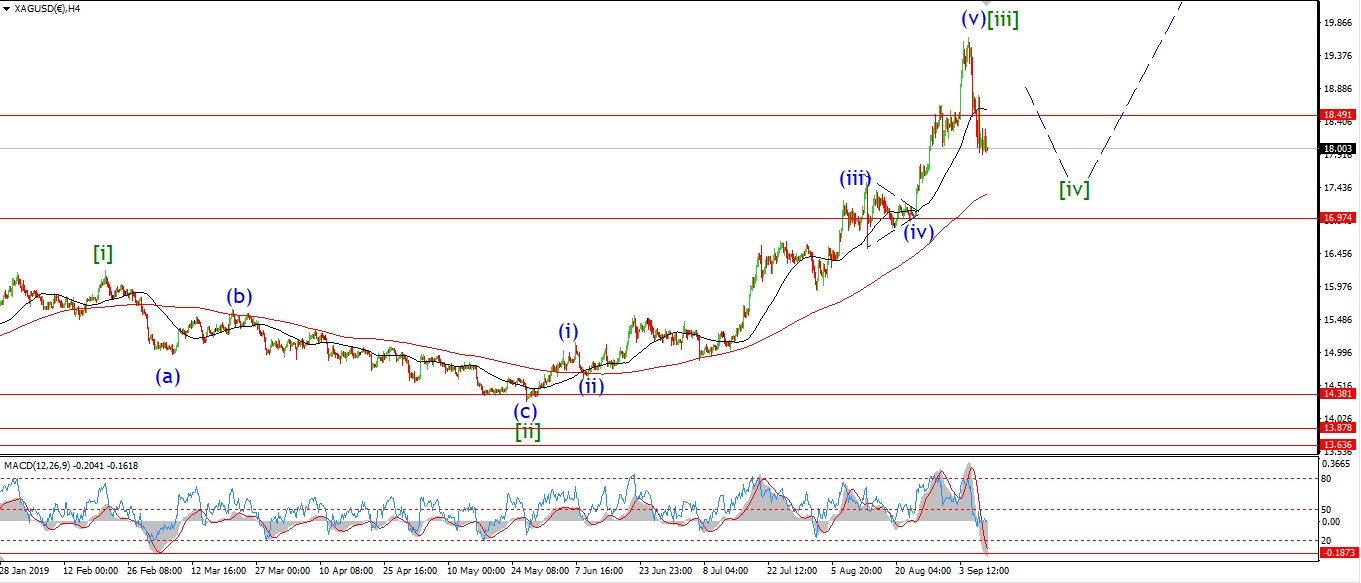 [/vc_column_text][vc_custom_heading text=”Daily” use_theme_fonts=”yes”][vc_column_text]
 [/vc_column_text][/vc_column][/vc_row]
[vc_row][vc_column][vc_column_text]
Todays action has not confirmed either of the current counts.
With that in mind,
the alternate count showing a triangle for wave (b) is very much in play now.
And if we see a drop below 17.38 early next week,
that ill allow wave (c) to fall to about 16.12 to complete.
That level is where waves (a) and (c) reach equality.
Monday;
The bullish count will be confirmed with a break of 18.46.
So watch for wave ‘ii’ to hold at 17.50.
And wave ‘iii’ of (i) to push higher again.
[/vc_column_text][/vc_column][/vc_row]
[vc_row][vc_column][vc_separator border_width=”5″][/vc_column][/vc_row][vc_row][vc_column][vc_column_text]
S&P 500.
[/vc_column_text][/vc_column][/vc_row][vc_row][vc_column][vc_separator border_width=”5″][/vc_column][/vc_row][vc_row][vc_column width=”2/3″][vc_custom_heading text=”1 hr” use_theme_fonts=”yes”][vc_column_text]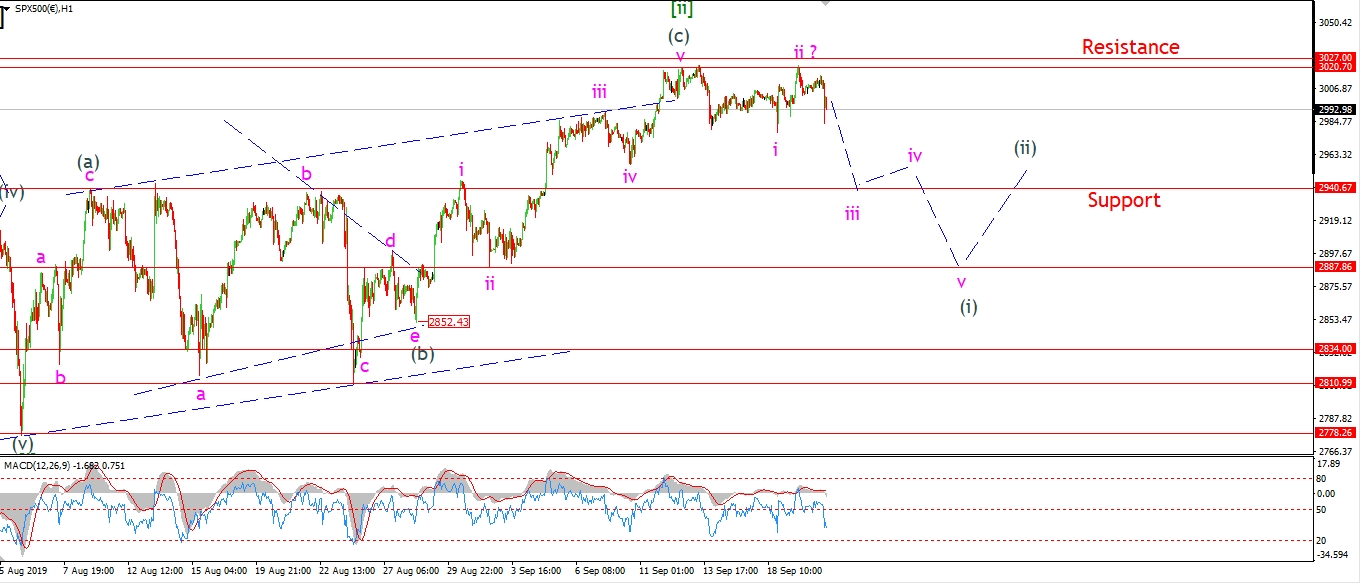 [/vc_column_text][/vc_column][vc_column width=”1/3″][vc_custom_heading text=”4 Hours” use_theme_fonts=”yes”][vc_column_text]
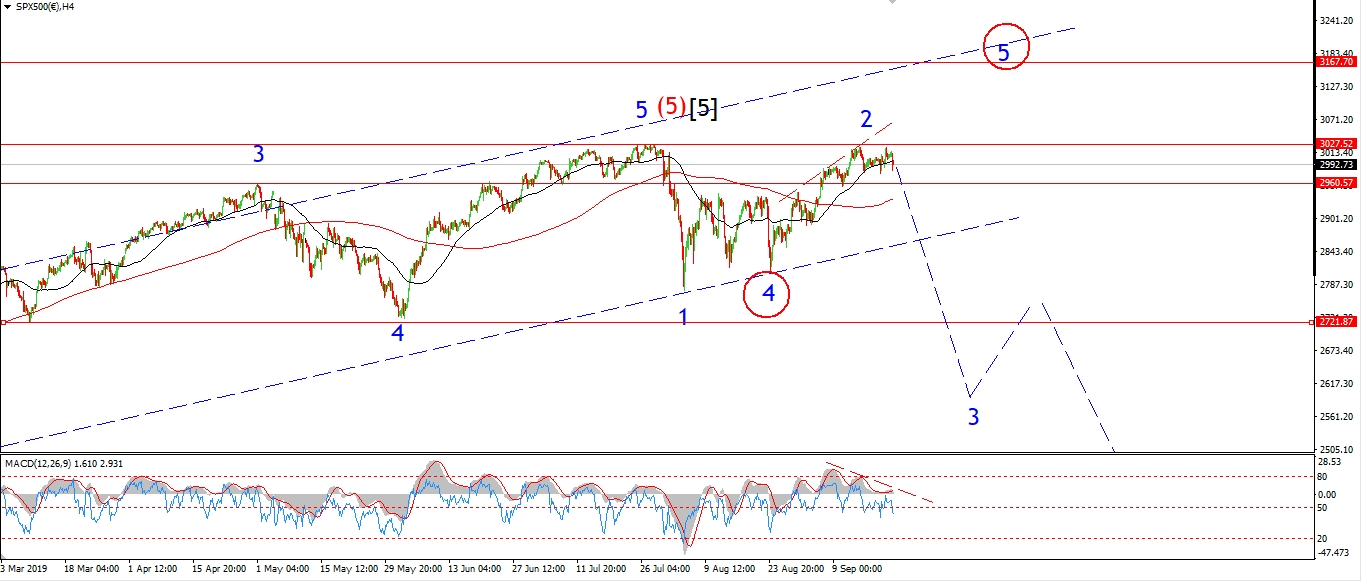 [/vc_column_text][vc_custom_heading text=”Daily” use_theme_fonts=”yes”][vc_column_text]
 [/vc_column_text][/vc_column][/vc_row]
[vc_row][vc_column][vc_column_text]
Another spike lower today offers some hope to the long suffering bearish wave count.
We need to see this decline continue on Monday
and break that 2940 level pretty quickly in stay with this short term count.
Otherwise I will have to switch to the alternate view as shown in the 4hr chart.
Monday;
It is a wait and see moment in the S&P,
A break to a new high again will trigger that wave ‘5’ rally
in that case wave ‘5’ will top out in the area of 3150 as shown.
However if wave ‘iii’ breaks 2940 again,
I will consider that a signal that the bearish count is back on track.
[/vc_column_text][/vc_column][/vc_row]
[vc_row][vc_column][vc_separator border_width=”5″][/vc_column][/vc_row]