
[vc_row][vc_column][vc_separator border_width=”5″][/vc_column][/vc_row]
[vc_row][vc_column][vc_column_text]
Good evening to one and all and welcome back to a fresh new month!
I will lead with this chart and I will talk about it later!
At a glance though, this picture shows us whats coming.
[/vc_column_text][/vc_column][/vc_row]
[vc_row][vc_column][vc_separator border_width=”5″][/vc_column][/vc_row]
[vc_row][vc_column][vc_column_text]
EURUSD
[/vc_column_text][/vc_column][/vc_row]
[vc_row][vc_column][vc_separator border_width=”5″][/vc_column][/vc_row][vc_row][vc_column width=”2/3″][vc_custom_heading text=”1 hr” use_theme_fonts=”yes”][vc_column_text]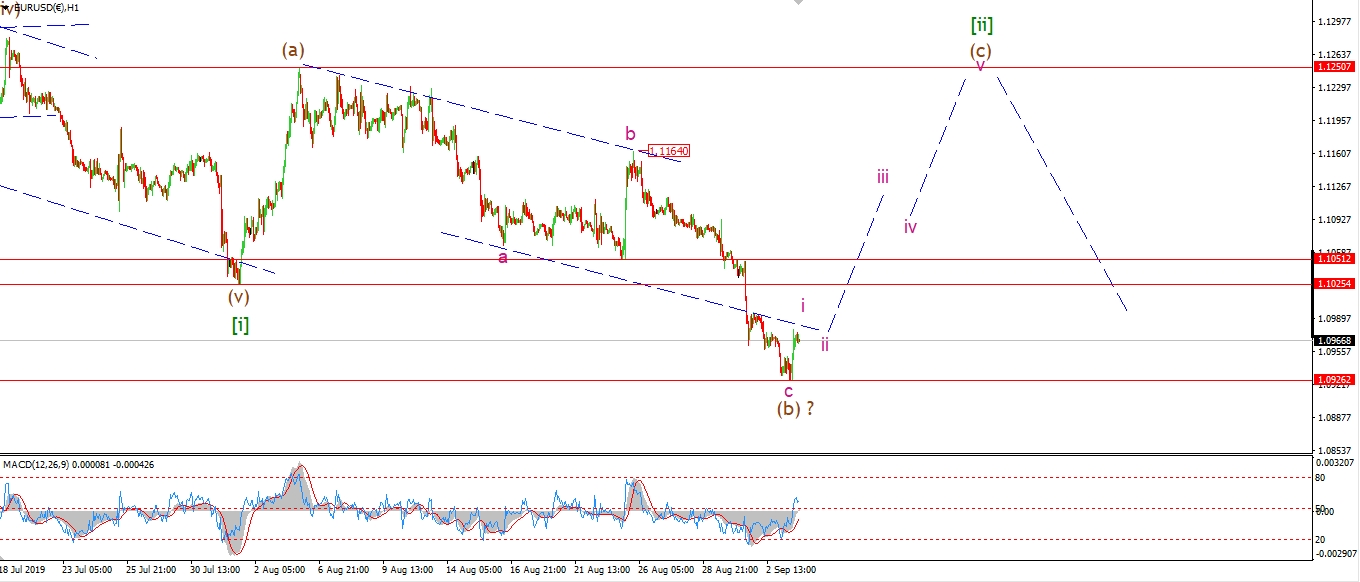 [/vc_column_text][/vc_column][vc_column width=”1/3″][vc_custom_heading text=”4 Hours” use_theme_fonts=”yes”][vc_column_text]
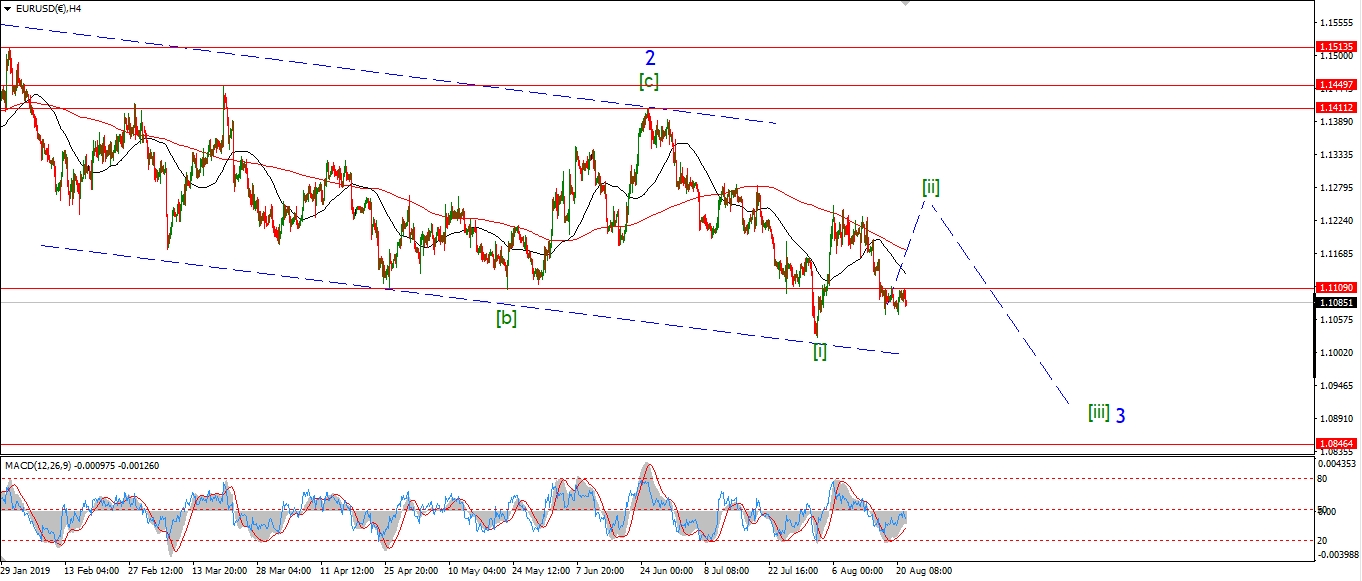 [/vc_column_text][vc_custom_heading text=”Daily” use_theme_fonts=”yes”][vc_column_text]
 [/vc_column_text][/vc_column][/vc_row]
[vc_row][vc_column][vc_column_text]
EURUSD has traced out a three wave decline in wave (b) of [ii] over the last few weeks.
This decline has now created a throw over in wave ‘c’ of (b) after todays decline.
And off todays lows,
we have seen the first meaningful rally in EURUSD in over a week.
I am more confident that wave (c) has now begun after todays spike higher.
All going well,
wave (c) of [ii] should now continue higher for the rest of the week.
Tomorrow;
watch for the low of the session to hold at 1.0926.
Waves ‘i’ and ‘ii’ of (c) should now create that long awaited higher low to kick off wave (c).
[/vc_column_text][/vc_column][/vc_row]
[vc_row][vc_column][vc_separator border_width=”5″][/vc_column][/vc_row][vc_row][vc_column][vc_column_text]
GBPUSD
[/vc_column_text][/vc_column][/vc_row][vc_row][vc_column][vc_separator border_width=”5″][/vc_column][/vc_row][vc_row][vc_column width=”2/3″][vc_custom_heading text=”1 hr” use_theme_fonts=”yes”][vc_column_text]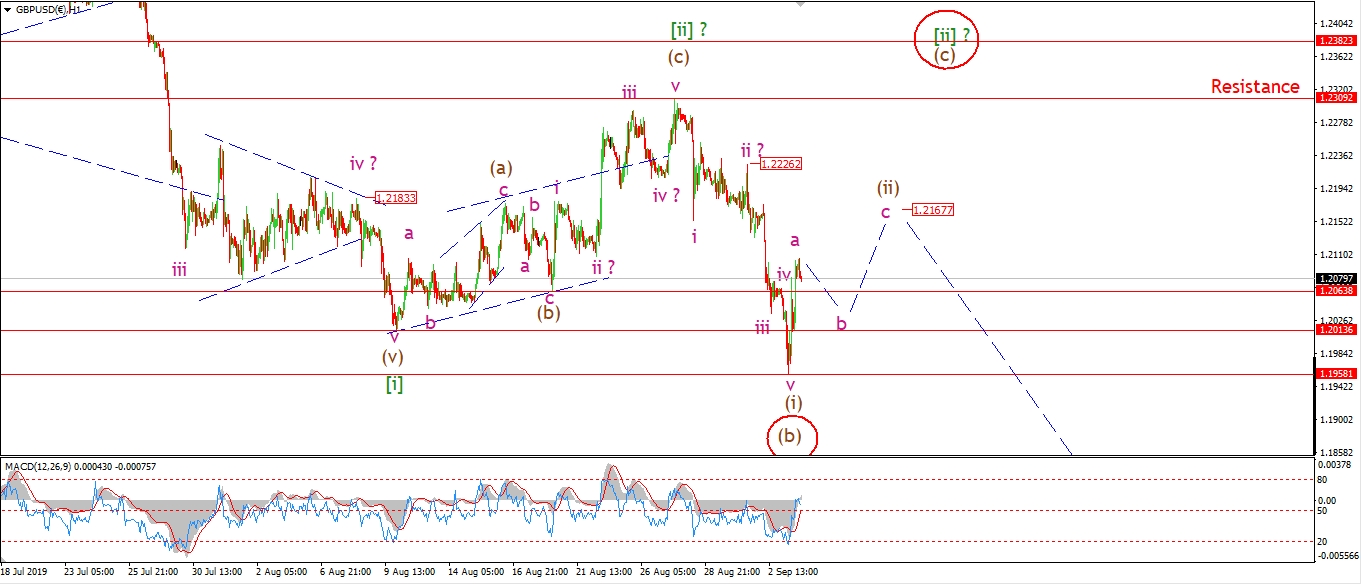 [/vc_column_text][/vc_column][vc_column width=”1/3″][vc_custom_heading text=”4 Hours” use_theme_fonts=”yes”][vc_column_text]
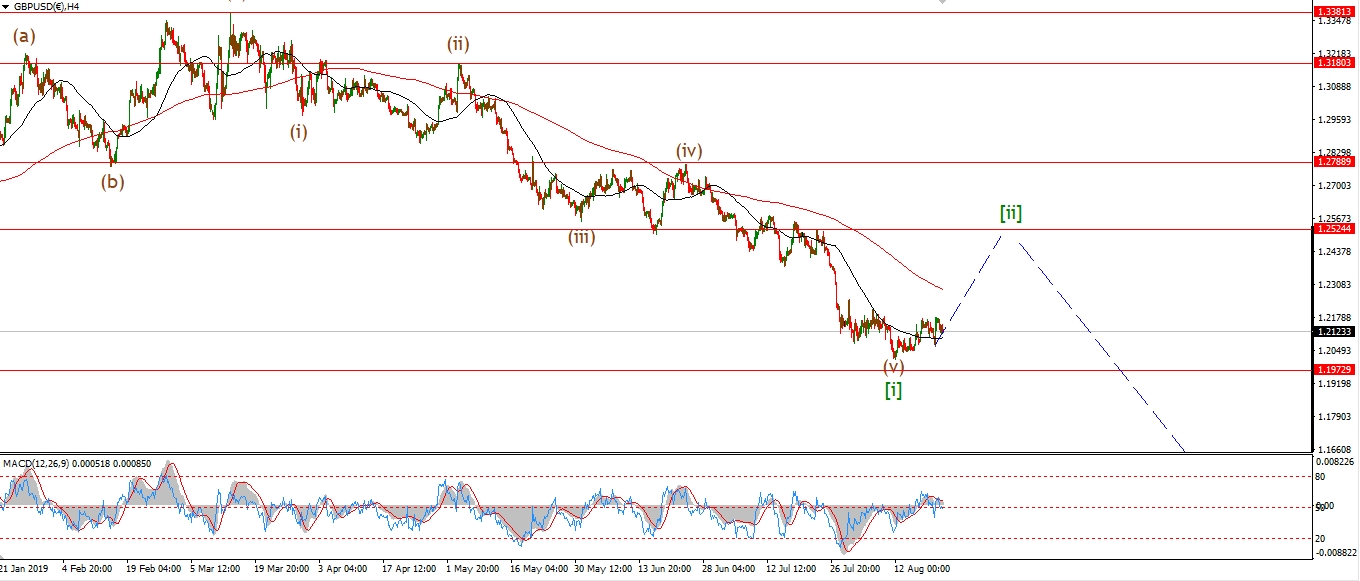 [/vc_column_text][vc_custom_heading text=”Daily” use_theme_fonts=”yes”][vc_column_text]
 [/vc_column_text][/vc_column][/vc_row]
[vc_row][vc_column][vc_column_text]
Cable punched lower this morning and broke the wave [i] low at 1.2013.
There is two distinct ways to view the recent decline,
and both counts call for a rally off the low.
The current count views todays lows as wave (i) of [iii] down.
And now we are seeing a rally in wave (ii) of [iii].
Wave (ii) should create a three wave rally overall
and top out at about 1.2170.
The alternate count views todays low as wave (b) of [ii] in an expanded flat configuration.
Wave (c) of [ii] should rally from here and break 1.2300 at the wave (a) high.
Tomorrow;
Watch for this rally to continue either way.
1.1958 must hold for at least a few more days as wave (ii) completes.
If we see a break of 1.2250 that will favor the alternate count.
[/vc_column_text][/vc_column][/vc_row]
[vc_row][vc_column][vc_separator border_width=”5″][/vc_column][/vc_row][vc_row][vc_column][vc_column_text]
USDJPY
[/vc_column_text][/vc_column][/vc_row][vc_row][vc_column][vc_separator border_width=”5″][/vc_column][/vc_row][vc_row][vc_column width=”2/3″][vc_custom_heading text=”1 hr” use_theme_fonts=”yes”][vc_column_text]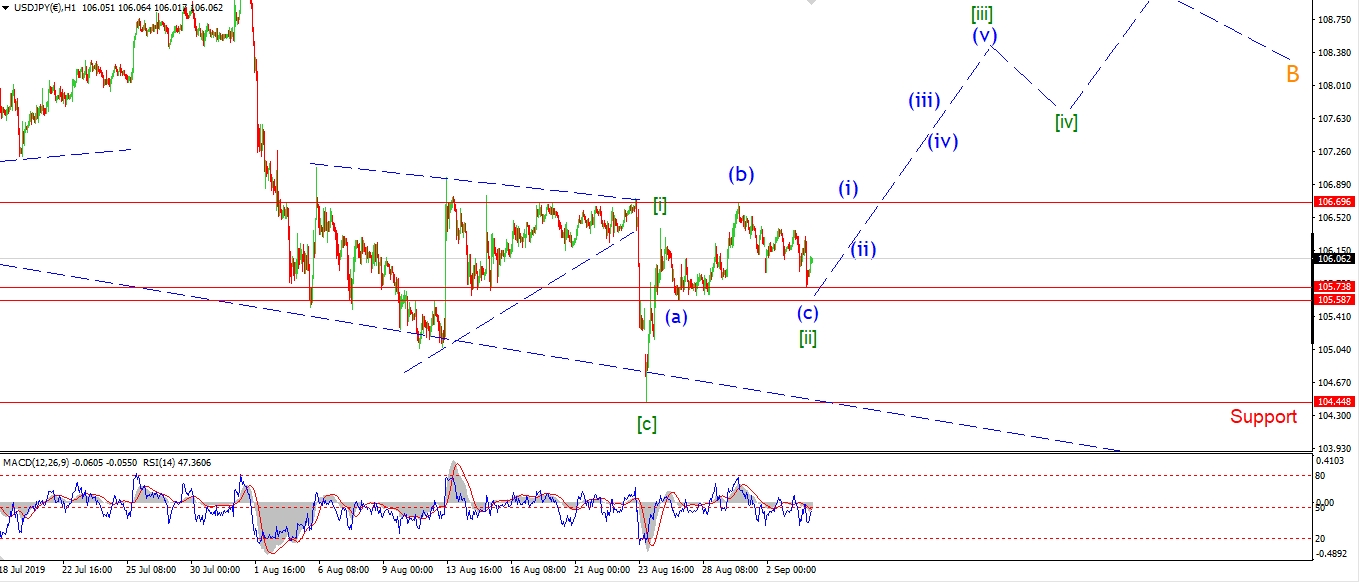 [/vc_column_text][/vc_column][vc_column width=”1/3″][vc_custom_heading text=”4 Hours” use_theme_fonts=”yes”][vc_column_text]
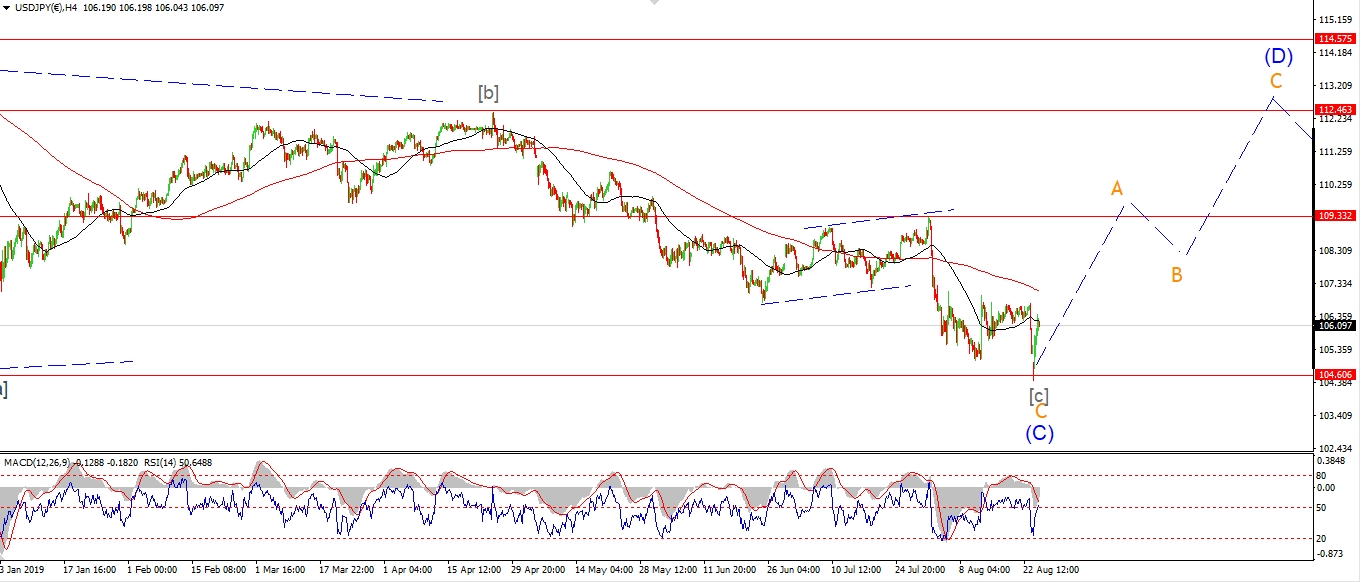 [/vc_column_text][vc_custom_heading text=”Daily” use_theme_fonts=”yes”][vc_column_text]
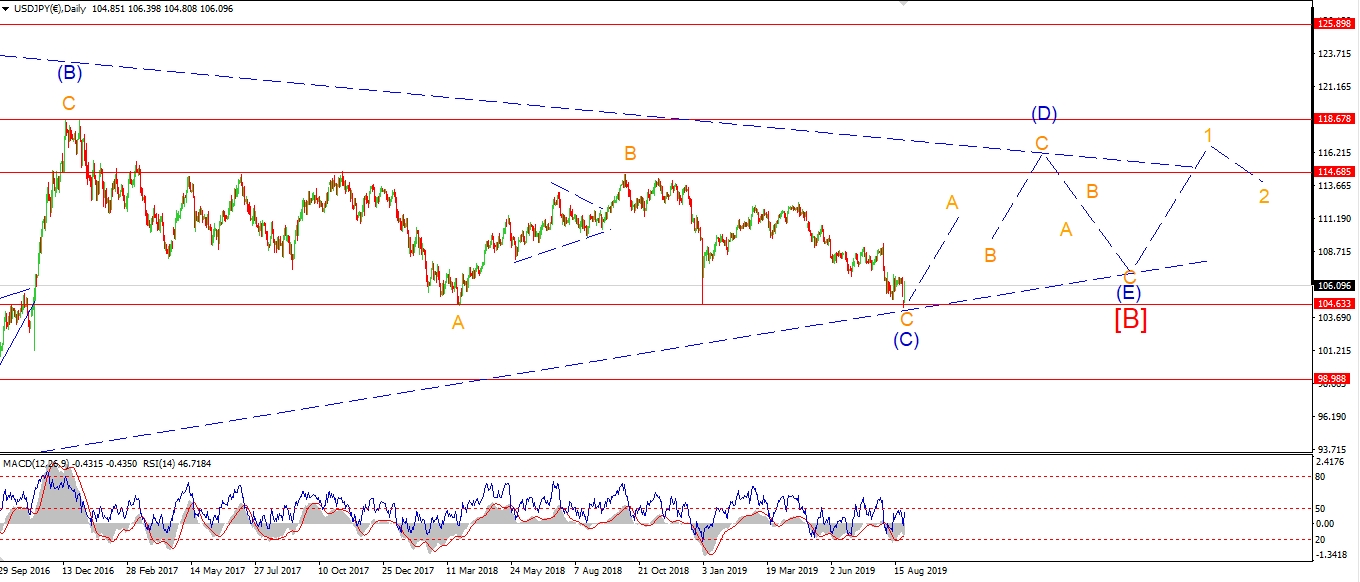 [/vc_column_text][/vc_column][/vc_row]
[vc_row][vc_column][vc_column_text]
It is possible that todays low has completed wave (c) of [ii]
as a running flat correction as shown on the short term count.
It is an outside chance, but,
if the price continues higher and breaks 106.69 from here,
that will signal wave [iii] up has begun.
If we see a five wave rally off todays lows,
that should confirm the bullish count.
Tomorrow;
watch for wave (i) of [iii] to continue higher in five waves overnight.
Wave (ii) must hold above 105.73 tomorrow.
[/vc_column_text][/vc_column][/vc_row]
[vc_row][vc_column][vc_separator border_width=”5″][/vc_column][/vc_row][vc_row][vc_column][vc_column_text]
DOW JONES INDUSTRIALS
[/vc_column_text][/vc_column][/vc_row][vc_row][vc_column][vc_separator border_width=”5″][/vc_column][/vc_row][vc_row][vc_column width=”2/3″][vc_custom_heading text=”1 hr” use_theme_fonts=”yes”][vc_column_text]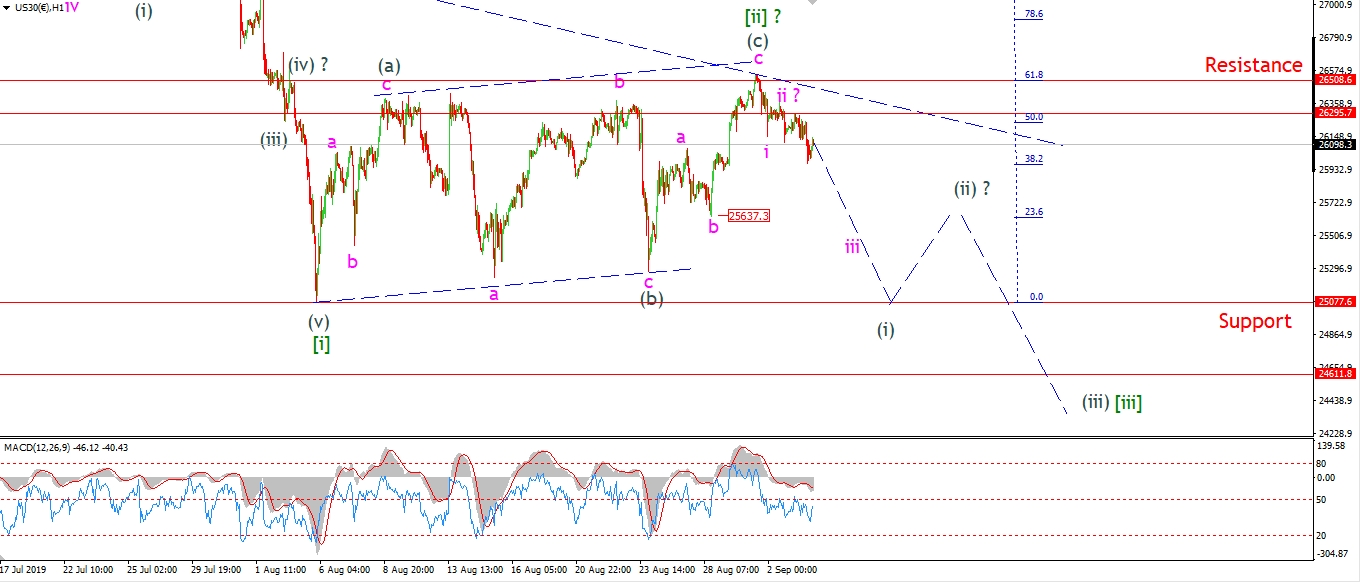 [/vc_column_text][/vc_column][vc_column width=”1/3″][vc_custom_heading text=”4 Hours” use_theme_fonts=”yes”][vc_column_text]
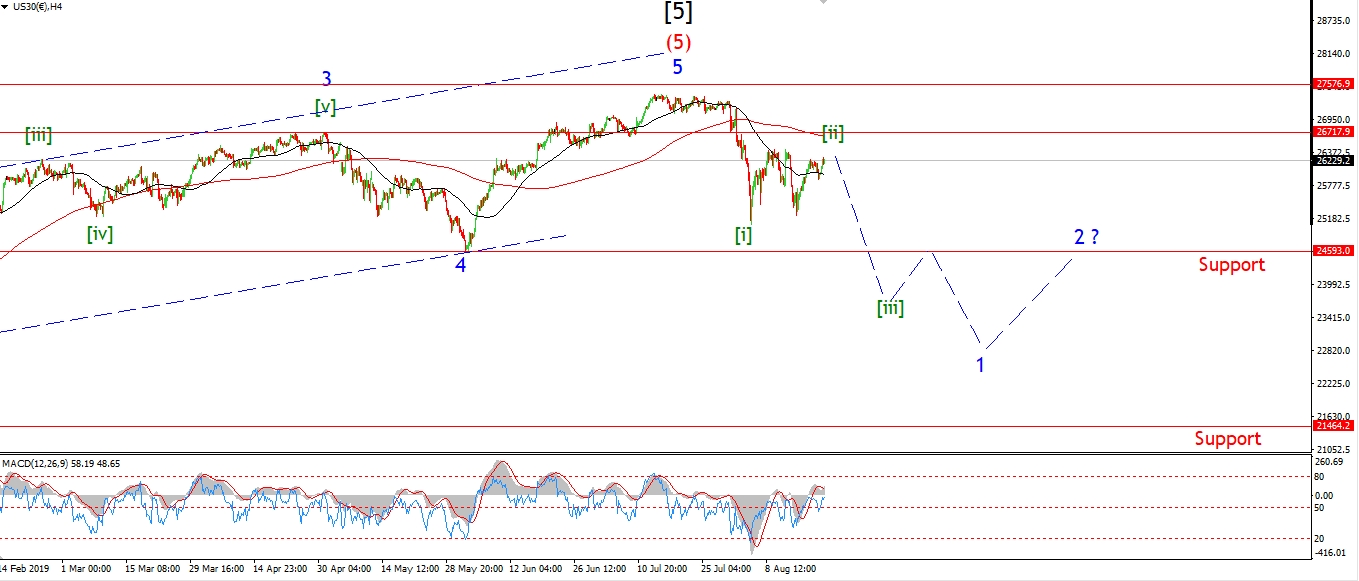 [/vc_column_text][vc_custom_heading text=”Daily” use_theme_fonts=”yes”][vc_column_text]
 [/vc_column_text][/vc_column][/vc_row]
[vc_row][vc_column][vc_column_text]
The DOW has started the week on the downside,
but the declines are not that encouraging just yet.
If the price continues lower tomorrow and breaks 25600 again.
That action will break the previous wave ‘b’ of (c),
and will favor a new impulsive pattern to the downside.
Wave (i) down must trace out a five wave decline,
so the action this week will be crucial in waves (i) and (ii),
to set up the larger decline that I am anticipating in wave [iii] green.
Tomorrow;
Watch for wave ‘iii’ of (i) to push lower again and break 25600.
[/vc_column_text][/vc_column][/vc_row]
[vc_row][vc_column][vc_separator border_width=”5″][/vc_column][/vc_row][vc_row][vc_column][vc_column_text]
GOLD
[/vc_column_text][/vc_column][/vc_row][vc_row][vc_column][vc_separator border_width=”5″][/vc_column][/vc_row][vc_row][vc_column width=”2/3″][vc_custom_heading text=”1 hr” use_theme_fonts=”yes”][vc_column_text]
 [/vc_column_text][/vc_column][vc_column width=”1/3″][vc_custom_heading text=”4 Hours” use_theme_fonts=”yes”][vc_column_text]
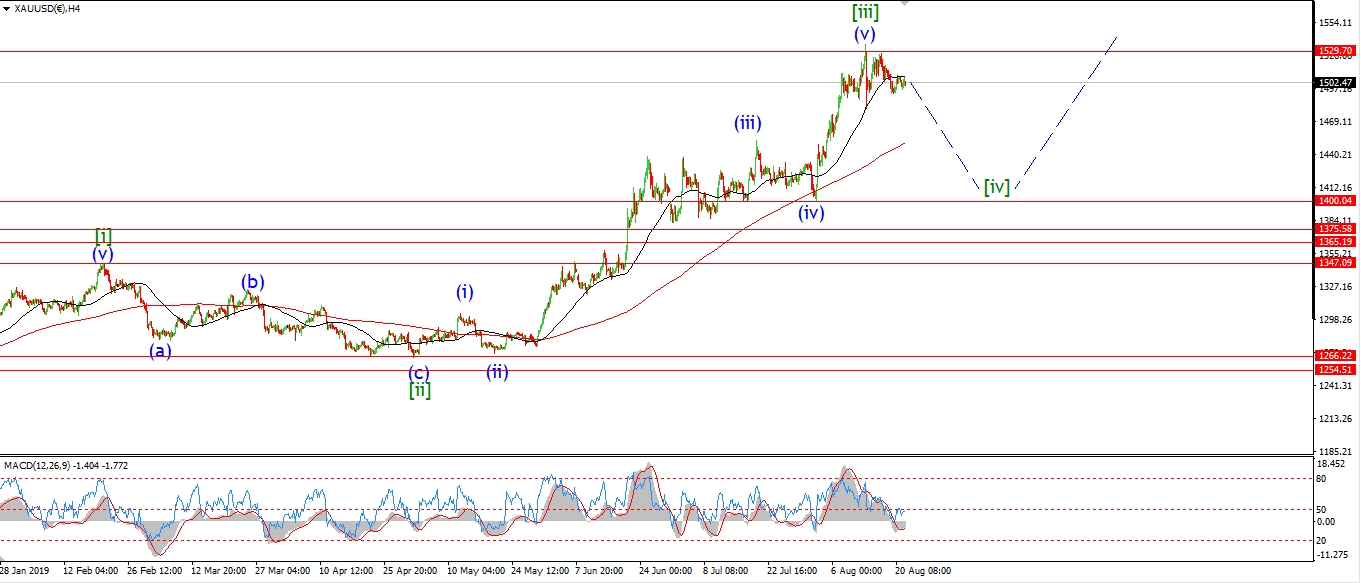 [/vc_column_text][vc_custom_heading text=”Daily” use_theme_fonts=”yes”][vc_column_text]
 [/vc_column_text][/vc_column][/vc_row]
[vc_row][vc_column][vc_column_text]
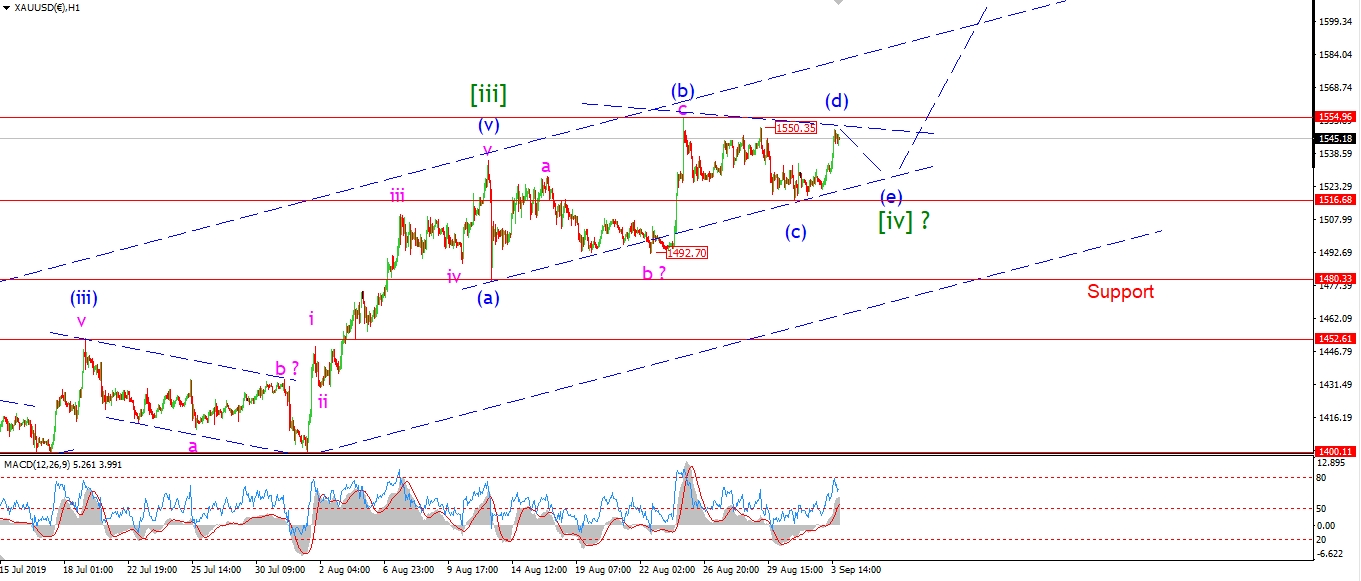
Since wave [iii] topped out at 1534,
Gold has just gone sideways for the last three weeks.
This opens up the possibility that wave [iv] is actually tracing out a barrier triangle.
This is a bullish scenario where the triangle has an upside bias
and is usually followed by a fifth wave.
In this case wave [v] will easily carry us above 1600,
possibly as high as 1650,
if the larger trend channel on the 4hr chart is filled as wave [v] closes out.
Tomorrow;
If this triangle wave count is correct,
then wave [iv] is quite far along in its development.
Wave (d) of [iv] should top out below 1554,
and head lower tomorrow in wave (e) of [iv].
Wave (e) must complete above 1515.
So there is a tight margin for error on this one.
Watch for 1554 to hold and the decline in wave (e) to begin tomorrow.
[/vc_column_text][/vc_column][/vc_row]
[vc_row][vc_column][vc_separator border_width=”5″][/vc_column][/vc_row][vc_row][vc_column][vc_column_text]
U.S CRUDE OIL
[/vc_column_text][/vc_column][/vc_row][vc_row][vc_column][vc_separator border_width=”5″][/vc_column][/vc_row][vc_row][vc_column width=”2/3″][vc_custom_heading text=”1 hr” use_theme_fonts=”yes”][vc_column_text]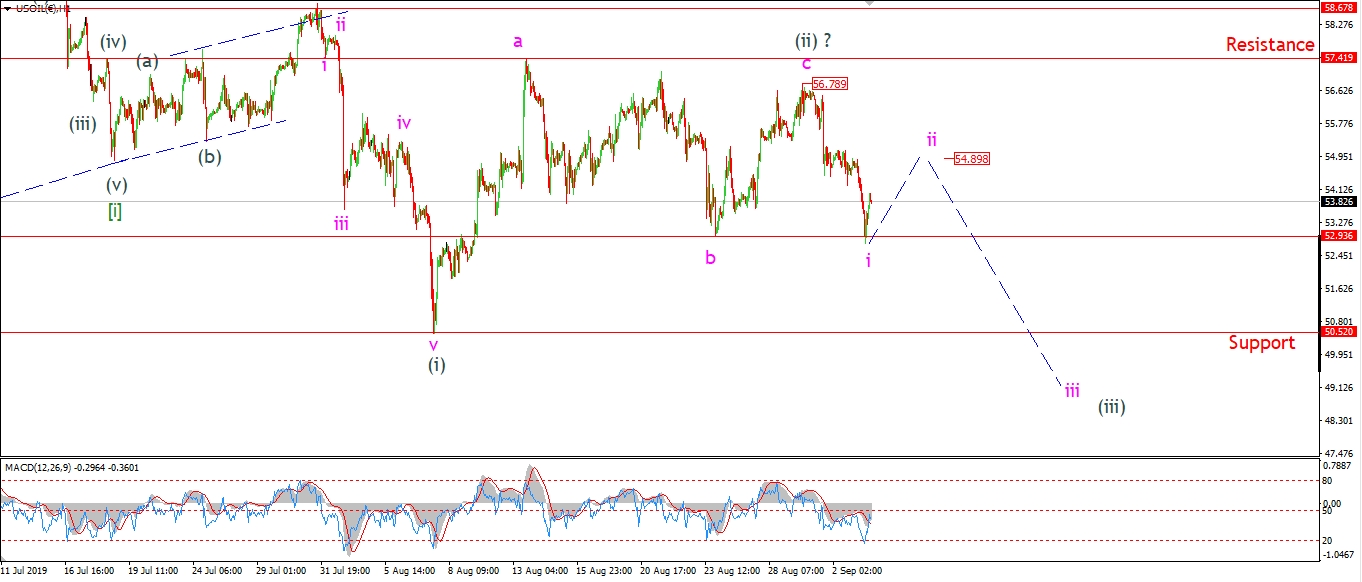 [/vc_column_text][/vc_column][vc_column width=”1/3″][vc_custom_heading text=”4 Hours” use_theme_fonts=”yes”][vc_column_text]
 [/vc_column_text][vc_custom_heading text=”Daily” use_theme_fonts=”yes”][vc_column_text]
 [/vc_column_text][/vc_column][/vc_row]
[vc_row][vc_column][vc_column_text]
Crude has completed a five wave decline in wave ‘i’ of (iii) at todays lows.
The price found support at the recent wave ‘b’ low,
and again has bounced higher this evening.
This rally must be short lived in wave ‘ii’,
and wave ‘iii’ simply must begin a long decline this week
in order to completely rule out the alternate count on the 4hr chart.
A break of 50.50 again will confirm the current bearish count
and should lead to a protracted decline again in wave ‘3’.
Tomorrow;
Watch for wave ‘ii’ to create a three wave rally and complete at about 54.90.
A break of 56.79 will trigger the alternate count.
[/vc_column_text][/vc_column][/vc_row]
[vc_row][vc_column][vc_separator border_width=”5″][/vc_column][/vc_row][vc_row][vc_column][vc_column_text]
US 10 yr Treasuries.
[/vc_column_text][/vc_column][/vc_row][vc_row][vc_column][vc_separator border_width=”5″][/vc_column][/vc_row][vc_row][vc_column width=”2/3″][vc_custom_heading text=”1 hr” use_theme_fonts=”yes”][vc_column_text]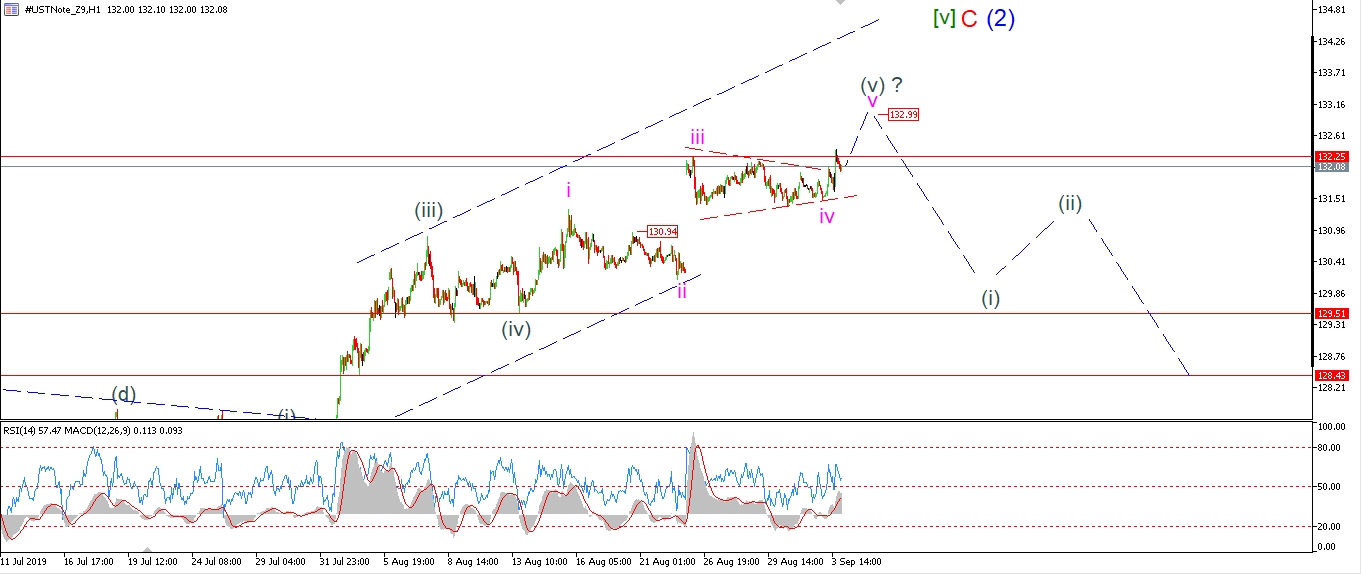 [/vc_column_text][/vc_column][vc_column width=”1/3″][vc_custom_heading text=”4 Hours” use_theme_fonts=”yes”][vc_column_text]
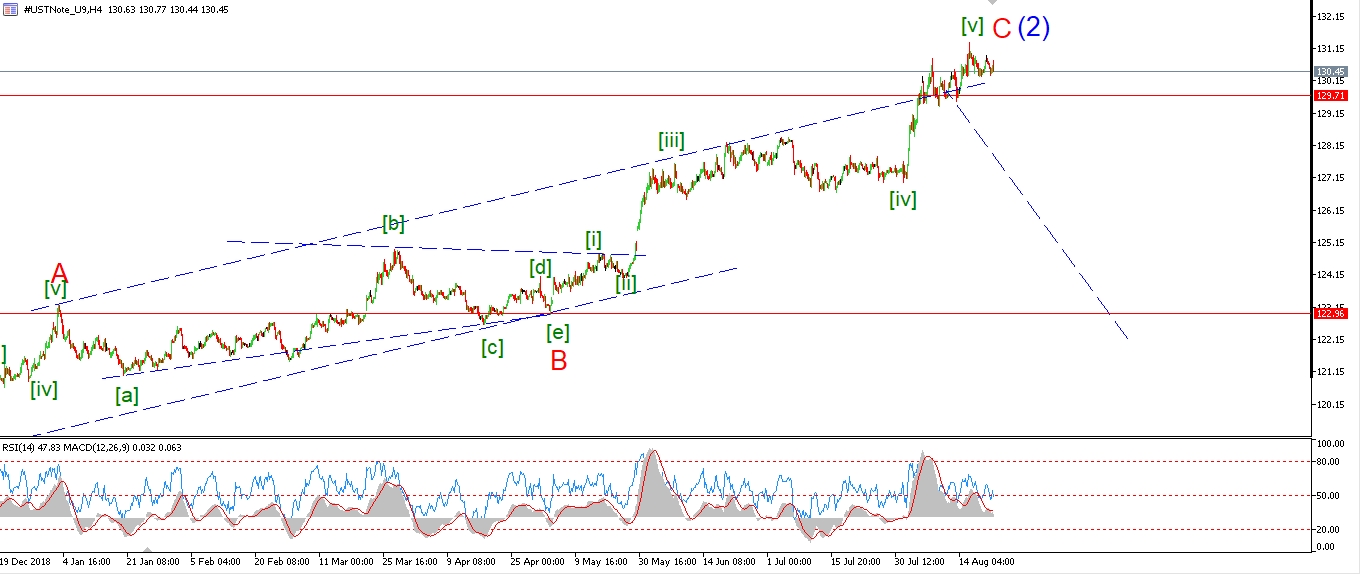 [/vc_column_text][vc_custom_heading text=”Daily” use_theme_fonts=”yes”][vc_column_text]
 [/vc_column_text][/vc_column][/vc_row]
[vc_row][vc_column][vc_column_text]
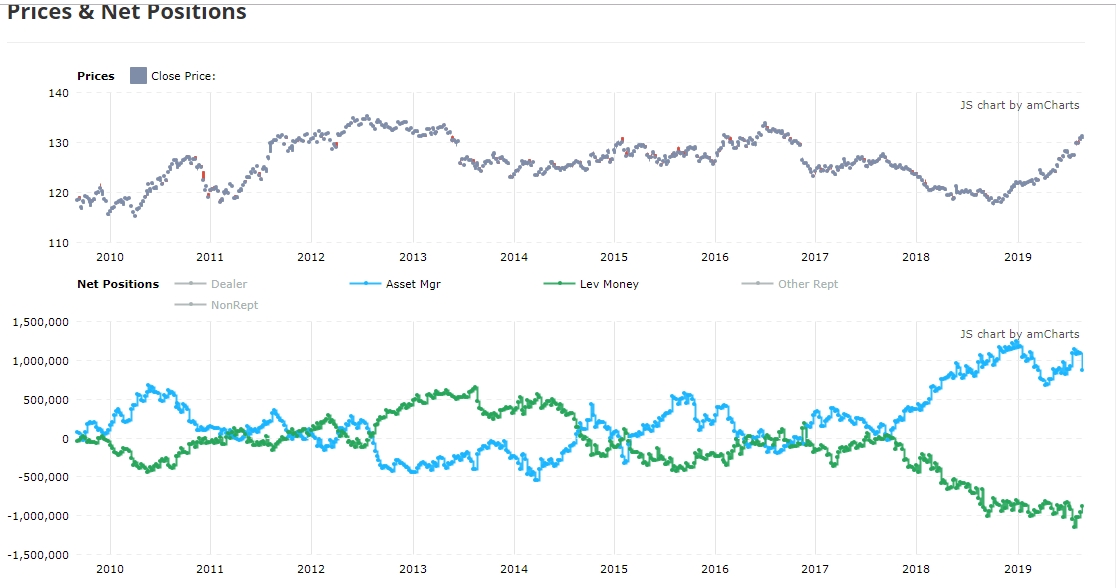
When you look at the COT data for the 10YR,
It is plain to see how horribly overbought and precarious the market is right now.
Money managers now hold the biggest long position in 10 years!
On the flip side,
the smart money, is now equally heavily short the market.
This lopsided setup can only be resolved one way in my opinion.
this market is about to undergo a severe selloff over the coming months
which will serve to re-balance the market at a lower price.
Wave (2) has gone on long enough
and is now approaching major resistance at 134.00.
I expect wave C of (2) to complete below that level
and the initial move lower off the high will be a sharp decline in five waves.
That initial decline remains my focus in the short term.
Tomorrow;
the short term count may allow for another small new high but not by much.
Watch for wave (i) to begin this week.
[/vc_column_text][/vc_column][/vc_row]
[vc_row][vc_column][vc_separator border_width=”5″][/vc_column][/vc_row][vc_row][vc_column][vc_column_text]
SILVER
[/vc_column_text][/vc_column][/vc_row][vc_row][vc_column][vc_separator border_width=”5″][/vc_column][/vc_row][vc_row][vc_column width=”2/3″][vc_custom_heading text=”1 hr” use_theme_fonts=”yes”][vc_column_text]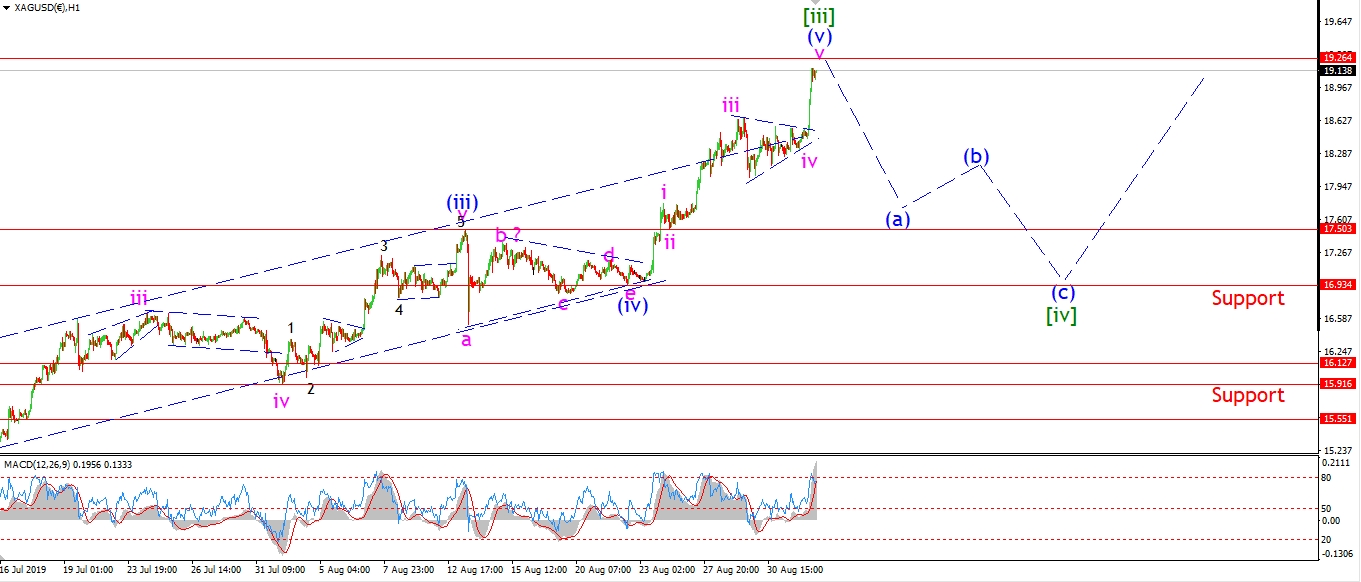 [/vc_column_text][/vc_column][vc_column width=”1/3″][vc_custom_heading text=”4 Hours” use_theme_fonts=”yes”][vc_column_text]
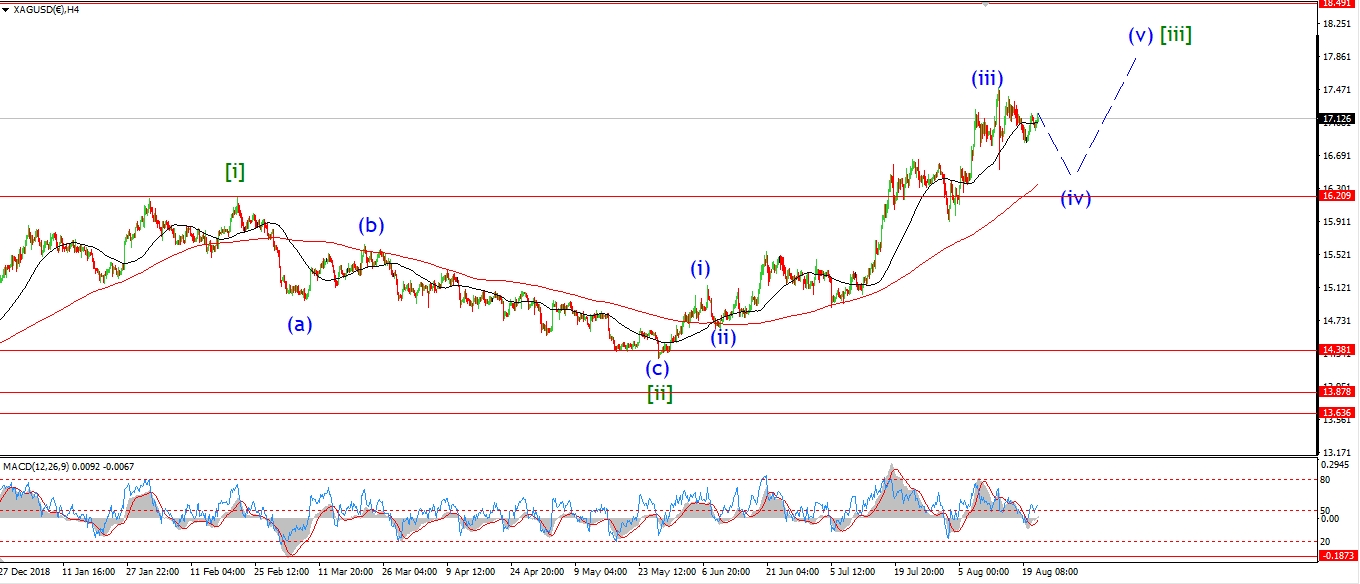 [/vc_column_text][vc_custom_heading text=”Daily” use_theme_fonts=”yes”][vc_column_text]
 [/vc_column_text][/vc_column][/vc_row]
[vc_row][vc_column][vc_column_text]
Wave [iii] is really turning out to be a euphoric ride these days.
Silver broke out of the recent small decline,
and shot higher to break the 19.00 handle for the first time in three years in wave (v) of [iii].
Wave [iii] has been a powerful ride off the May lows,
and now the market is totally bought in to a continued ride higher.
The correction in wave [iv] has not yet begun,
but it is coming our way soon, that if for sure!
Wave [iv] does not have to be a deep correction,
but it needs to be long enough to cool off the recent rally in wave [iii].
Tomorrow;
The focus this week is to watch for wave [iv] to begin.
Wave (a) of [iv[ should be well underway by the end of the week.
[/vc_column_text][/vc_column][/vc_row]
[vc_row][vc_column][vc_separator border_width=”5″][/vc_column][/vc_row][vc_row][vc_column][vc_column_text]
S&P 500.
[/vc_column_text][/vc_column][/vc_row][vc_row][vc_column][vc_separator border_width=”5″][/vc_column][/vc_row][vc_row][vc_column width=”2/3″][vc_custom_heading text=”1 hr” use_theme_fonts=”yes”][vc_column_text]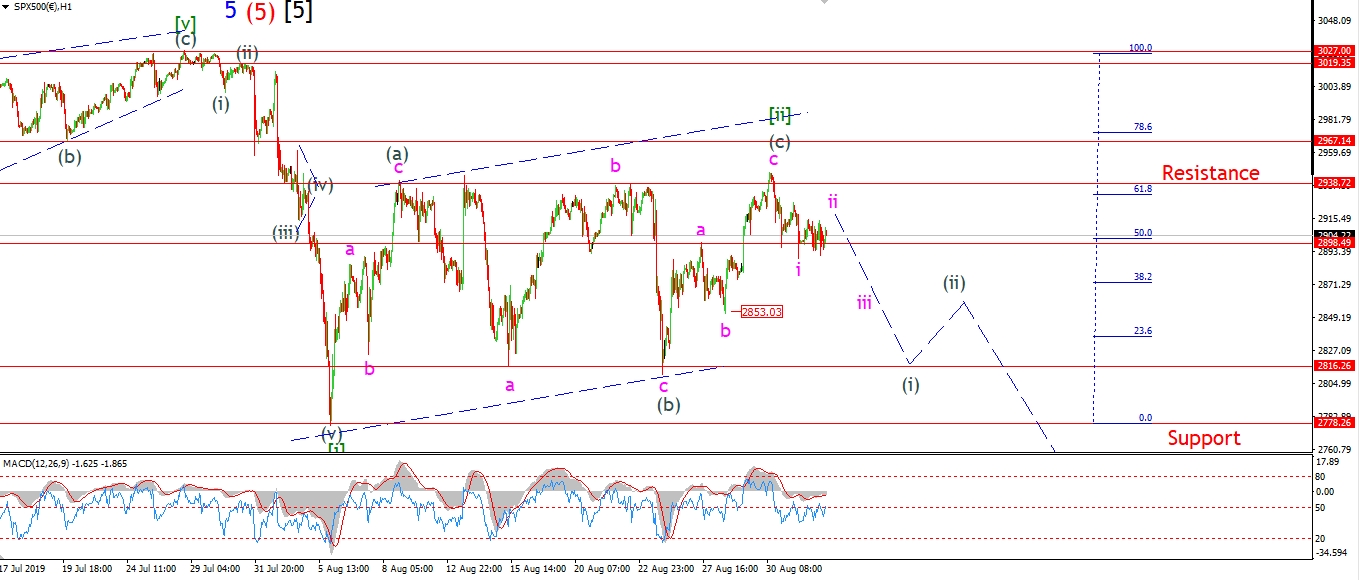 [/vc_column_text][/vc_column][vc_column width=”1/3″][vc_custom_heading text=”4 Hours” use_theme_fonts=”yes”][vc_column_text]
 [/vc_column_text][vc_custom_heading text=”Daily” use_theme_fonts=”yes”][vc_column_text]
 [/vc_column_text][/vc_column][/vc_row]
[vc_row][vc_column][vc_column_text]
After a gap lower this morning,
the S&P traded more or less sideways for the rest of todays session.
This action suggests that wave ‘ii’ of (i) is still underway
and wave ‘iii’ down is still ahead of us later this week.
I would like to see wave ‘ii’ complete at about 2915,
and then wave ‘iii’ should be set to carry the price back below 2853.
A break of that level will confirm the turn into the larger wave (i).
Wave (i) itself should break 2816 after a five wave decline.
Tomorrow;
watch for wave ‘ii’ to hold below 2920.
we may even see the initial turn lower into wave ‘iii’ of (i).
[/vc_column_text][/vc_column][/vc_row]
[vc_row][vc_column][vc_separator border_width=”5″][/vc_column][/vc_row]