
[vc_row][vc_column][vc_separator border_width=”5″][/vc_column][/vc_row]
[vc_row][vc_column][vc_column_text]
Today was an interesting day for sure,
only once in a blue moon does it happen
that every market sells off together on a single trading day!
I cant say that it signifies anything in particular.
But I will make a mental note of this day for sure.
[/vc_column_text][/vc_column][/vc_row]
[vc_row][vc_column][vc_separator border_width=”5″][/vc_column][/vc_row]
[vc_row][vc_column][vc_column_text]
EURUSD
[/vc_column_text][/vc_column][/vc_row]
[vc_row][vc_column][vc_separator border_width=”5″][/vc_column][/vc_row][vc_row][vc_column width=”2/3″][vc_custom_heading text=”1 hr” use_theme_fonts=”yes”][vc_column_text]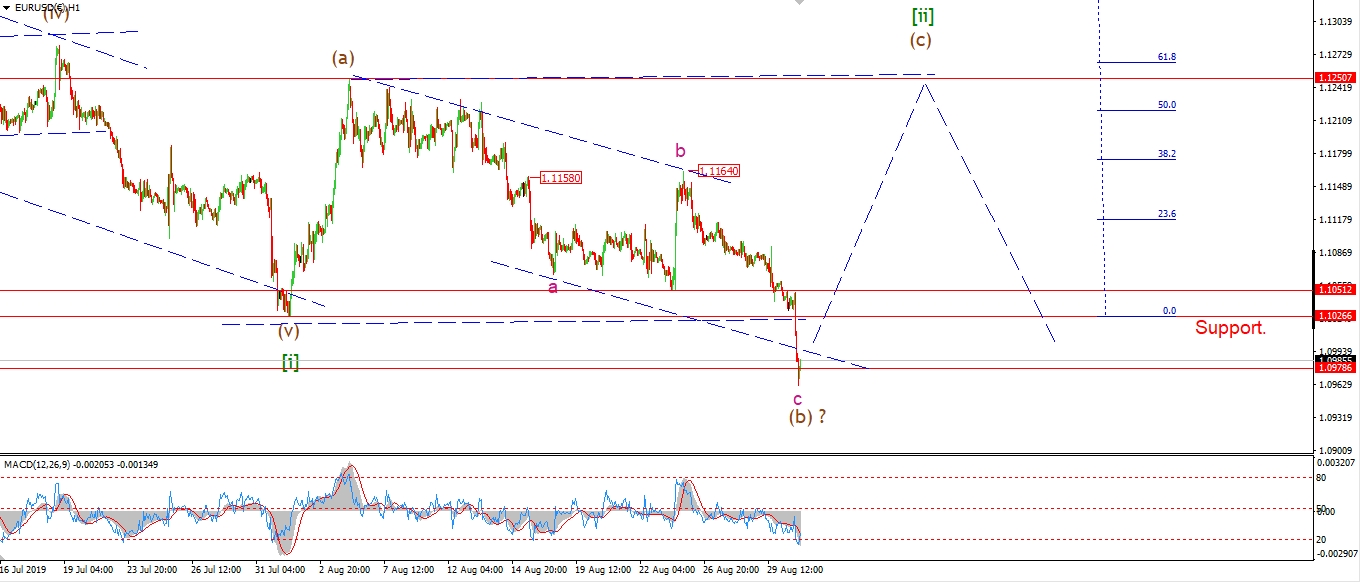 [/vc_column_text][/vc_column][vc_column width=”1/3″][vc_custom_heading text=”4 Hours” use_theme_fonts=”yes”][vc_column_text]
 [/vc_column_text][vc_custom_heading text=”Daily” use_theme_fonts=”yes”][vc_column_text]
 [/vc_column_text][/vc_column][/vc_row]
[vc_row][vc_column][vc_column_text]
EURUSD declined again in a capitulation move to finish wave (b).
The pattern in wave [ii] is now an expanded flat correction.
Where wave (B) has broken below the low of wave [i] in a three wave form.
Now wave (c) should rally from these lows and carry back above 1.1250 again next week.
Wave (b) has completed a three wave decline to a new low.
And of course,
now the world and its mother now wants to sell their EUROS!
even though we are sitting at an extreme oversold level.
Next week;
Watch for wave (c) to begin early Tuesday with a spike to a higher low.
Wave (c) should rally for most of the week.
[/vc_column_text][/vc_column][/vc_row]
[vc_row][vc_column][vc_separator border_width=”5″][/vc_column][/vc_row][vc_row][vc_column][vc_column_text]
GBPUSD
[/vc_column_text][/vc_column][/vc_row][vc_row][vc_column][vc_separator border_width=”5″][/vc_column][/vc_row][vc_row][vc_column width=”2/3″][vc_custom_heading text=”1 hr” use_theme_fonts=”yes”][vc_column_text]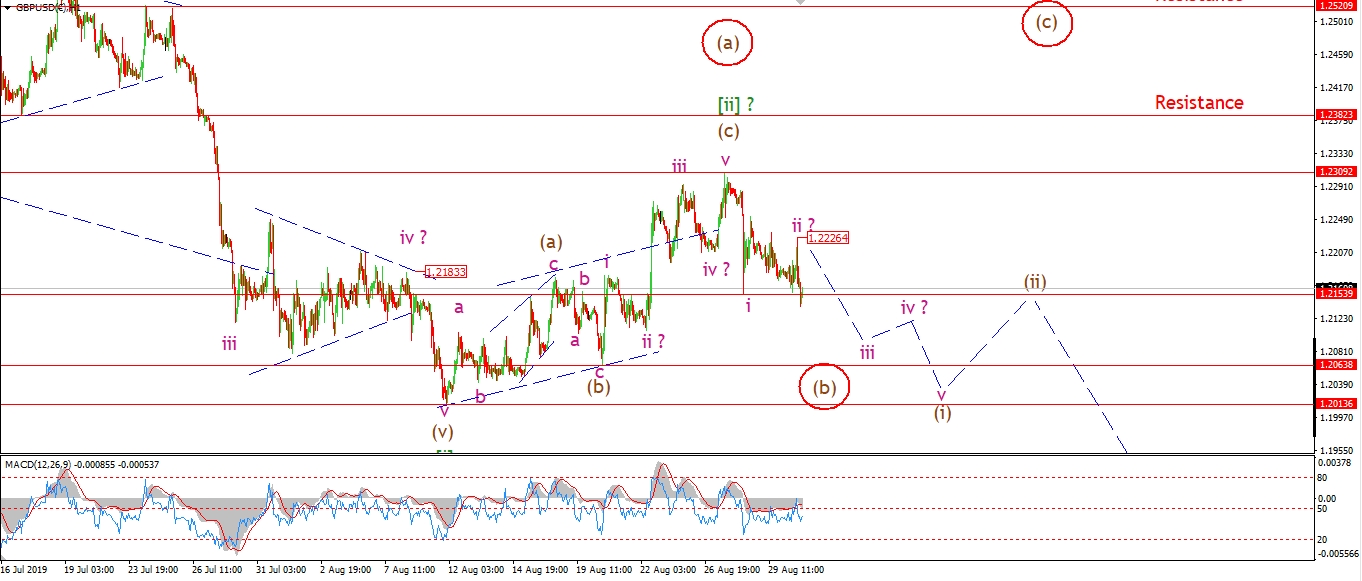 [/vc_column_text][/vc_column][vc_column width=”1/3″][vc_custom_heading text=”4 Hours” use_theme_fonts=”yes”][vc_column_text]
 [/vc_column_text][vc_custom_heading text=”Daily” use_theme_fonts=”yes”][vc_column_text]
 [/vc_column_text][/vc_column][/vc_row]
[vc_row][vc_column][vc_column_text]
Cable never reached a new high above 1.2253 today.
But it is still possible that wave ‘ii’ pink is complete
as a running flat at todays high of 1.2226.
The price sold off sharply in a possible wave ‘iii’ of (i) this afternoon.
And we are now below the wave ‘i’ low of 1.2153.
Wave ‘iii’ should continue lower in the early trade next week
and it should find support at 1.2063.
Next week;
The aim from here is simple.
watch for a clear five wave move lower in wave (i) to signal wave [iii] has begun.
1.2226 should hold as wave ‘iii’ continues lower.
[/vc_column_text][/vc_column][/vc_row]
[vc_row][vc_column][vc_separator border_width=”5″][/vc_column][/vc_row][vc_row][vc_column][vc_column_text]
USDJPY
[/vc_column_text][/vc_column][/vc_row][vc_row][vc_column][vc_separator border_width=”5″][/vc_column][/vc_row][vc_row][vc_column width=”2/3″][vc_custom_heading text=”1 hr” use_theme_fonts=”yes”][vc_column_text]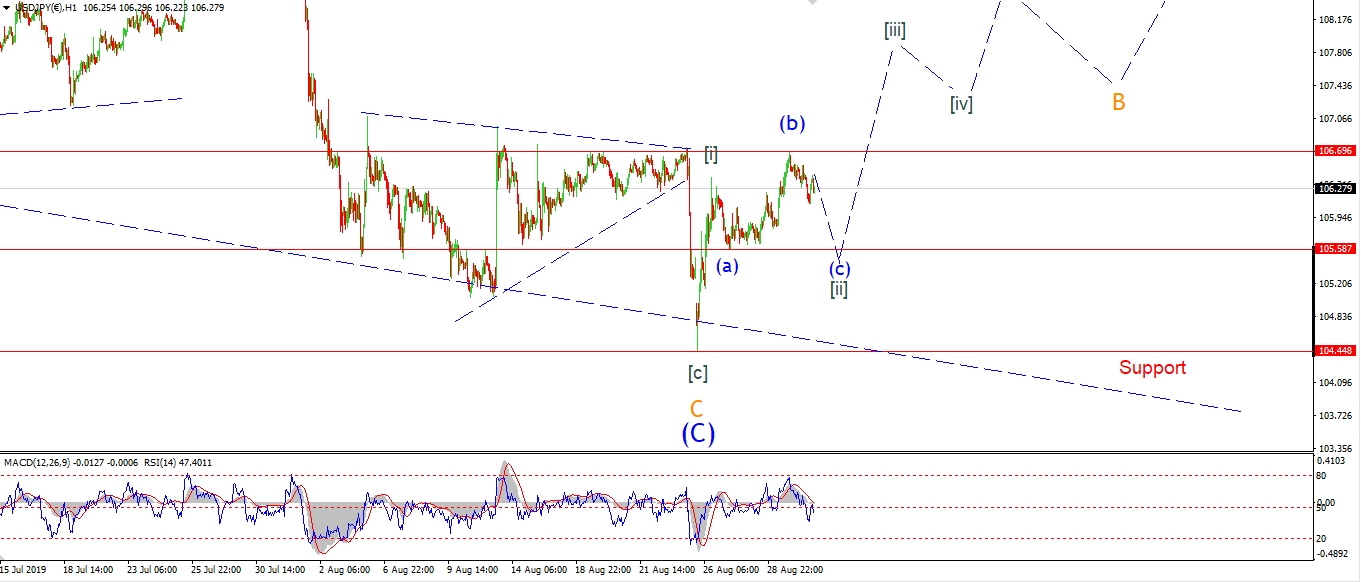 [/vc_column_text][/vc_column][vc_column width=”1/3″][vc_custom_heading text=”4 Hours” use_theme_fonts=”yes”][vc_column_text]
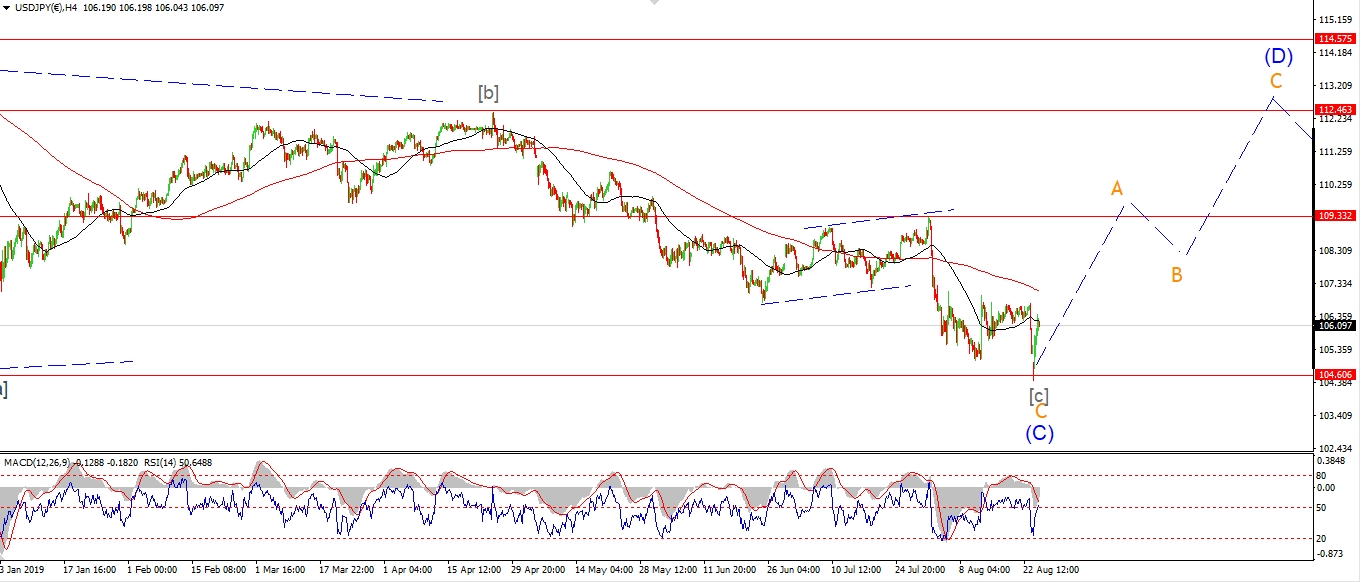 [/vc_column_text][vc_custom_heading text=”Daily” use_theme_fonts=”yes”][vc_column_text]
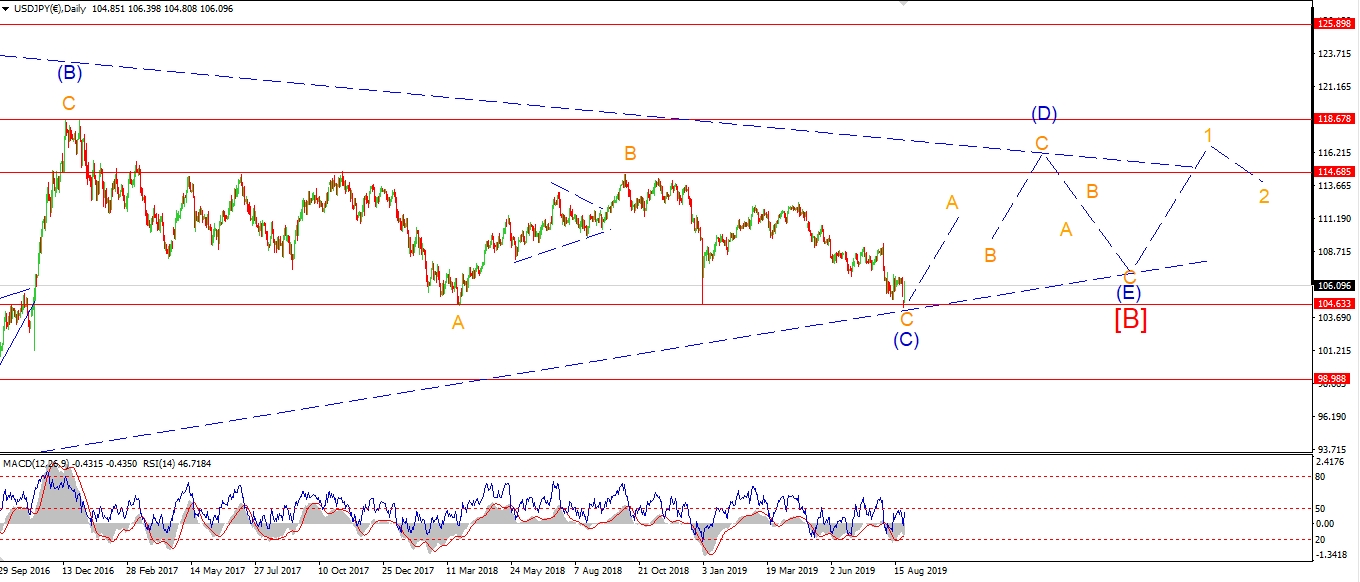 [/vc_column_text][/vc_column][/vc_row]
[vc_row][vc_column][vc_column_text]
USDJPY is falling off that wave (b) high today.
The price should continue lower in wave (c) next week.
The short term target remains at 105.58.
And once we reach that level,
wave [ii] will be complete as an expanded flat correction.
A rally off the wave [ii] low that breaks above 106.70 again will confirm that wave ‘A’ is underway.
Next week;
Watch for wave (c) to hit the target and complete the correction in wave [ii].
[/vc_column_text][/vc_column][/vc_row]
[vc_row][vc_column][vc_separator border_width=”5″][/vc_column][/vc_row][vc_row][vc_column][vc_column_text]
DOW JONES INDUSTRIALS
[/vc_column_text][/vc_column][/vc_row][vc_row][vc_column][vc_separator border_width=”5″][/vc_column][/vc_row][vc_row][vc_column width=”2/3″][vc_custom_heading text=”1 hr” use_theme_fonts=”yes”][vc_column_text]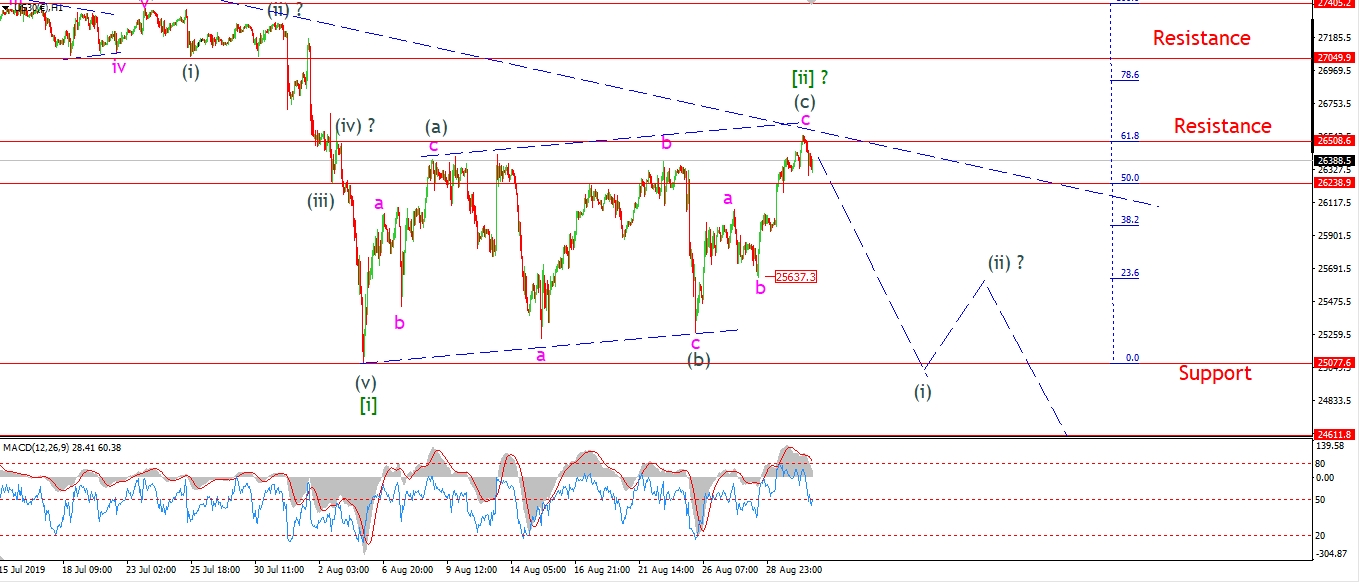 [/vc_column_text][/vc_column][vc_column width=”1/3″][vc_custom_heading text=”4 Hours” use_theme_fonts=”yes”][vc_column_text]
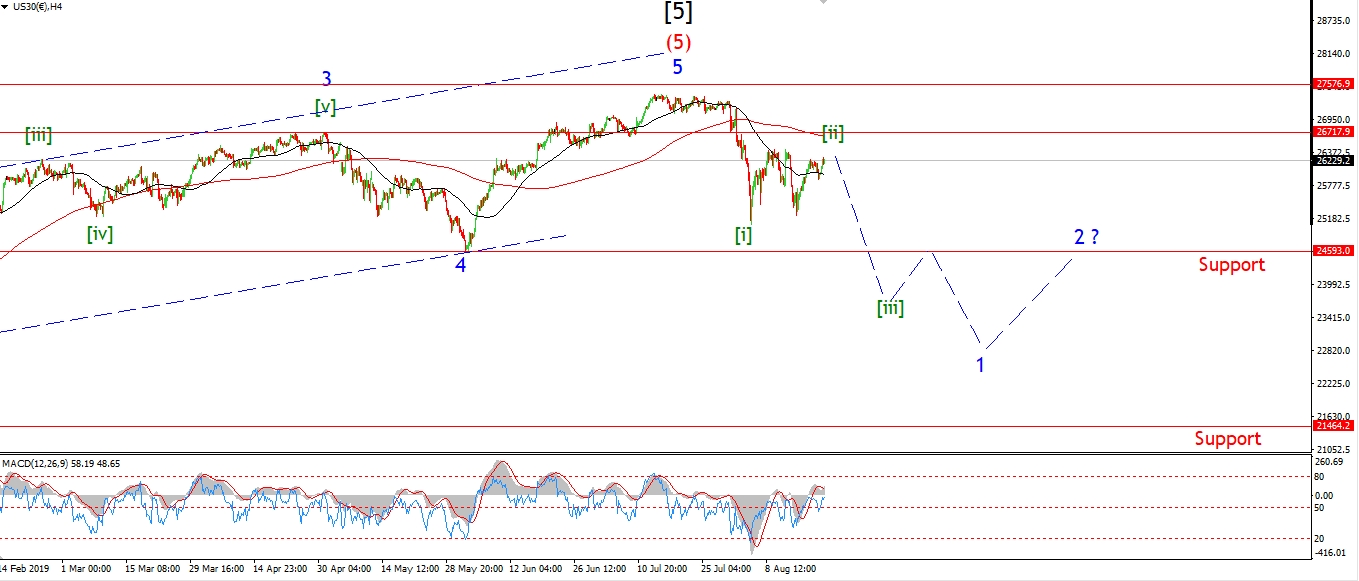 [/vc_column_text][vc_custom_heading text=”Daily” use_theme_fonts=”yes”][vc_column_text]
 [/vc_column_text][/vc_column][/vc_row]
[vc_row][vc_column][vc_column_text]
Stocks rallied in the pre-market and popped above 26500 in wave ‘c’ of (c) of [ii].
This early rally should be enough to complete wave (c) and wave [ii].
The market sold off again at the open,
this does reinforce the idea that wave [ii] is done.
So;
Now the market sits at a triple top lower high.
The action over the last few weeks is very corrective overall.
With multiple breakout attempts all failing.
And a nice three wave move within a trend channel.
Next week;
There is every chance that wave [ii] is ready to turn over and fall into wave [iii] now.
A sharp sell off next week will signal that wave (i) of [iii] has begun.
Watch for wave (i) to break 25600 again to rule out a five wave rally in wave (c).
[/vc_column_text][/vc_column][/vc_row]
[vc_row][vc_column][vc_separator border_width=”5″][/vc_column][/vc_row][vc_row][vc_column][vc_column_text]
GOLD
[/vc_column_text][/vc_column][/vc_row][vc_row][vc_column][vc_separator border_width=”5″][/vc_column][/vc_row][vc_row][vc_column width=”2/3″][vc_custom_heading text=”1 hr” use_theme_fonts=”yes”][vc_column_text]
 [/vc_column_text][/vc_column][vc_column width=”1/3″][vc_custom_heading text=”4 Hours” use_theme_fonts=”yes”][vc_column_text]
 [/vc_column_text][vc_custom_heading text=”Daily” use_theme_fonts=”yes”][vc_column_text]
 [/vc_column_text][/vc_column][/vc_row]
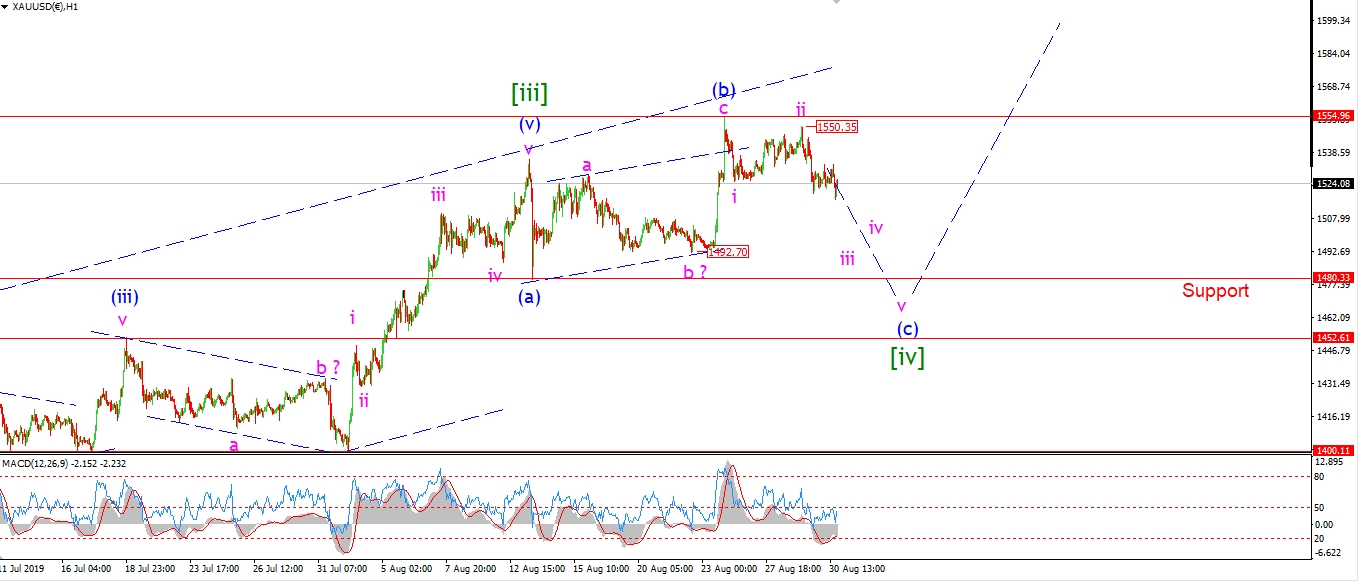
[vc_row][vc_column][vc_column_text]
Gold is heading lower again off the wave ‘ii’ high,
so far the decline is in three waves off the wave (b) high.
so I want to see this decline continue next week in wave (c) and break 1480 at a minimum.
This will complete an expanded flat correction and set us up for a rally again in wave [v].
Next week.
The wave ‘ii’ high at 1550 should hold.
Watch for wave ‘iii’ down to break 1492 before correcting again in wave ‘iv’.
[/vc_column_text][/vc_column][/vc_row]
[vc_row][vc_column][vc_separator border_width=”5″][/vc_column][/vc_row][vc_row][vc_column][vc_column_text]
U.S CRUDE OIL
[/vc_column_text][/vc_column][/vc_row][vc_row][vc_column][vc_separator border_width=”5″][/vc_column][/vc_row][vc_row][vc_column width=”2/3″][vc_custom_heading text=”1 hr” use_theme_fonts=”yes”][vc_column_text] [/vc_column_text][/vc_column][vc_column width=”1/3″][vc_custom_heading text=”4 Hours” use_theme_fonts=”yes”][vc_column_text]
 [/vc_column_text][vc_custom_heading text=”Daily” use_theme_fonts=”yes”][vc_column_text]
 [/vc_column_text][/vc_column][/vc_row]
[vc_row][vc_column][vc_column_text]
Crude is again selling off this evening with a sharp spike lower.
The price did not break 57.42 in wave ‘c’ of (ii),
so Thursdays high may be wave ‘c’ of (ii) now completed as a running flat.
If the price continues lower on Tuesday, and breaks 52.93,
that will signal wave ‘i’ of (iii) has begun.
If the sell off continues lower to break 50.50 again.
that will rule out the alternate count in my view.
Next week;
Watch for wave (iii) down to take over again.
Wave ‘i’ of (iii) should break 52.93.
[/vc_column_text][/vc_column][/vc_row]
[vc_row][vc_column][vc_separator border_width=”5″][/vc_column][/vc_row][vc_row][vc_column][vc_column_text]
US 10 yr Treasuries.
[/vc_column_text][/vc_column][/vc_row][vc_row][vc_column][vc_separator border_width=”5″][/vc_column][/vc_row][vc_row][vc_column width=”2/3″][vc_custom_heading text=”1 hr” use_theme_fonts=”yes”][vc_column_text]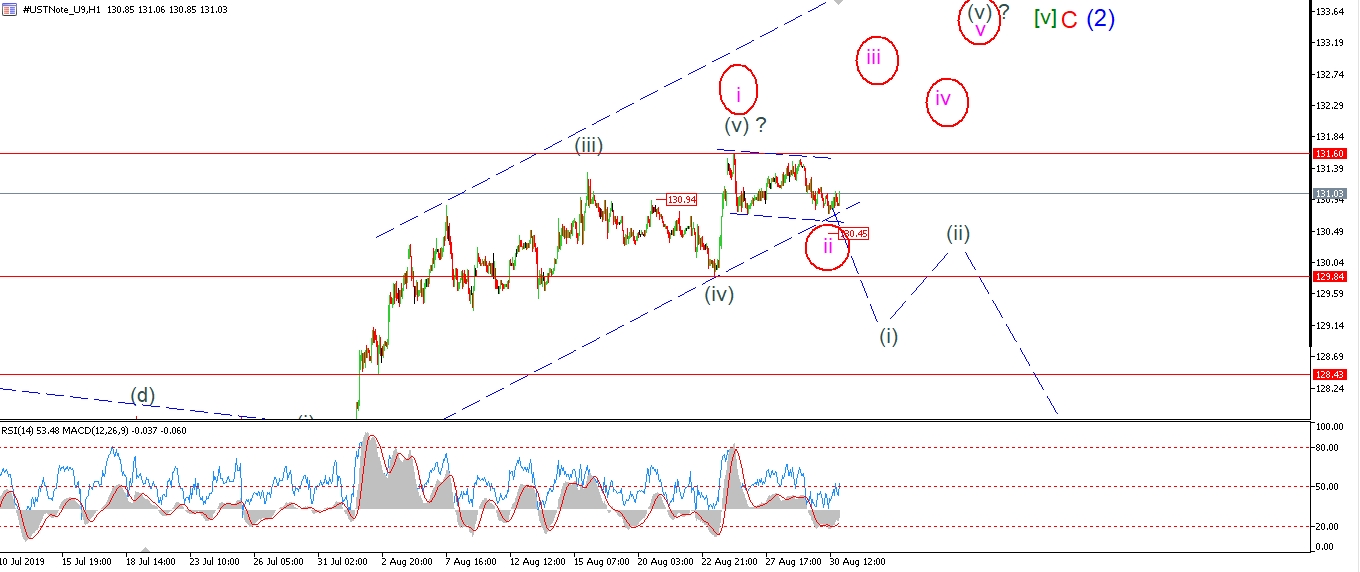 [/vc_column_text][/vc_column][vc_column width=”1/3″][vc_custom_heading text=”4 Hours” use_theme_fonts=”yes”][vc_column_text]
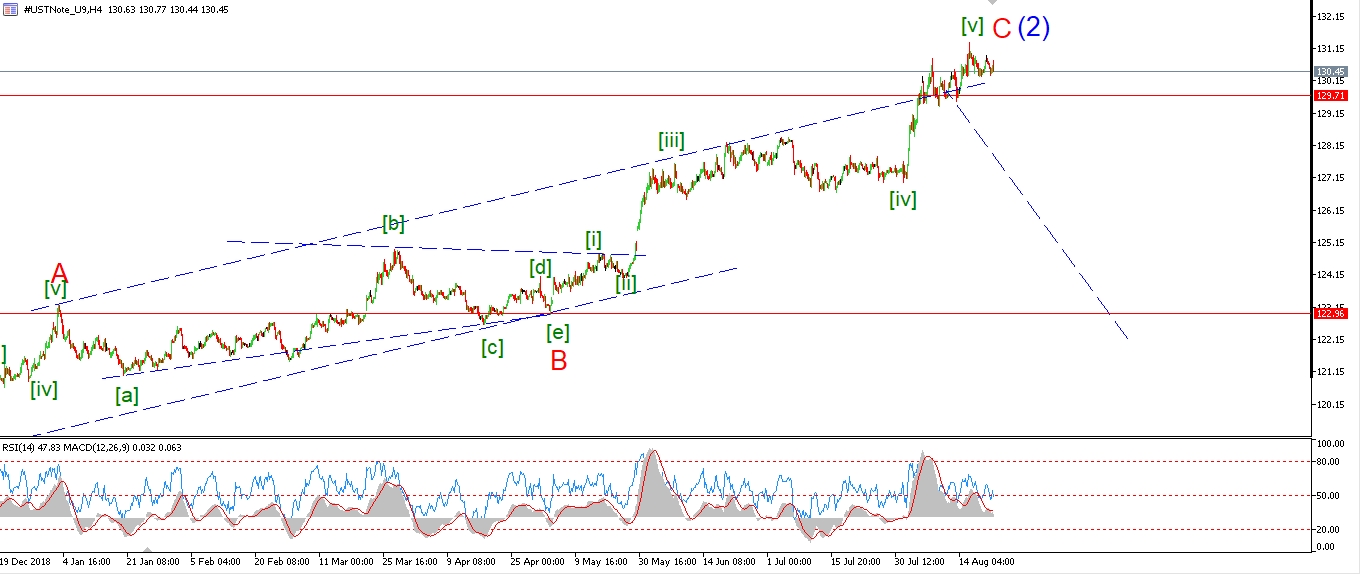 [/vc_column_text][vc_custom_heading text=”Daily” use_theme_fonts=”yes”][vc_column_text]
 [/vc_column_text][/vc_column][/vc_row]
[vc_row][vc_column][vc_column_text]
Bonds traded flat today which does not favor the bearish count in wave (i) down.
It does not rule out that count either,
but I think it is wise to consider the alternate count now just to prepare.
If the three wave move off the high has completed wave ‘ii’,
then we can expect to see a rally again next week in wave ‘iii’ of (v).
And a five wave move overall to complete wave (v) throughout most of next week.
Tuesday;
It all hinges on the early action next week.
A break of 129.84 will confirm the current bearish count.
While a break of 131.60 will will trigger the alternate count.
Lets see how the chips fall on this one.
[/vc_column_text][/vc_column][/vc_row]
[vc_row][vc_column][vc_separator border_width=”5″][/vc_column][/vc_row][vc_row][vc_column][vc_column_text]
SILVER
[/vc_column_text][/vc_column][/vc_row][vc_row][vc_column][vc_separator border_width=”5″][/vc_column][/vc_row][vc_row][vc_column width=”2/3″][vc_custom_heading text=”1 hr” use_theme_fonts=”yes”][vc_column_text]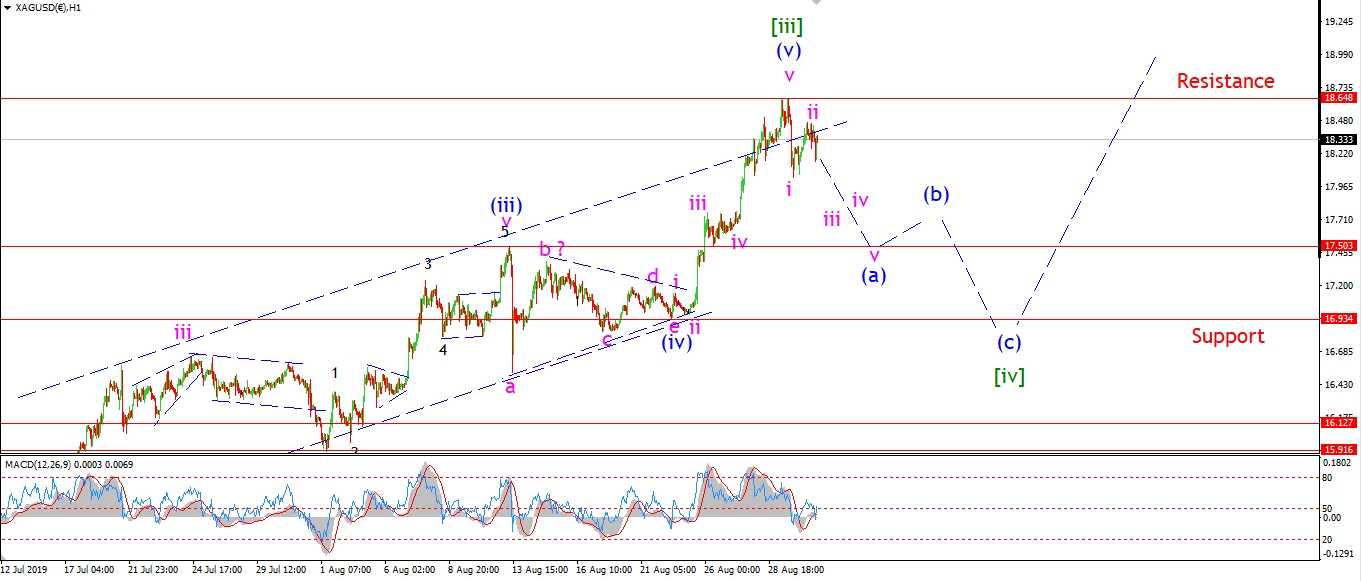 [/vc_column_text][/vc_column][vc_column width=”1/3″][vc_custom_heading text=”4 Hours” use_theme_fonts=”yes”][vc_column_text]
 [/vc_column_text][vc_custom_heading text=”Daily” use_theme_fonts=”yes”][vc_column_text]
 [/vc_column_text][/vc_column][/vc_row]
[vc_row][vc_column][vc_column_text]
Silver is heading lower again today off a lower high in wave ‘ii’ pink.
This decline has not accelerated into wave ‘iii’ yet,
but I think we are in store for a larger decline in silver to begin wave [iv] over the coming week.
I have shown a simple zigzag correction as a possibility for wave [iv] to start with.
But that will likely develop into something more complex.
We will just have to wait and see.
Next week;
Watch for wave (a) to continue lower to hit 17.50 before rebounding in wave (b).
A simple zigzag correction calls for a five wave decline in wave (a),
so lets see how that develops.
[/vc_column_text][/vc_column][/vc_row]
[vc_row][vc_column][vc_separator border_width=”5″][/vc_column][/vc_row][vc_row][vc_column][vc_column_text]
S&P 500.
[/vc_column_text][/vc_column][/vc_row][vc_row][vc_column][vc_separator border_width=”5″][/vc_column][/vc_row][vc_row][vc_column width=”2/3″][vc_custom_heading text=”1 hr” use_theme_fonts=”yes”][vc_column_text]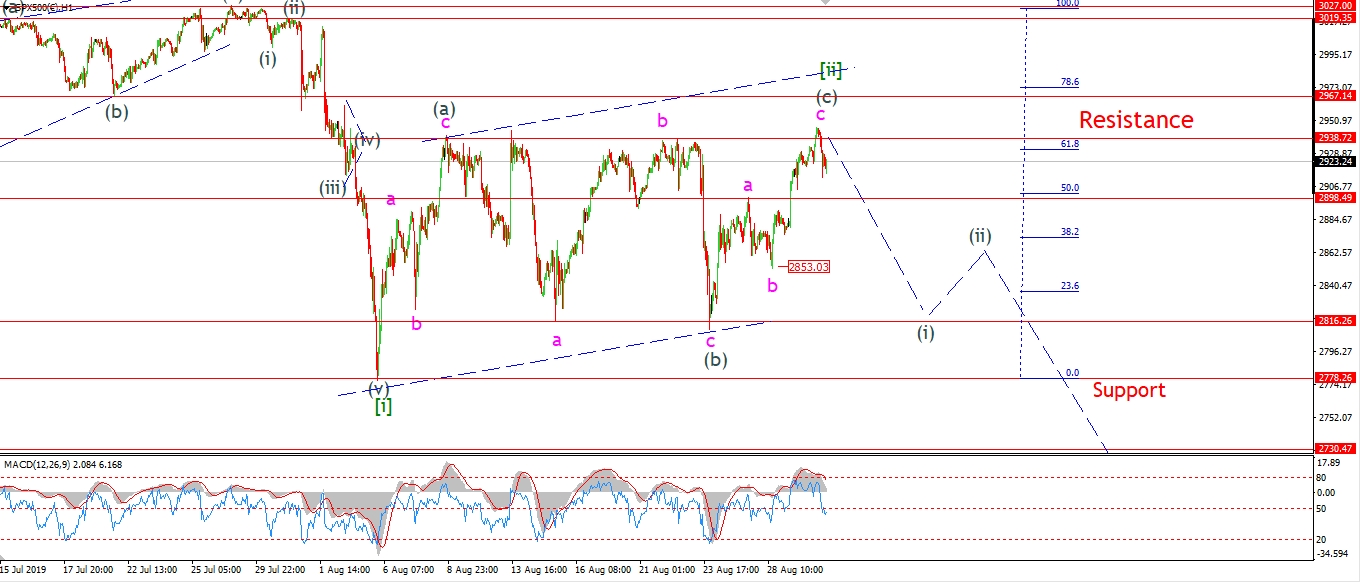 [/vc_column_text][/vc_column][vc_column width=”1/3″][vc_custom_heading text=”4 Hours” use_theme_fonts=”yes”][vc_column_text]
 [/vc_column_text][vc_custom_heading text=”Daily” use_theme_fonts=”yes”][vc_column_text]
 [/vc_column_text][/vc_column][/vc_row]
[vc_row][vc_column][vc_column_text]
The early today trade did reach a new high above 2938.
This fulfilled the minimum target for wave (c) and wave [ii].
So we are again looking at the possibility that wave [ii] is now complete.
And that raises the prospect for a sharp move lower next week in wave [iii] again.
The market sold off for most of the session today,
so this may even be the beginning of wave (i) of [iii] now.
That key low at wave ‘b’ will be level to watch in the early trade next week.
If we see another move lower next week to break 2853,
then we are game on for wave (i) down to continue lower and break 2800 again.
Next week;
If wave [ii] is now done at todays highs.
then next week is again looking promising on the bearish side.
Watch for a break of 2853 to begin wave (i) down.
That does it for another week.
Monday is a U.S holiday and with that the markets are closed.
So I will see you all again on Tuesday!
Have a great weekend.
God bless,
and Gods speed to you all.
Enda.
[/vc_column_text][/vc_column][/vc_row]
[vc_row][vc_column][vc_separator border_width=”5″][/vc_column][/vc_row]