
Have you ever missed a trend change because of fear or doubt??
To combat fear and doubt in trading,
I use Elliott wave signals to catch trend changes while they develop.
Here’s a quick guide to show how this works:
A 1,2 pattern forms a bullish higher low;

Here’s an identical setup in crude oil:
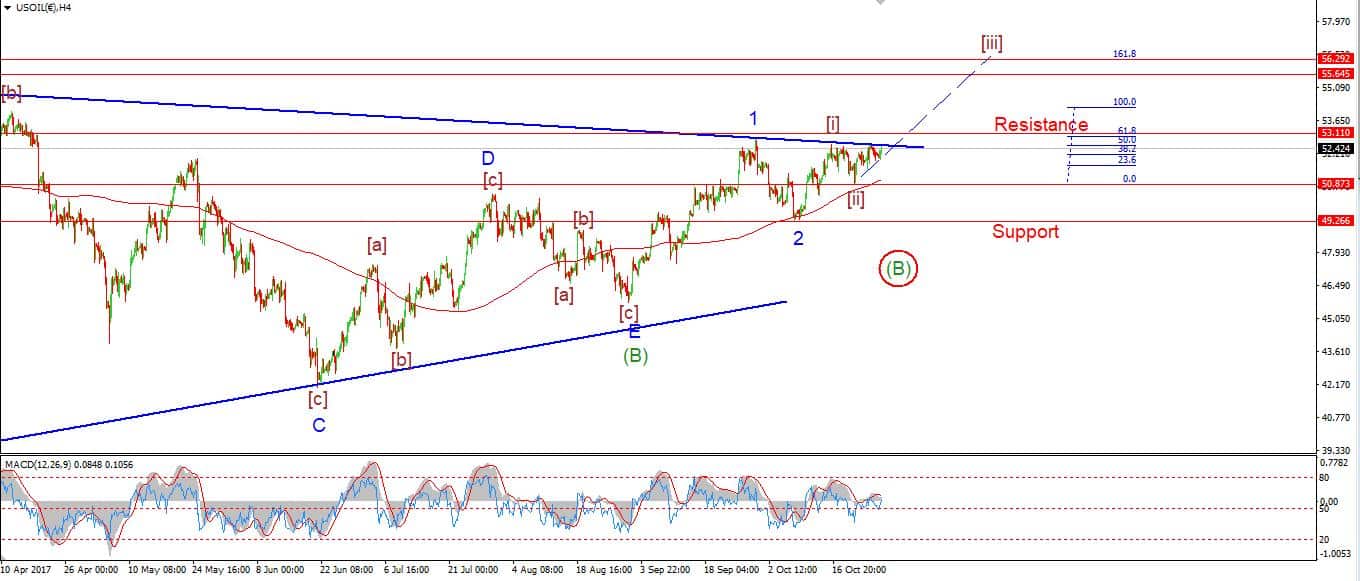
Waves ‘1’ and ‘2’ in place, then what?
Check out the Crude oil example below to see what happened next!
Elliott wave analysis can be applied to any price chart.
So;
In this guide I’m going to show you,
how to trade using Elliott wave analysis in Forex, Stocks and Commodities.
The Elliott wave indicator offers a big picture view of the overall price action in the market by connecting action across the time frames.
This is simply impossible in any other trading system.
Using Elliott wave indicator buy and sell signals in your trading, does not mean you will suddenly gain supernatural powers!
BUT;
By using Elliott wave in your trading, you will lose small and you will win more frequently!
Placing trades and setting stops with Elliott wave indicator signals.
When trading with elliott wave, you start at a large degree lets say a daily chart,
and work to a lower degree possibly a 30 minute chart.
You must form a picture of what the price action is doing in multiple degrees of trend.
So;
What happens on a 30 minute chart directly impacts your view on the hourly price action, the daily price action and the weekly price action.
Every movement in price has consequence for your overall stance on the market all the way up and down the chain.
So every price move leads you closer and closer to a high probability trading signal, and the closer you get to an Elliott wave entry point, the less risk you are taking!
And, the better the predictions of the path of future price moves that you can make.
That is the beauty of an Elliott wave indicator buy or sell signal.
If you follow the rules, you will never have too much risk on the table.
This method leads to better predictions,
better entry points,
better trades, and long term profitability.
I hear this all the time;
“How do I use Elliott wave in forex or Stocks or Commodities?”
Here’s an open secret!
Elliott wave is applied the same way in every single market.
So;
In this post I am going to show you some practical Elliott wave trading strategies.
And, I will go through 5 BIG price predictions I made, why I made those calls,
and the results.
For me, a trading method must achieve 3 things.
- Minimize risk!
- Give a clear outlook, for prices.
- Identify high probability trades.
This is how Elliott wave indicator signals work.
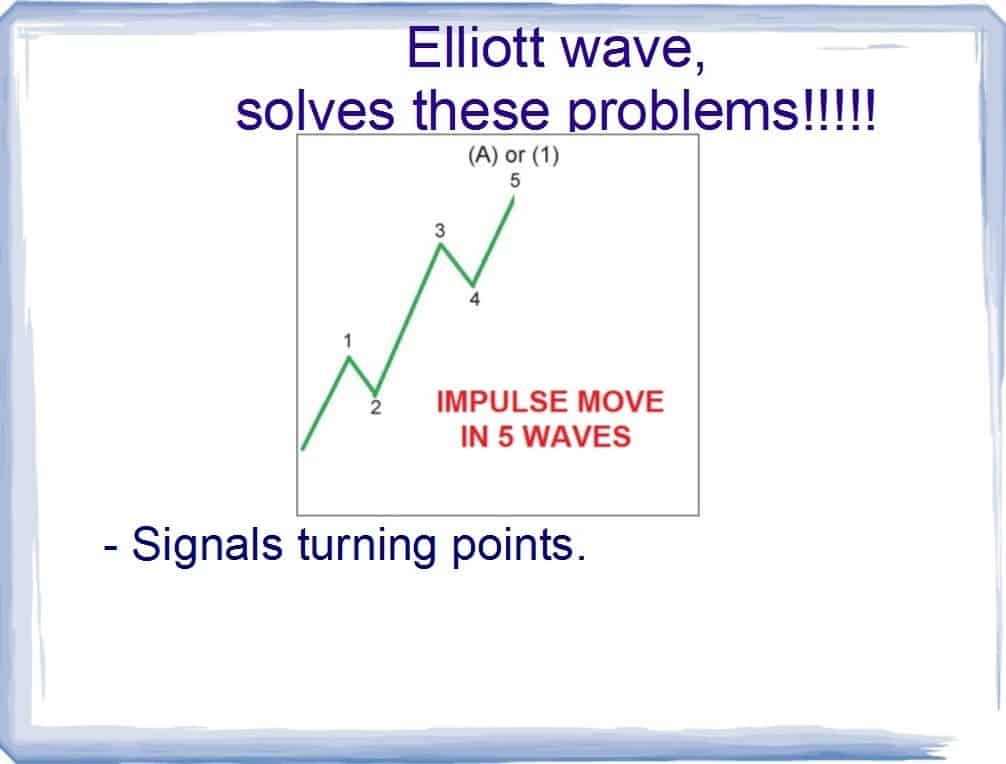
You can use Elliott wave to spot a turn in the market trend, by searching for a five wave pattern facing in the opposite direction on the short term charts.
When this signal is in place, you look for a correction off the recent short term high that traces out three waves.
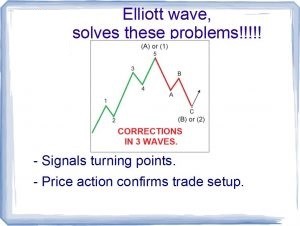
Once the three wave correction is in place, the market is poised to carry on with the trend change.
We now look for a trade entry point with the lowest possible risk.
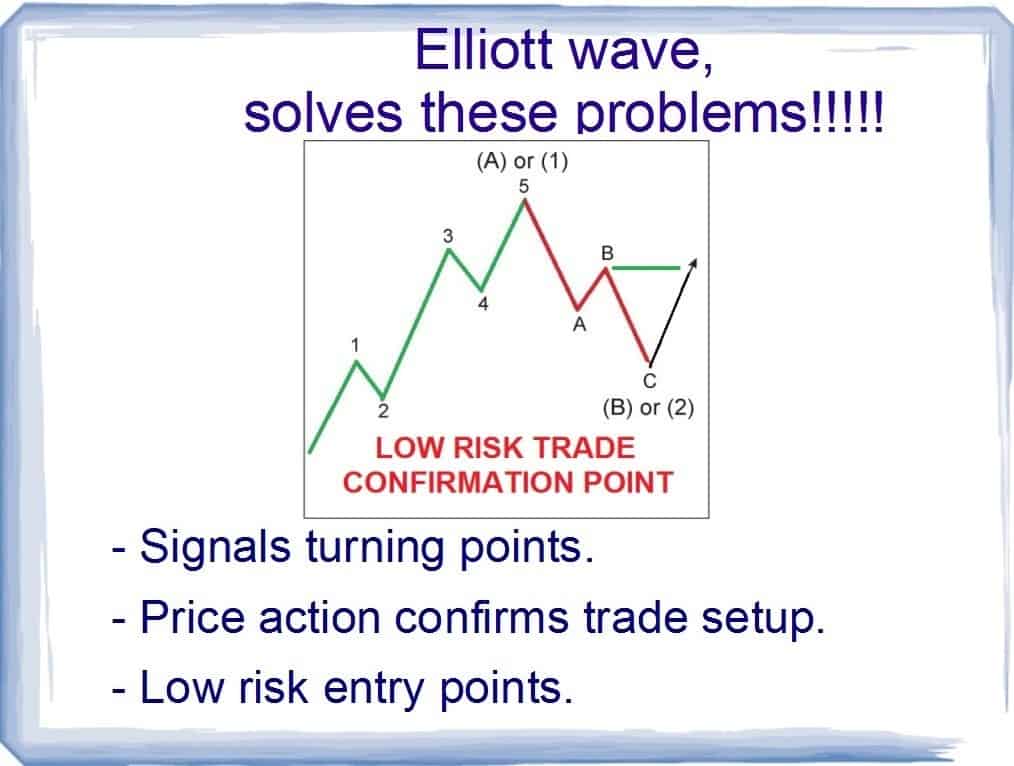
That opportunity presents itself at the high of the ‘B’ wave, within the correction.
Your stop loss can be placed at the low of wave ‘C’.
This setup allows you to place a trade with the lowest possible risk on the table.
It also allows you to reap the reward when your prediction comes good.
What is Elliott Wave trading?
Let me go through the process I use to identify trading signals using my elliott wave analysis.
This is how Elliott Wave Analysis works in a real market situation.
- Here are 5 – low risk / high probability trades,
- all Placed using Elliott wave indicator signals,
- and how those trades worked out.
DOW JONES – Elliott wave analysis 01/30/18
The decline off the high is possible to read as a developing five wave pattern to the downside,
The next thing to look for will be a three wave rally in wave ‘ii’ pink,
And the possibility for an even larger decline in wave ‘iii’ pink.

On the 30th of Janurary, I published this analysis:
The DOW was on the verge of completing five waves down at a minor degree.
And the probability was, that the market was about to sell off in a huge way!
Here’s what I said:
Something bigger is definitely on the cards now!
The decline off the high is possible to read as a developing five wave pattern to the downside,
And the possibility for an even larger decline in wave ‘iii’ pink.
Again,
the results of that call, were astounding!
Check out the chart…….
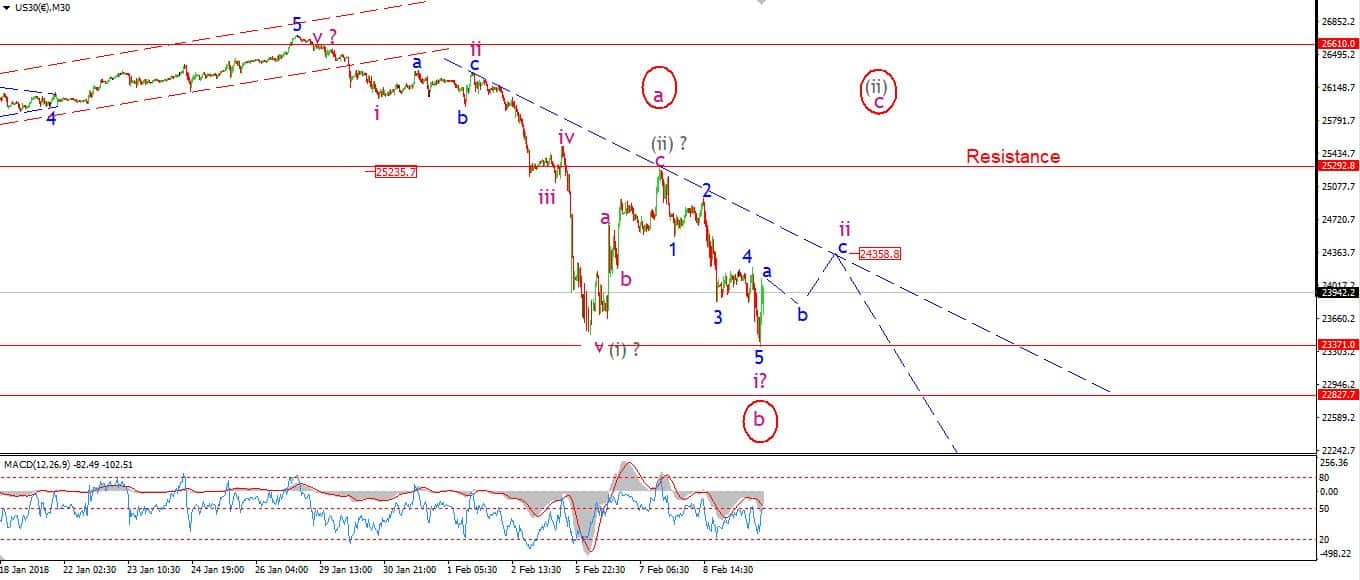
Over the next 10 days the market fell 3000 points!
Need I say anymore?
This is the kind of results that you can expect
with a good Elliott wave count on your side!
CRUDE oil: Elliott wave analysis 10/26/17
On 10/26/17,
we had one of those perfect elliott wave setups in CRUDE oil, one that only Elliott wave analysis could have predicted.
In the nightly update for CRUDE oil,
I had just switched to the alternate wave count,
and the potential for a huge rally was very clear.
“The current wave count sits at a very pivotal point ‘in the price structure.
With a possible third of a third wave up, on the cards over the next few weeks.”
Heres the chart:
The potential was for wave (C) to rally higher, out from a triangle wave (B).
The price stood at 52.42 that night,
with the initial target set at 63.00,
which is an expected rally of 1100 points on offer,
and the pattern was clear!
“Watch for a short decline to complete wave (ii) grey.
At that point looks for a bullish break of the wave (i) high to confirm wave (iii).”
Here’s What happened:
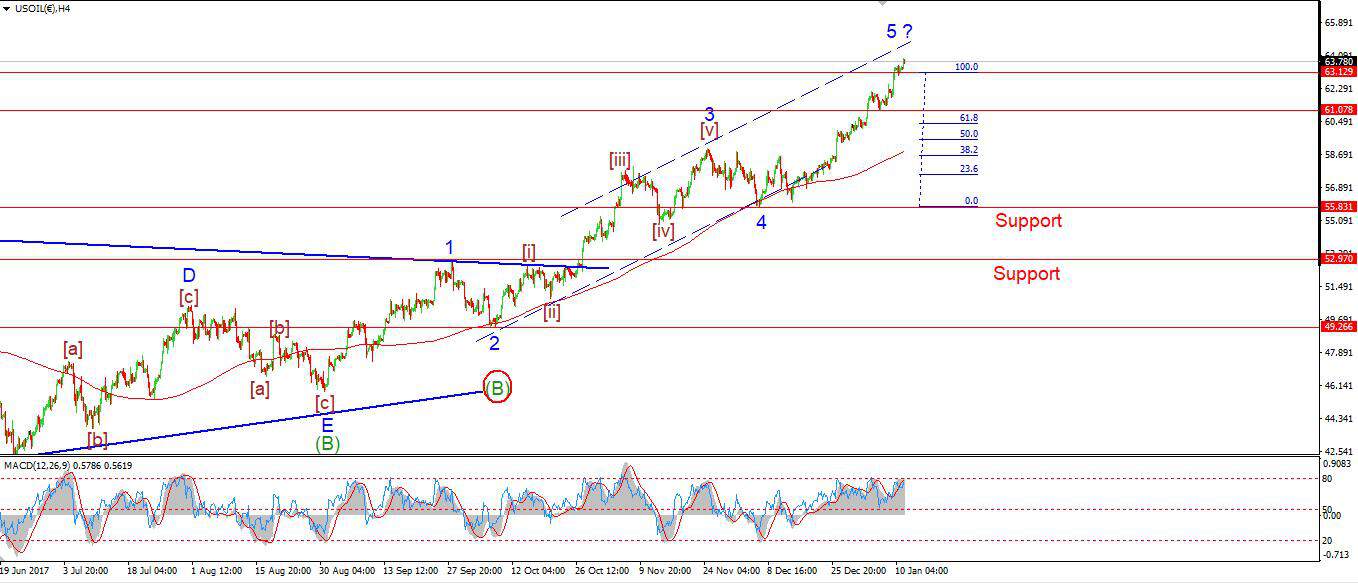
What happened over the following weeks,
is a textbook five wave rally in crude oil which carried the market 1200 points higher,
to three year highs!
When applied correctly, Elliott wave analysis does work.
A good wave count is worth its weight in GOLD, or CRUDE for that matter!
Elliott wave analysis works well in the forex markets also.
Heres an example in the EURUSD FX market.
“the alternate count calls for a rally in wave 2 blue, with a possible target in the 11300 area.”

In this example of EURUSD Elliott wave analysis,
I noticed a complete 5 waves down into wave ‘1’ blue,
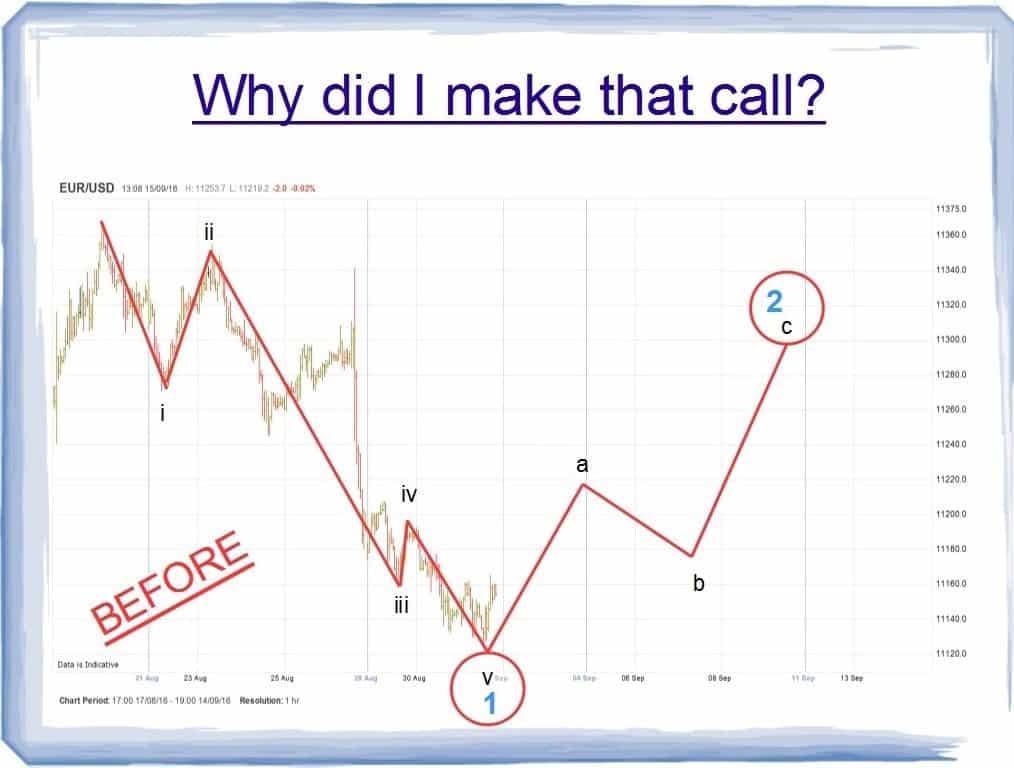
The Elliott wave pattern then predicted corrective rally to happen in three waves.
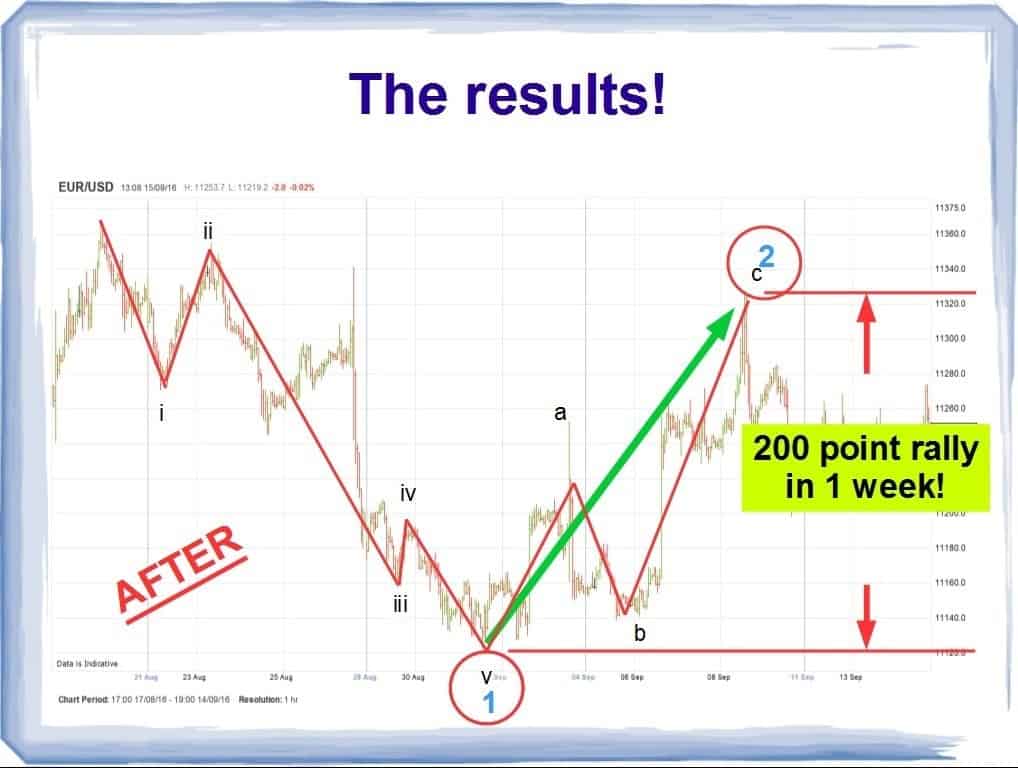
And over the next week the price rose 200 points,
As you can see, when applied correctly Elliott wave indicator signals, are far superior at spotting turning points in the price pattern.
Here’s an example from the GBPUSD forex pair where Elliott wave analysis caught a rally in wave ‘c’.
“I am now expecting a rally into the 13600 area to complete wave ‘ii’ in black.”
This example of GBPUSD Elliott wave analysis was based around a longer term corrective pattern to the upside called a zigzag.
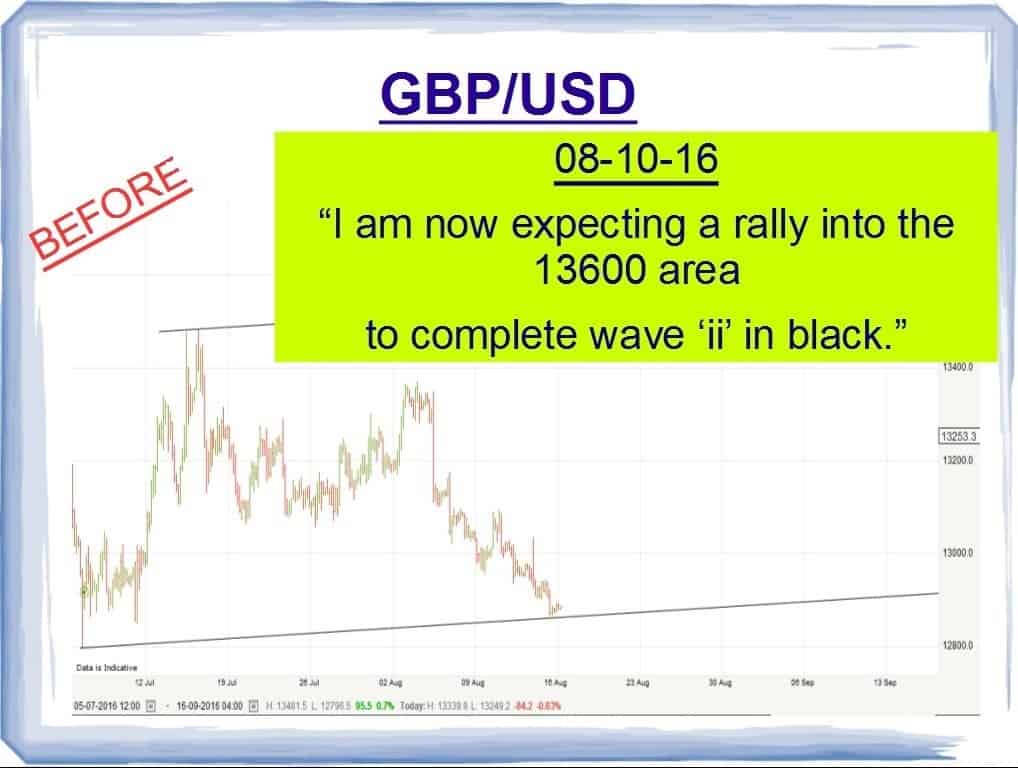
Waves ‘A’ and ‘B’ were complete so I knew wave ‘C’ was likely to start soon.
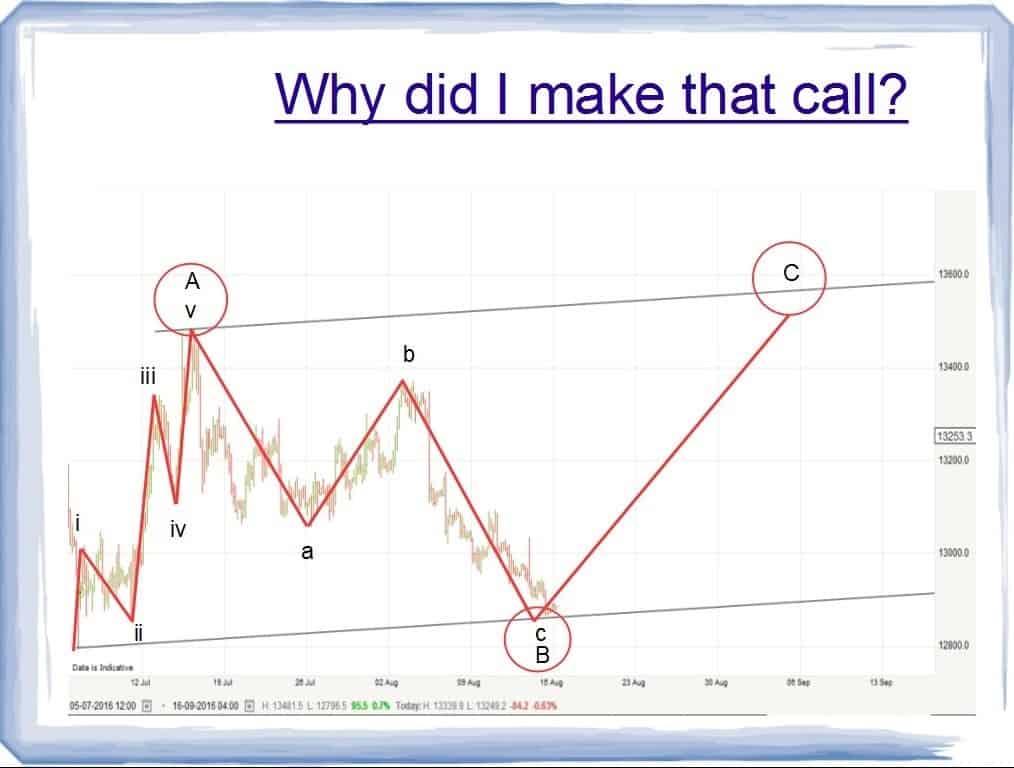
So the GBPUSD Elliott wave forex signals stated that prices would rally in wave ‘C’,
back towards the upper trend channel.
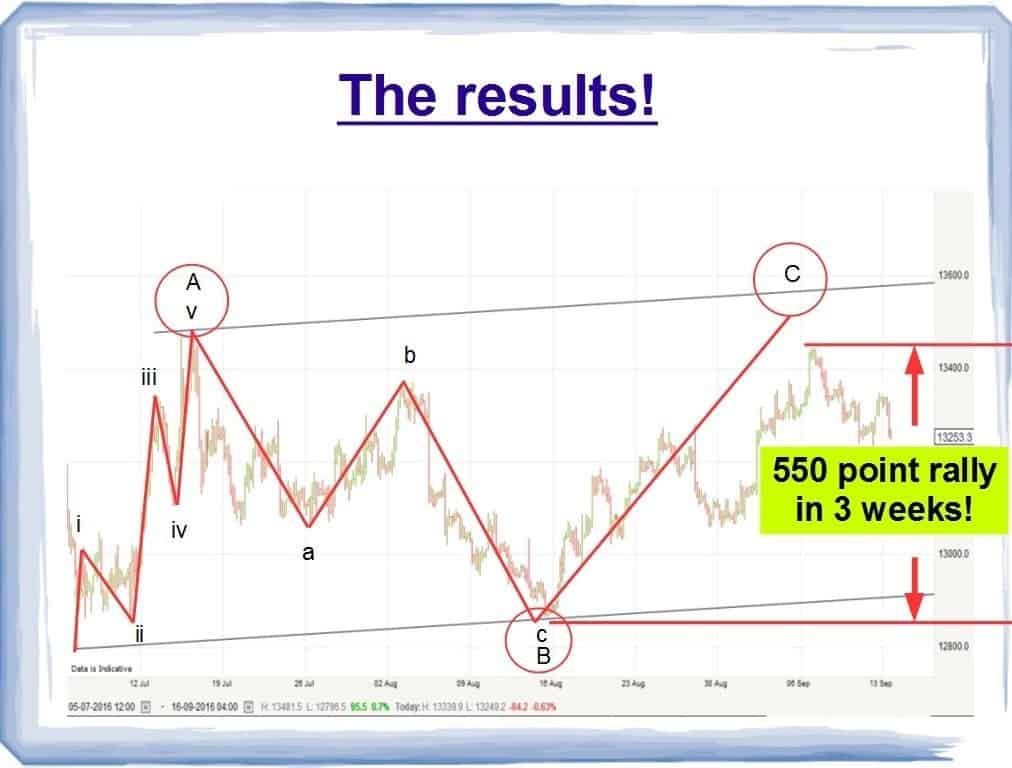
This piece of GBPUSD Elliott wave analysis resulted in a 550 point rally in 3 short weeks.
Here is an example of a five wave rally in the USDJPY forex market.
“Prices have possibly completed that correction and are now back in mode for a large rally ahead.”
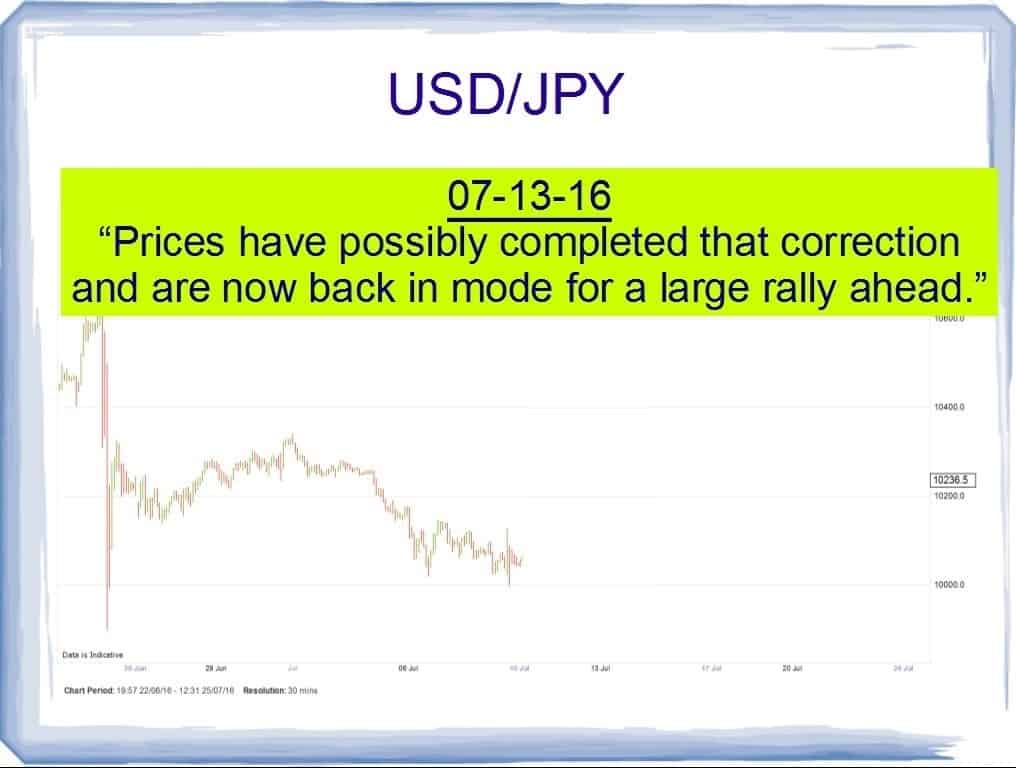
In this example of USDJPY Elliott wave analysis, I noticed an impulsive rally off the post brexit low.
I labelled that wave ‘1’ up,
what came next was a 3 wave decline in wave ‘2’
at that point an elliott wave forex signal was in place.
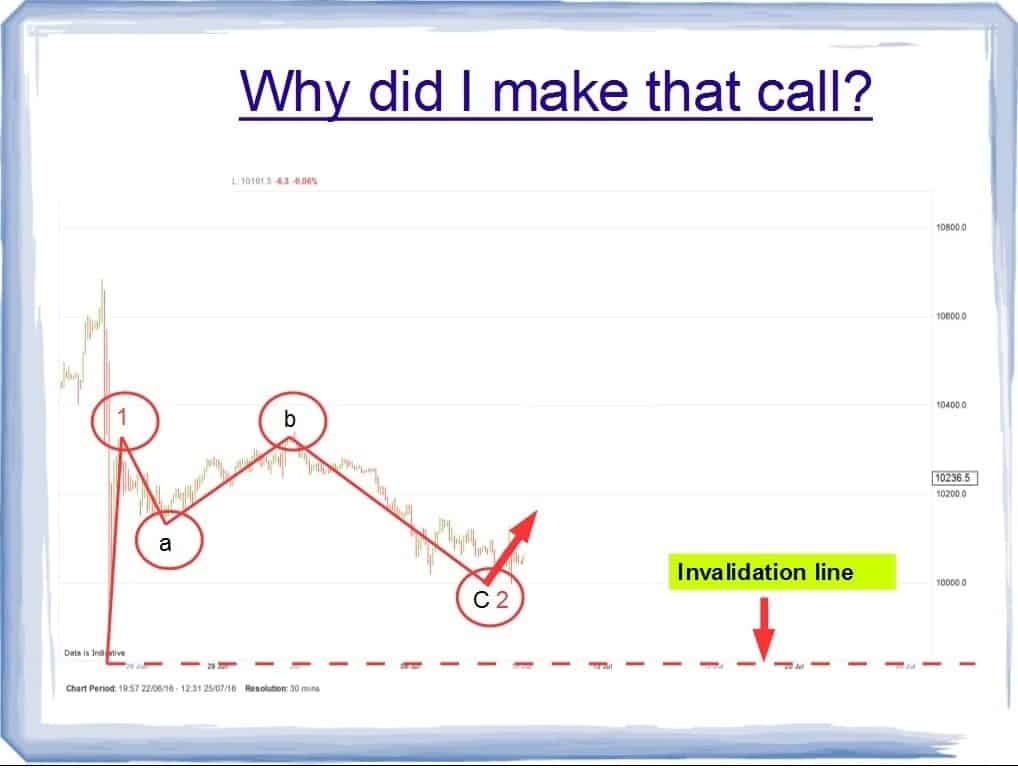
The analysis suggested that wave ‘3’ was about to start, and that the rally should be big!
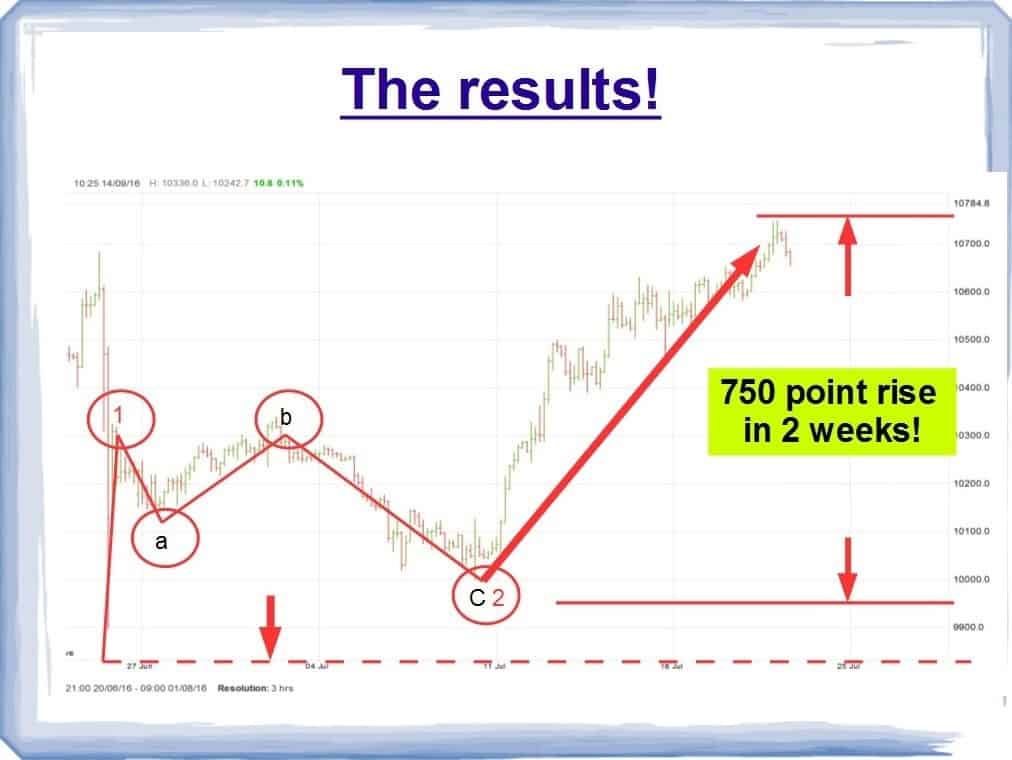
This piece of USDJPY Elliott wave analysis called a 750 point rally in two weeks.
No trading method, other than Elliott wave analysis would allow you to setup for theses trades.
These elliott wave examples show how the elliott wave indicator buy sell signal works in actual trading.
Elliot wave helps me answer four important questions when analysing the price action:
- What direction the price is trending?
- How far is this trend likely to go?
- Where can I enter a trade with the best risk reward ratio?
- And most importantly, at what point am I definitely wrong?!
Elliott wave forecasts help me:
- Spot high probability trade opportunities
- improve my trade entry,
- tighten up my money management
- and in turn increase profitability.
If you can answer those questions in a positive manner, then you are doing OK!
If you cant, then maybe you should give some consideration to Elliott wave analysis.
Because Elliott wave can provide an answer to those big questions, and it offers a course of action on your analysis.
Seeing the waves unfold before your eyes is a very rewarding experience, It is almost like peering into the future!
That is how Elliott wave predictions help my trading,
That is why the wave principle will improve your trading too!
How to use Elliott wave signals in your trading.
