
[vc_row][vc_column][vc_separator border_width=”5″][/vc_column][/vc_row][vc_row][vc_column][vc_column_text]We had an interesting development in stocks today.
The market hit a no-bid ‘air pocket’ and the price dropped dropped 100 points right out of the gate.
This is not a good sign if you are a bull,
The price has recovered this evening but I am marking this one in my diary as the first shot across the bow.
I will elaborate on that later.[/vc_column_text][/vc_column][/vc_row][vc_row][vc_column][vc_column_text]
TOMORROWS RISK EVENTS:
USD: Existing Home Sales, Fed Chair Yellen Speaks.
EUR: N/A.
GBP: Public Sector Net Borrowing.
JPY: N/A.[/vc_column_text][/vc_column][/vc_row][vc_row][vc_column][vc_separator border_width=”5″][/vc_column][/vc_row][vc_row][vc_column][vc_column_text]
EURUSD
[/vc_column_text][/vc_column][/vc_row][vc_row][vc_column][vc_separator border_width=”5″][/vc_column][/vc_row][vc_row][vc_column width=”2/3″][vc_custom_heading text=”30 min” use_theme_fonts=”yes”][vc_column_text]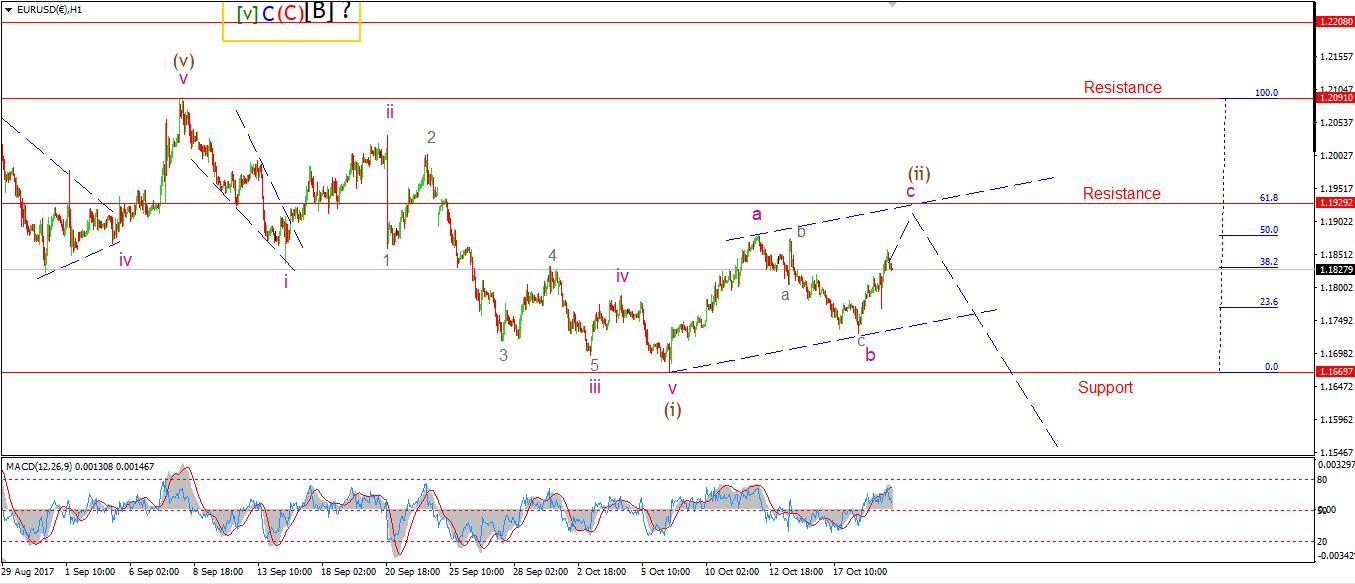 [/vc_column_text][/vc_column][vc_column width=”1/3″][vc_custom_heading text=”4 Hours” use_theme_fonts=”yes”][vc_column_text]
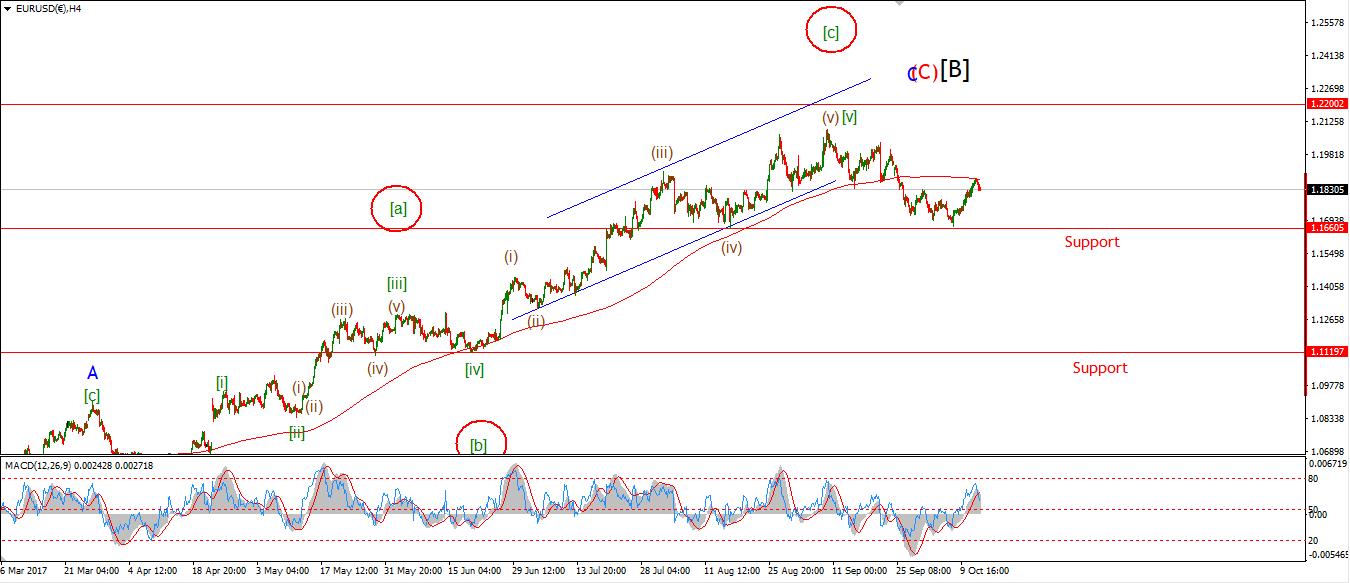 [/vc_column_text][vc_custom_heading text=”Daily” use_theme_fonts=”yes”][vc_column_text]
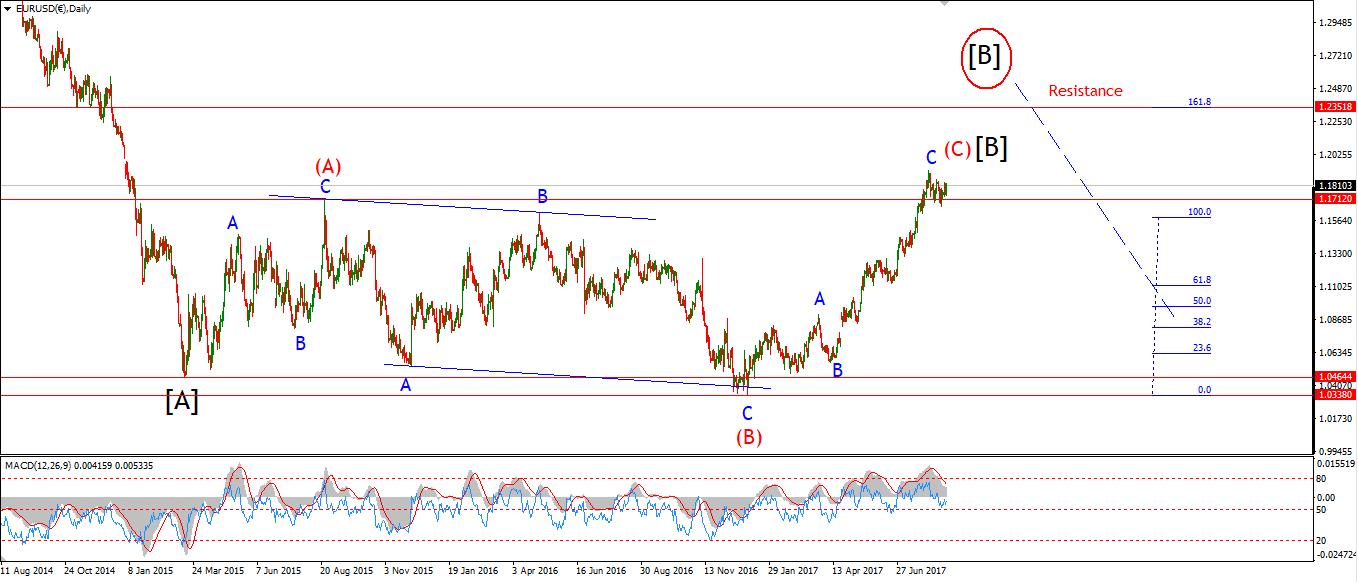 [/vc_column_text][/vc_column][/vc_row][vc_row][vc_column][vc_column_text]My Bias: long term bearish
Wave Structure: downward impulse wave
Long term wave count: lower in wave (3) red
EURUSD is up off the lower trend channel line again today,
Wave ‘c’ of (ii) is well on its way to the target at 1.1930,
to create a possible three wave zigzag correction higher.
once this correction completes,
This market will have created a bearish Elliott wave signal off the high.
For tomorrow;
If the price continues to rise,
Watch for a reaction to the downside in the region of 1.1930.
Wave (iii) brown should carry the price lower in an impulsive fashion.[/vc_column_text][/vc_column][/vc_row][vc_row][vc_column][vc_separator][/vc_column][/vc_row][vc_row][vc_column][vc_column_text]
DOW JONES INDUSTRIALS
[/vc_column_text][/vc_column][/vc_row][vc_row][vc_column][vc_separator][/vc_column][/vc_row][vc_row][vc_column width=”2/3″][vc_custom_heading text=”30 min” use_theme_fonts=”yes”][vc_column_text]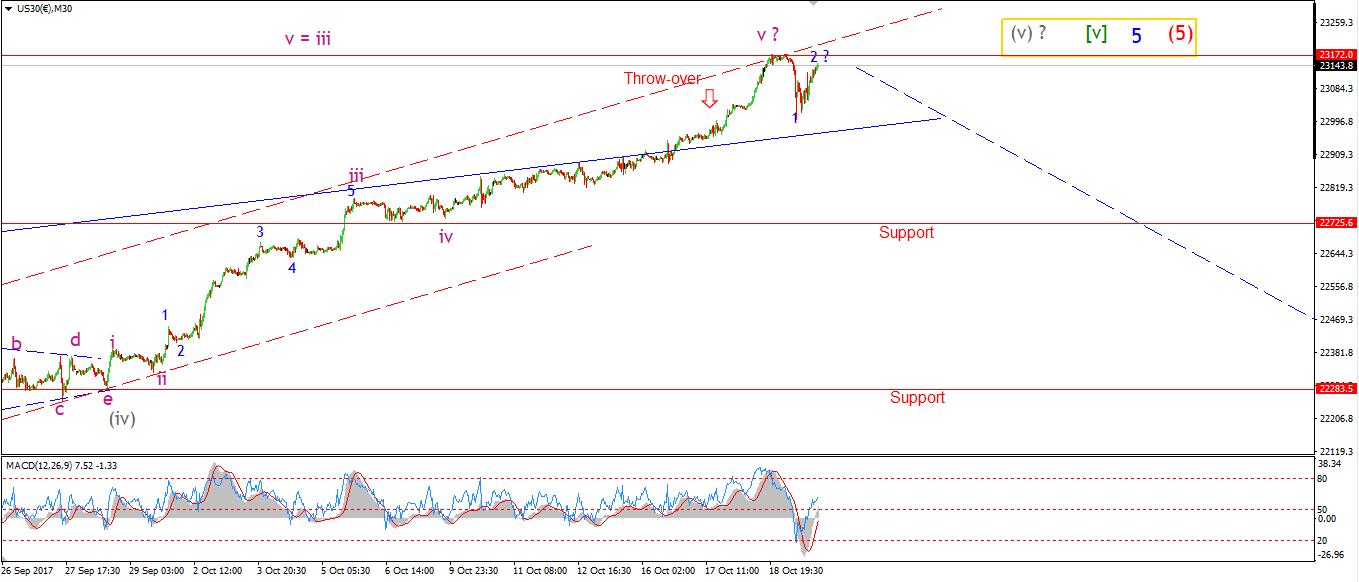 [/vc_column_text][/vc_column][vc_column width=”1/3″][vc_custom_heading text=”4 Hours” use_theme_fonts=”yes”][vc_column_text]
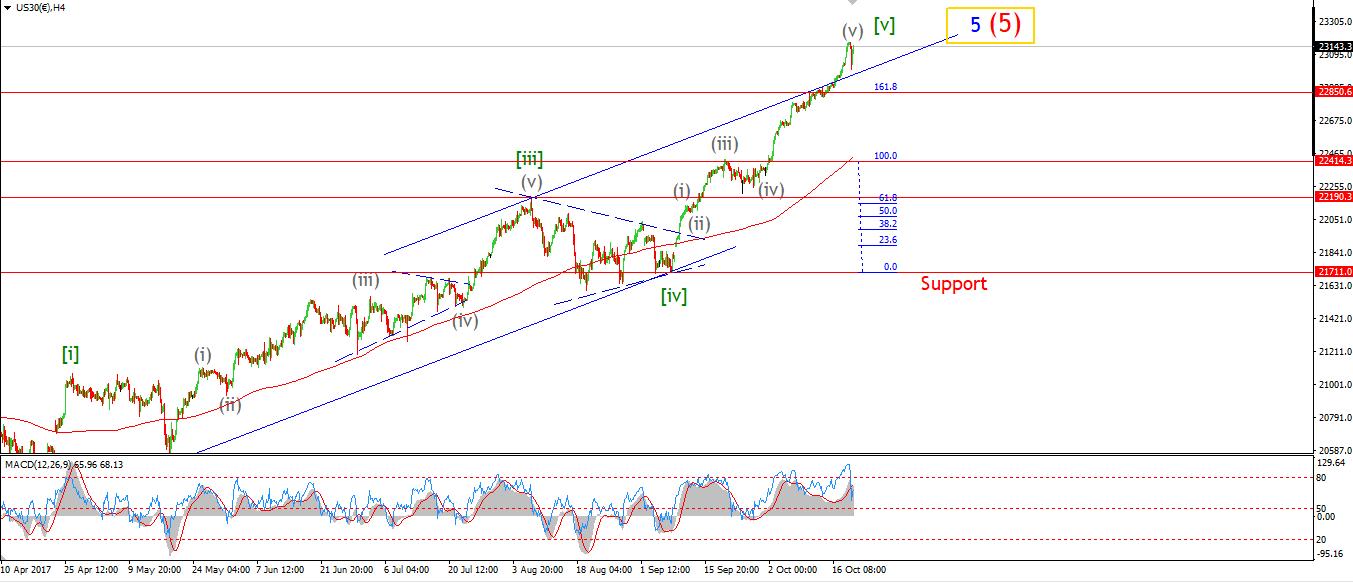 [/vc_column_text][vc_custom_heading text=”Daily” use_theme_fonts=”yes”][vc_column_text]
 [/vc_column_text][/vc_column][/vc_row][vc_row][vc_column][vc_column_text]My Bias: market topping process ongoing
Wave Structure: Impulsive 5 wave structure, possibly topping in an all time high.
Long term wave count: Possibly topping in wave (5)
Todays decline in the DOW is labeled as a possible impulse wave ‘1’ and corrective wave ‘2’.
It is very early days in the top formation,
But the fact that the market hit an air pocket this morning does illustrate that there is less bullish appetite out there at these prices.
We may be seeing the first question marks being raised by the market as to the actual fair value of these stocks.
the 4hr chart shows the extreme momentum reading reached this week, 92.75.
That extreme was followed by today’s decline.
The larger wave count is complete as a five wave advance in both green labels and grey label’s.
It remains to be seen if the short term wave count can extract one more new high for the road.
But,
As I said earlier in the week,
This market is dead, as a value measurement instrument!
The dumb money has all bought in at this stage going by the margin debt data just released.
The wave count will soon reveal a five wave decline to the downside
and then a bearish Elliott wave signal at a lower high.
And then this market will punish as many souls as possible in the next half cycle.
A further sharp decline tomorrow may be wave ‘3’ blue.
lets see if today’s action continues to create that bearish signal we are on the lookout for.[/vc_column_text][/vc_column][/vc_row][vc_row][vc_column][vc_separator][/vc_column][/vc_row][vc_row][vc_column][vc_column_text]
GOLD
[/vc_column_text][/vc_column][/vc_row][vc_row][vc_column][vc_separator][/vc_column][/vc_row][vc_row][vc_column width=”2/3″][vc_custom_heading text=”30 min” use_theme_fonts=”yes”][vc_column_text]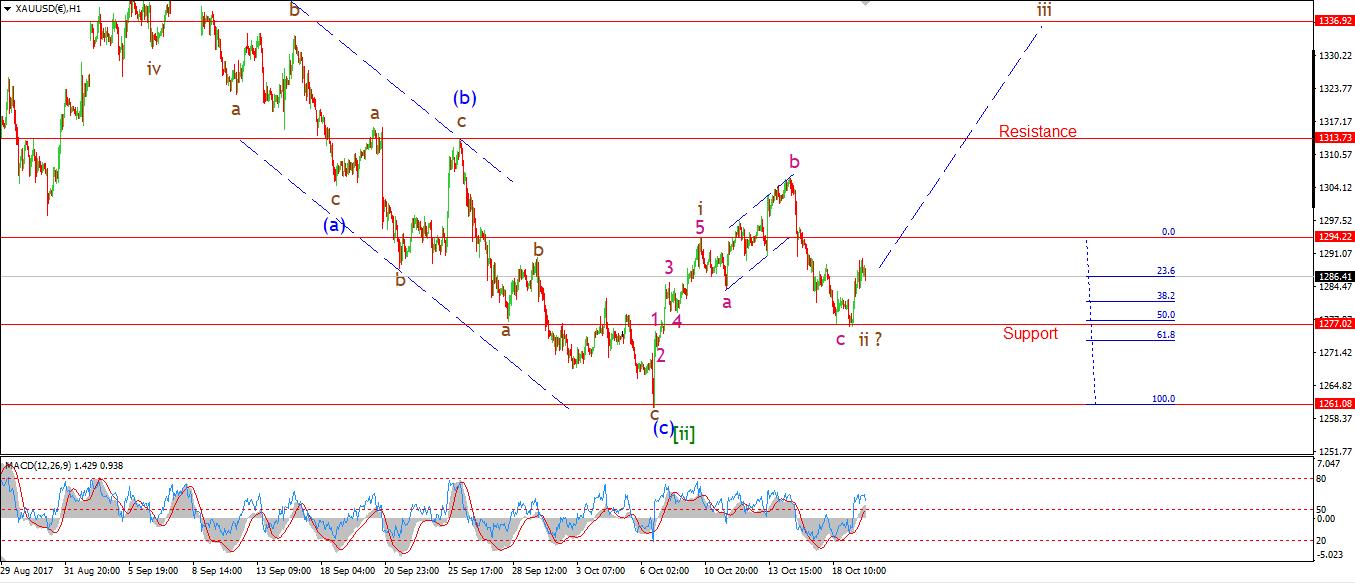 [/vc_column_text][/vc_column][vc_column width=”1/3″][vc_custom_heading text=”4 Hours” use_theme_fonts=”yes”][vc_column_text]
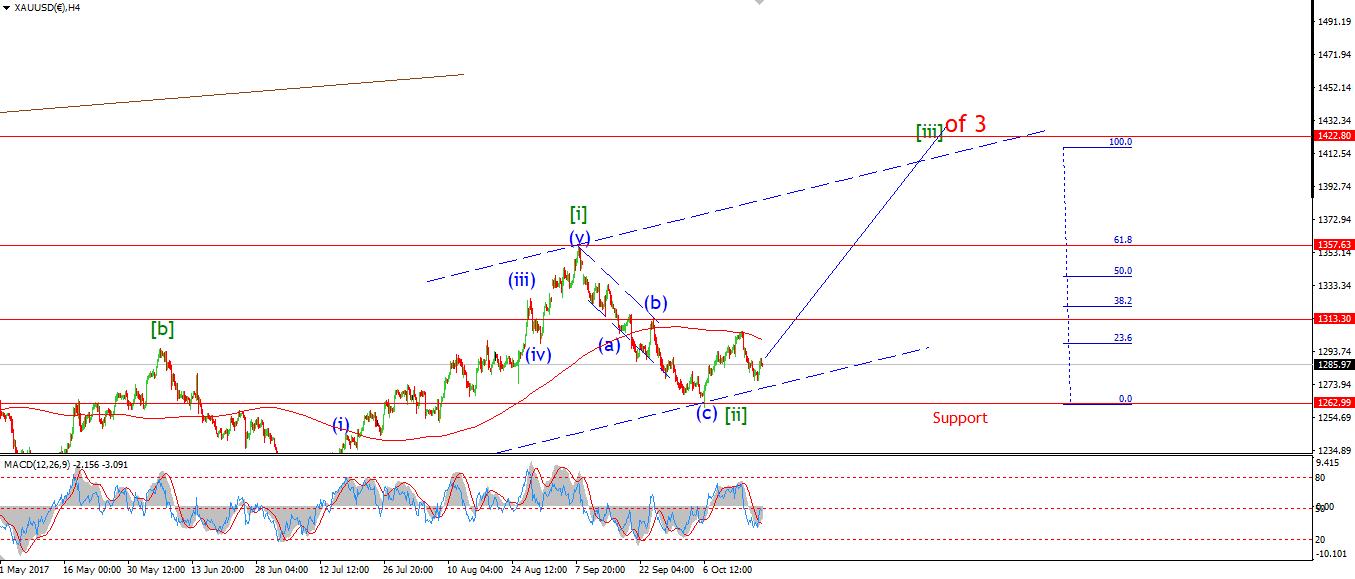 [/vc_column_text][vc_custom_heading text=”Daily” use_theme_fonts=”yes”][vc_column_text]
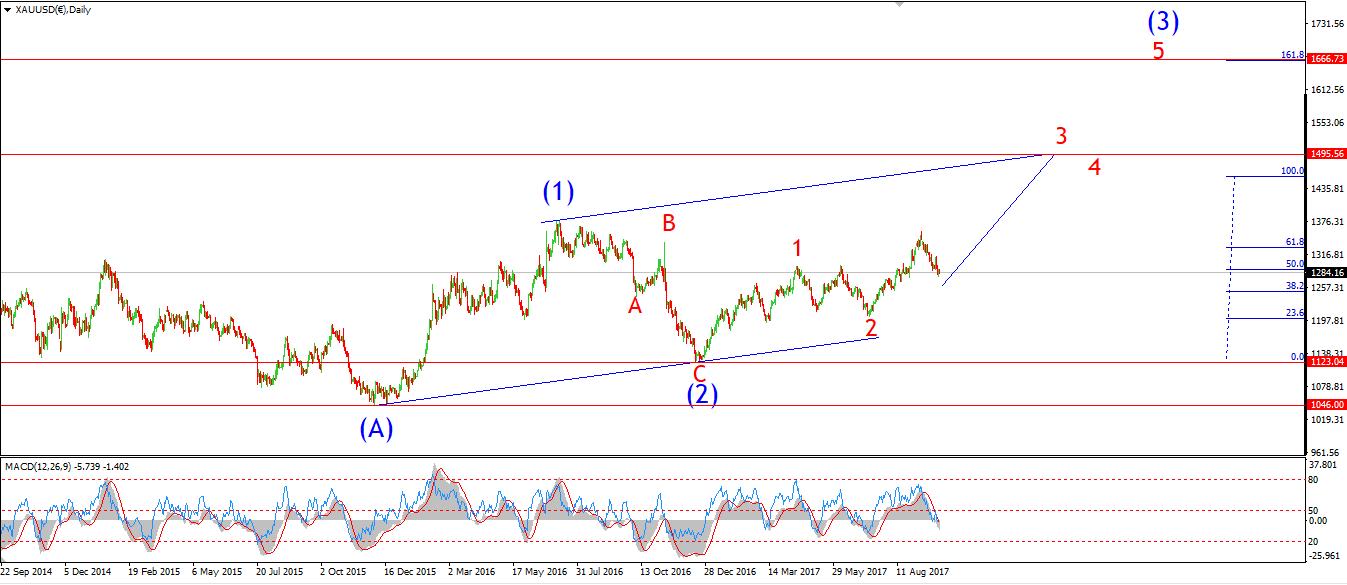 [/vc_column_text][/vc_column][/vc_row][vc_row][vc_column][vc_column_text]My Bias: Long to a new all time high above 1827.
Wave Structure: Impulse structure to a new high.
Long term wave count: wave (3) above 1666.
GOLD bounced off support at the 50% retracement level today.
The price has again taken an impulsive form,
So the probability is high for a rally in wave ‘iii’ brown.
The initial point of resistance lies at 1294,
which is the high of wave ‘i’ brown.
IF the bullish signal proves correct,
Then wave [iii] green should rally powerfully,
the target for wave [iii] is in the region of 1510,
where wave [iii] reaches 161.8% of wave [i] green.
This is shown on the 4hr chart.
So the prize on offer is a nice one!
For tomorrow;
Watch for another higher low above today’s low of 1276.98.
A break of 1313.30 will signal wave [iii] green has begun.[/vc_column_text][/vc_column][/vc_row][vc_row][vc_column][vc_separator][/vc_column][/vc_row]