
In this guide to using Elliott wave degree labels I will show you;
how to count elliott wave labels on any chart,
and, how to get those Elliott wave degree labels working for you correctly.
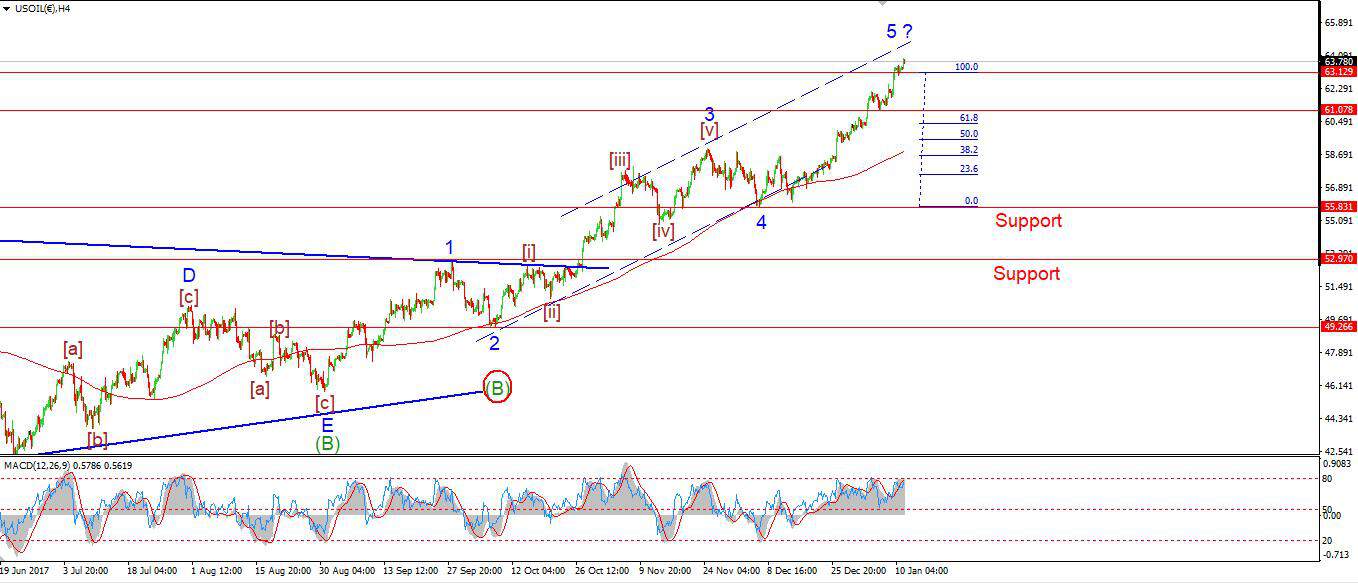
Here’s an example of what a ‘good count’ can lead to:
Crude oil bullish ‘1’ ‘2’ setup out of a Triangle;
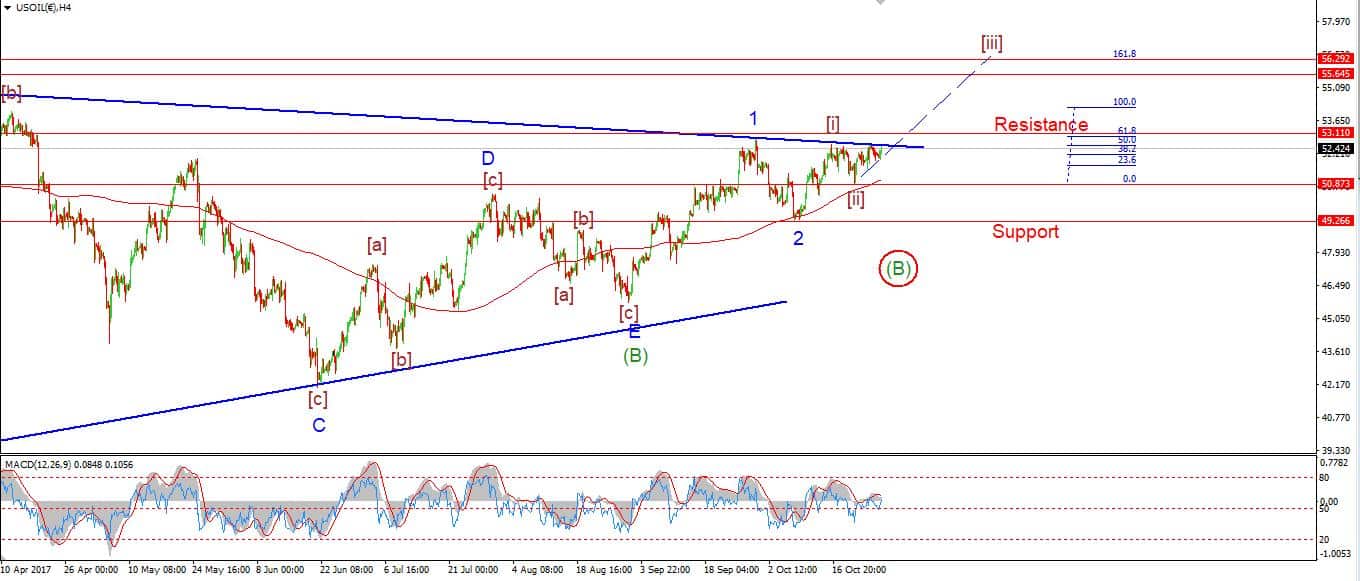
The price then rallied in five waves to a 4 year high;
When you figure out the guidelines and rules of elliott wave labels and apply them correctly on the charts.
Then you will have a tool that will serve you well in any market and on any chart.
So lets get into it, shall we!
This post is a guide on how to read my nightly Elliott wave charts.
DEFINE THE TREND, and Labeling it correctly using Elliott waves.
Elliott wave degree labels are like Russian dolls!
When you open a Russian doll, it reveals a smaller version of itself, Elliott waves labels operate in much the same way on the chart.
If you manage to crack open the larger trend, it will reveal smaller versions of itself inside!

When I look at a chart for the first time, I want to Identify the most recent extreme low or high and I start labelling from there.
And like a Russian doll, once the dominant trend is identified and labelled.
The next step is to label the internal wave structure, within that trend.
and just like opening the doll, you dig deeper and deeper into the unfolding wave structure until you can start to make predictions on what might come next, given the larger structure.
and each doll reveals a smaller version of itself inside!
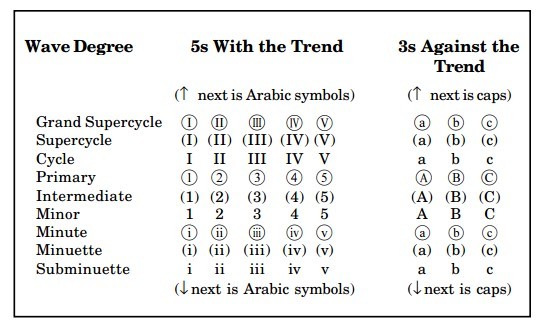
Elliott wave degrees of trend:
Each degree of trend is labelled with a different style of label, In my own charts I always group every degree of trend together with the same color as well as the same style label.
here is an example of the trend degree.
I have shown five charts of GBPUSD below, each chart digs deeper into the wave structure to reveal the next lower degree wave count.
starting with the weekly chart:
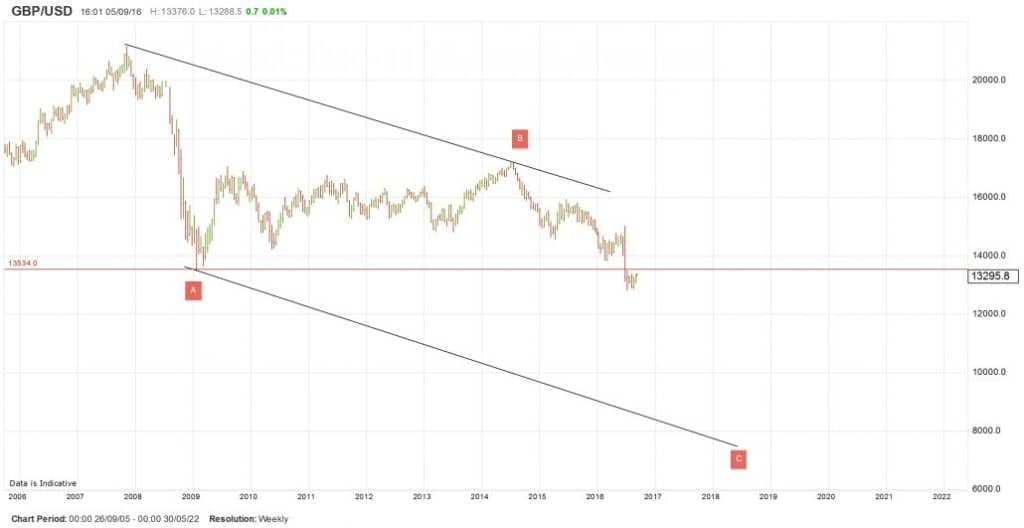
Starting at the last extreme high, I label the chart with the most likely wave structure. In this case a zigzag correction downwards.
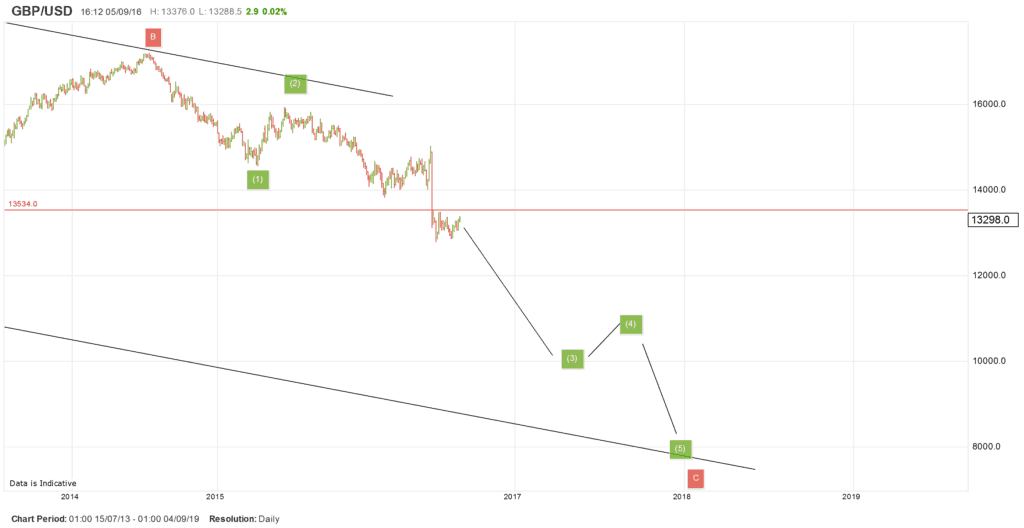
That zigzag form should unfold in a 535 internal wave structure.
So;
I label the internal waves of the ‘C’ wave in red as an unfolding five wave form. labelled in green
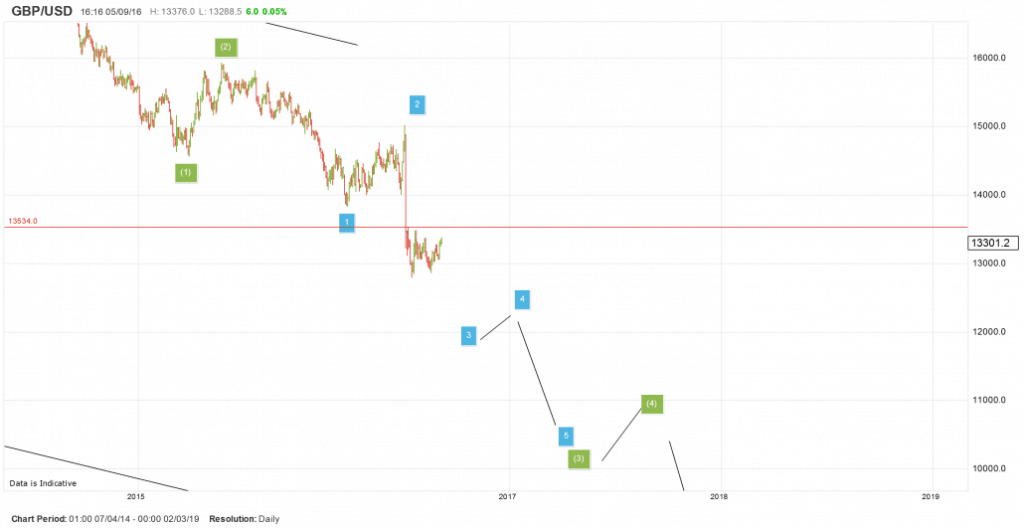
The green wave should unfold in five waves itself and it looks like waves (1) and (2) green are already complete. with wave (3) green underway.
Wave (3) green should unfold in five waves itself, and these waves are labelled in blue.
Within wave (3) green it looks like waves 1 and 2 blue are complete and wave 3 blue is underway.
The blue wave structure should unfold in five waves also,
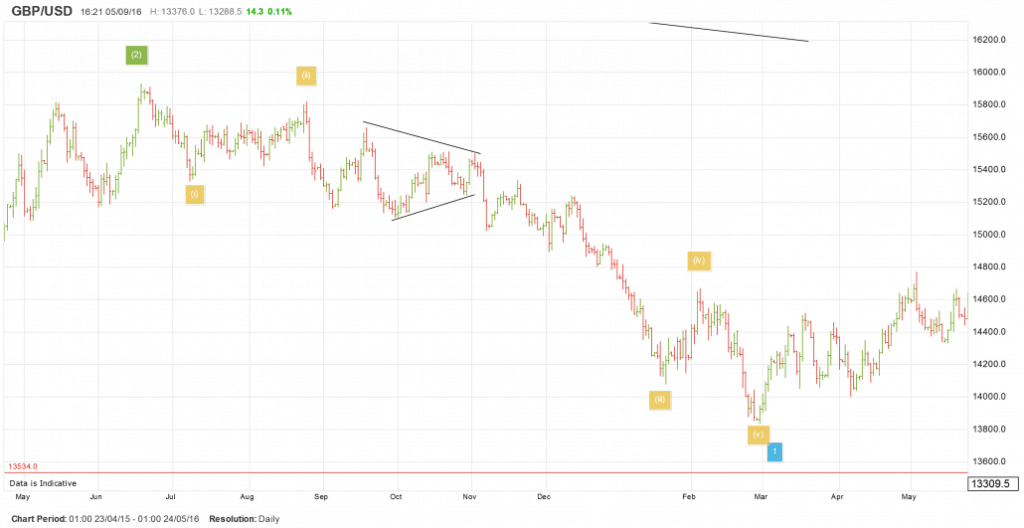
So lets drill down into wave 1 blue and see how that went.
Those five waves are labelled in yellow, and completed at the low of wave 1 blue and then turned up into wave 2 blue.
wave (I) yellow should itself trace out five waves down, how did that go?
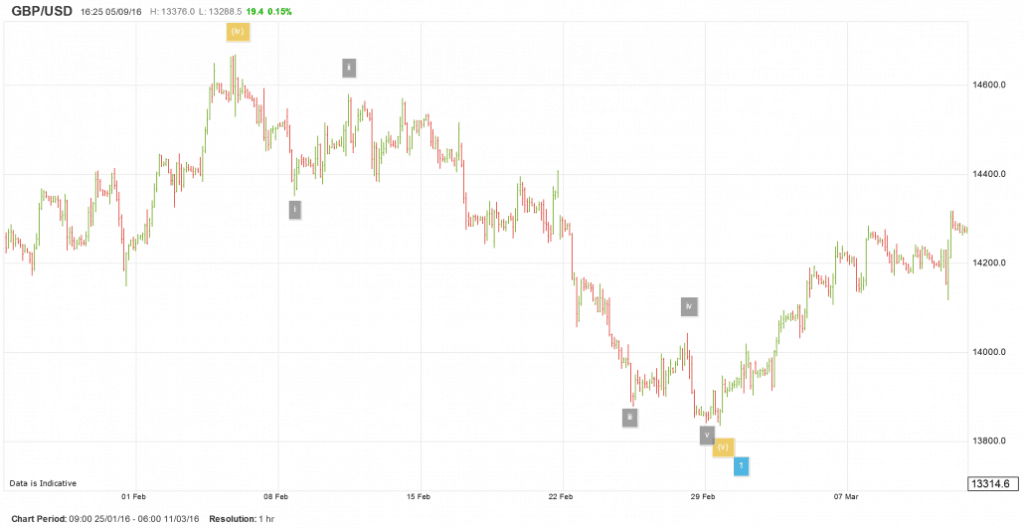
Those five waves are labelled in grey, and they traced out a textbook 5 wave form before turning up in wave (ii) yellow.
So;
You see that each wave adheres to the structure, and the overall structure is built from the ground up in ever increasing degrees of form.
With some practice you will learn how to count elliott waves on any chart, and any time frame.
And the method will complement your analysis.
I hope this helps you figure out my charts, and the daily Elliott wave analysis.
How to use Elliott wave signals
