Define a Correction using Elliott wave.
In this video I explain
how to define correction using Elliott wave theory.
Welcome to the second module in our mini course
catching market tops and bottoms using Elliott wave theory.
This module is called identifying counter-trend moves using Elliott wave theory.
Counter trend moves are called corrections,
So let's go through what exactly is an Elliott wave correction,
So the basic definition of the correction in Elliott Wave terms
is a 3 wave movement against the direction of the dominant trend.
In module number one
we figured out what the dominant trend is,
now once you know that a dominant trend move in five waves has completed,
you know to expect the counter-trend correction.
So in this video
I will show you how to go through that and how to identify them.
Corrections are always labeled in either ABC or wxy,
an ABC move is a simple correction
while wxy labeling is also a correction
but it's what we call a combination or complex correction.
A complex correction is where multiple simple corrections come together
to form a larger corrective structure.
A correction is an overlapping and undecided market move
so you'll know it, by looking at it.
A correction will take what seems like an age to complete,
in comparison to an impulsive move to make any kind of progress in any direction whatsoever.
So;
in a correction it's almost like the market does not want to move that direction,
but the wave structure called for it to happen.
The market price is moving against what it really wants to do
and that kind of bears witness in the price structure itself.
On average
corrections tend to retrace about fifty percent of the trend move
so even knowing that particular knowledge
will give you an idea of where to target for a correction.
You know what to expect when this correction finishes.
To a large extent an initial target for a corrective move comes in at
the previous fourth wave low of one lesser degree.
This is a very powerful tool to forecast corrections
and I'll go through that with you in detail on the charts.
so how does that translate into charting and analysis and trading in general
well again we'll use our USDJPY example That I used in the first video
where we went through the trend move,
in this video we'll go through the correction and how that's
played out so far,
and how to label that and what's the best interpretation in terms of the wave count.
and then what that correction means for the market outlook.
Again you can apply this knowledge to any market that you're following
it doesn't have to be Forex.
As with this is the example, the the basic tenants will stand across any market.
so let's get on in there and i'll show you exactly how that plays out on the chart itself
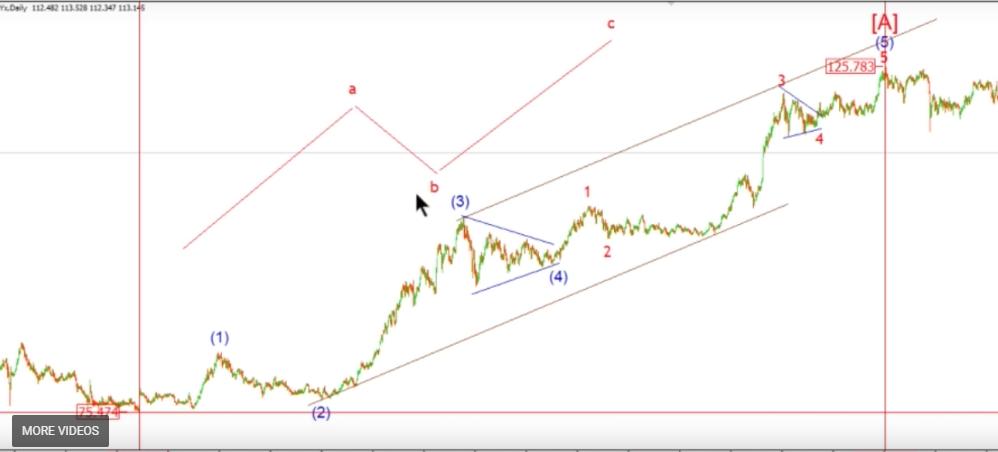
so now that we have our impulse wave a complete
the first leg of this new trend move to the upside.
There are two guidelines for corrections
one: the correction is attracted to the previous fourth wave low
so that would be around 96 there on this particular chart.
Two; a substantial retracement of about fifty percent on average
so we put in a Fibonacci grid there and that will give us one
target so we'll put in a target line there at 100 now we have our two targets
we have between 96 and 100 so that I think that this wave is complete.
So lets see how this wave has performed so far
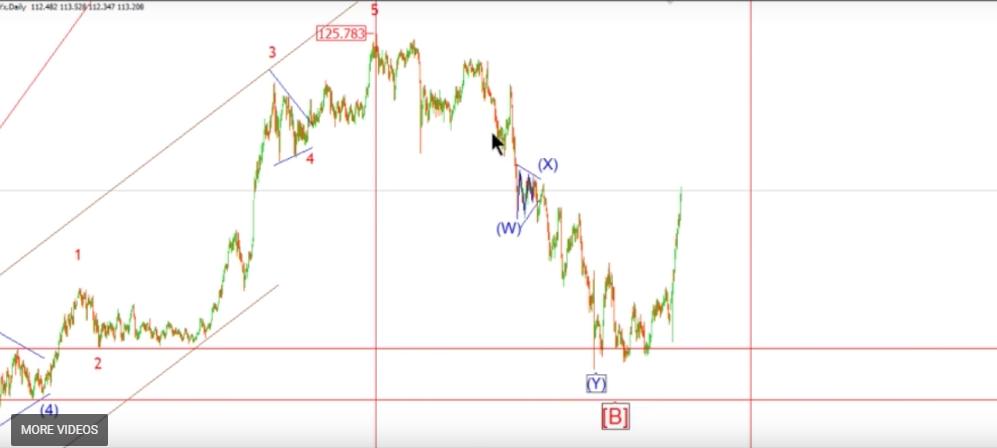
you can see that since the high we've had this overlapping very undecided move in the market.
so
we reached a low right in the middle of that range there of 98 so we had 98.80 i think which was right in the center of the range
Why do I believe that this is a corrective move rather than a new and impulse move to the downside.
well i'm going to look at the three areas
the form first of all is like I said overlapping undecided
it took a long time for this market to cover no ground really whatsoever
in comparison to the impulsive move to the upside off the 75.00 low
the market just seemed to move like a steam train
just travel on up without anything getting in its way.
And even that corrective move didn't retrace you know a whole lot in terms of the the points traveled
so what i can say is by just looking at this form here that it looks definitely corrective to me.
there's no way that you can really label this with any certainty as impulsive to the upside
so the first thing I'm going to do is to look at a possible form for this that correction to the
downside
now it doesn't look like a simple correction,
a simple zigzag would look something like this,
we would have five waves down,
and three waves up and then another five ways to the downside
giving this a simple form in three moves
what we have here in this case is something completely different
I believe it's a combination so it's an additive form,
it takes multiple different types of Corrections add them together to make one larger structure
the first thing that attracts my eyes in this whole move
here is this central kind of contraction of prices and what I think is a contracting triangle.
i'm going to get a couple of trend lines around that.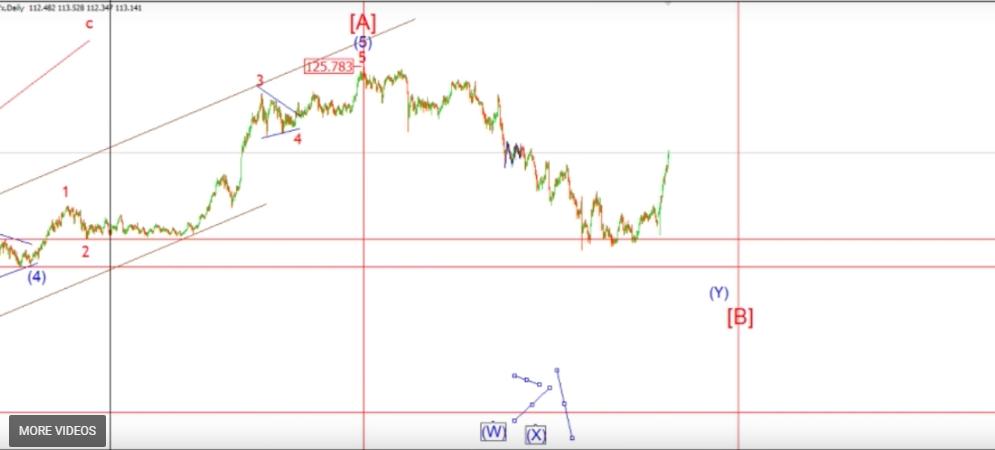
now remember what I was saying about contracting triangles,
we said that they either happen in the B wave position or a fourth wave position
You can be pretty sure that this central contracting triangle here
is either a B wave or a fourth wave.
A combination is labeled as a WXY rather than ABC just to differentiate it from the simple corrective form in ABC.
so in this case
the x wave would take the place of the B wave
that X wave being the version of the b-wave we're going to label that as X and if that is the end of the X wave, or then start of this
triangle would be the end of the first leg down in wave W
There is an argument that this low here in june is the completion of that whole B wave.
I think that we had a initial decline down in wave A.
we had a contraction triangle in a wave x and were either finished wave Y
OR
we will get one more decline down in white complete immediately what you'll see is the wave the final wave of this correction reached our initial target zone of between 96 about fifty percent retracement,
and the previous fourth wave low
let's get on in there and label the internal waves here and see how far we are along this correction
and where the wave structure is likely to go from here.
so first of all
i'm going to take the first initial move here,
we can see that we had three moves off the high, three separate moves off the high
and then the market reacted to that initial move down.
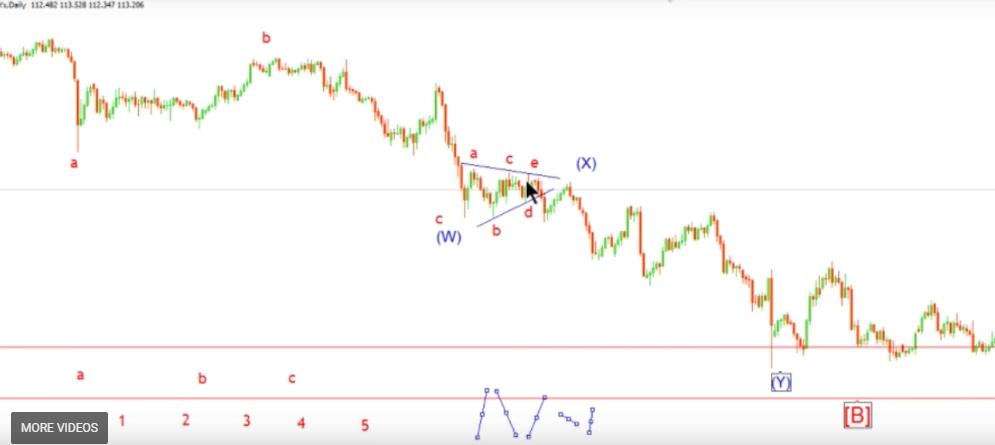
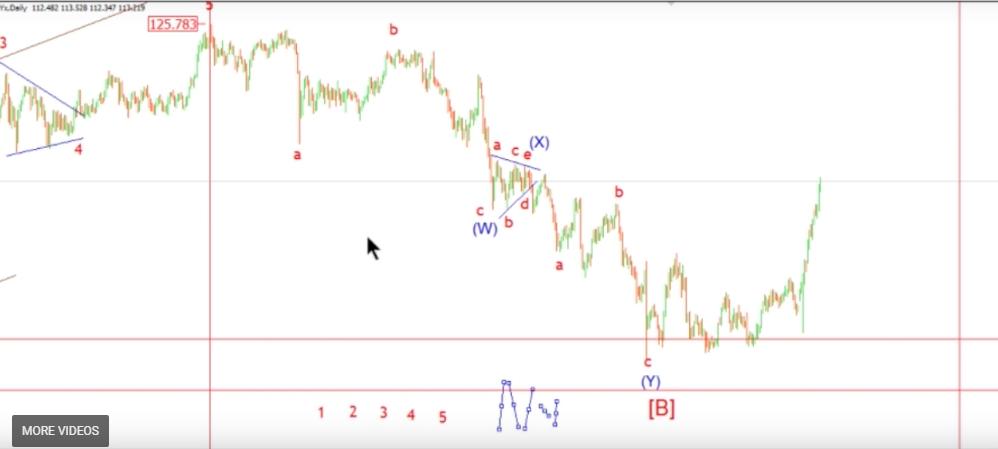
So this first initial three wave move off the high I'm going to label with 'a' label.
how the market reacted after that's where we got three waves up in wave 'b'
since that 'b' wave hi we had an impulsive form to the downside and that completes your wave 'W'
This central wave here is a contracting triangle, it defines the whole form as a corrective.
That contracting triangle completes wave 'Y'
you would expect another overlapping and schizophrenic move to the downside and that's exactly what we got so far anyway.
Let's move on to that third wave, will see how that has played out so far.
let's look at this structure here first.
After a long time studying this I think the best way to label this within three waves.
Once again in a possible flat correction we call it a flat correction because of the internal wave structure rather than it being flat
in form.
So first we had three waves to a low here and I'm going to label that wave a since it's just like in the first move off the extreme
hi.
There we had three waves into the first low.
now we've had three ways here into this low.
Then off that a wave low we had this strange structure, and I think the best way to label this is as a running flat.
This is where the first leg takes the market up
the second leg kicks the market down past of the beginning of the first leg
and the third leg takes the market close to but not past the initial move down.
let's see well as we said this could be this whole structure complete. it could be ABC down in W
It could be five wave contracting contracting triangle in wave 'X'
and we could have an ABC down in 'Y'
that would mean it's right in the middle of this this initial target zone that we had for our correction to complete
it's got three overal waves, its got a central contracting triangle and you know it fits the bill.
In terms of defining a counter-trend move, Im going to look at a few different things are going to look at the actual structural form is it
an overlapping form,
i think you can say yes in this case.
does the market price find it hard to make any negative or positive gains
and in this case you can say yes.
we know here, the price has flatlined for almost eight months here, which is the quintessential corrective type of move
a lot of internal moves but no actual net gain in the price
And then thirdly what is the best most likely labeling for us.
Can you can you point out an impulsive move?
This price action doesn't fit a five wave form as you can see that the previous first leg up did fit the five wave form far better than a three wave one I think.
In this case you can see that the internal waves fit a three wave from far better.
Another question to ask yourself is
can you see triangles?
and if you can see contracting triangles, where do they most likely fit in a wave structure
Like I said the triangle is usually a B wave or position or a fourth wave position
in this case it's in the central part of the move it's got overlapping moves on both sides, and you can pretty much say that that's an 'X' or 'B' wave right there.
You can see that the overall form fits the kind of characteristics of a correction rather than a new impulsive move to the downside.
So that is identifying corrective waves.
We have labeled this and we constructed the wave form and we have identified it as as a correction
In the next video we're going to go into identifying the maturity of any trend.[/vc_column_text][/vc_column][/vc_row]
