
[vc_row][vc_column][vc_column_text]
DOW hits an air pocket, wave count saw it coming!
[/vc_column_text][/vc_column][/vc_row][vc_row][vc_column][vc_separator border_width=”5″][/vc_column][/vc_row][vc_row][vc_column][vc_column_text]
EURUSD
[/vc_column_text][/vc_column][/vc_row][vc_row][vc_column][vc_separator border_width=”5″][/vc_column][/vc_row][vc_row][vc_column width=”2/3″][vc_custom_heading text=”30 min” use_theme_fonts=”yes”][vc_column_text]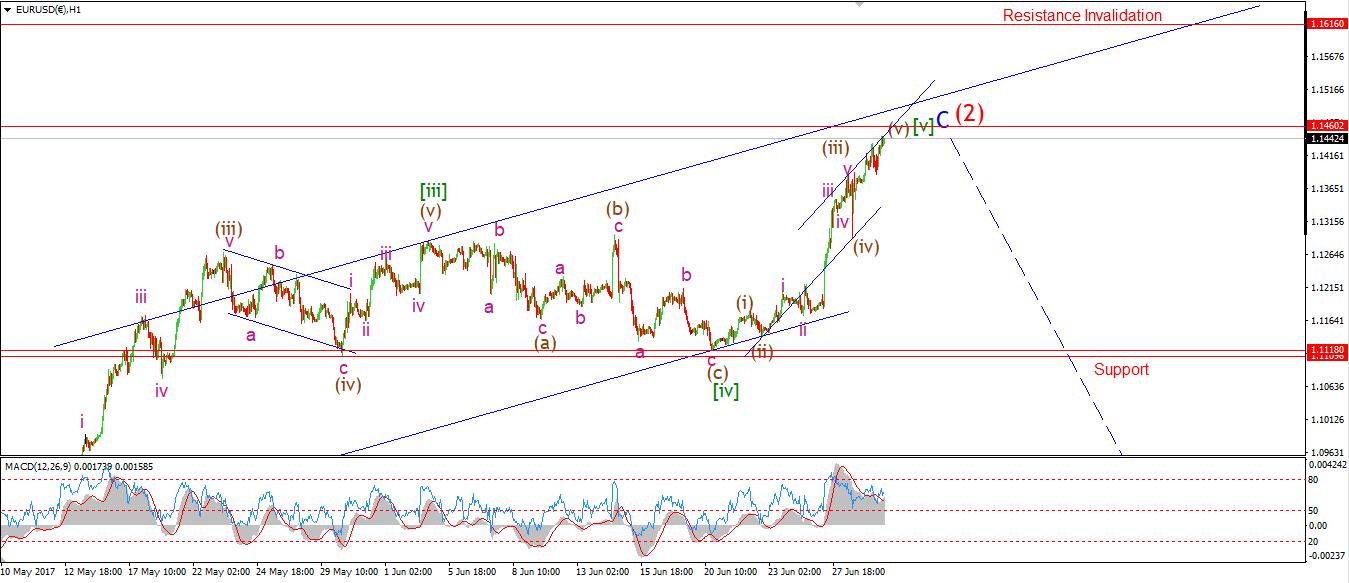 [/vc_column_text][/vc_column][vc_column width=”1/3″][vc_custom_heading text=”4 Hours” use_theme_fonts=”yes”][vc_column_text]
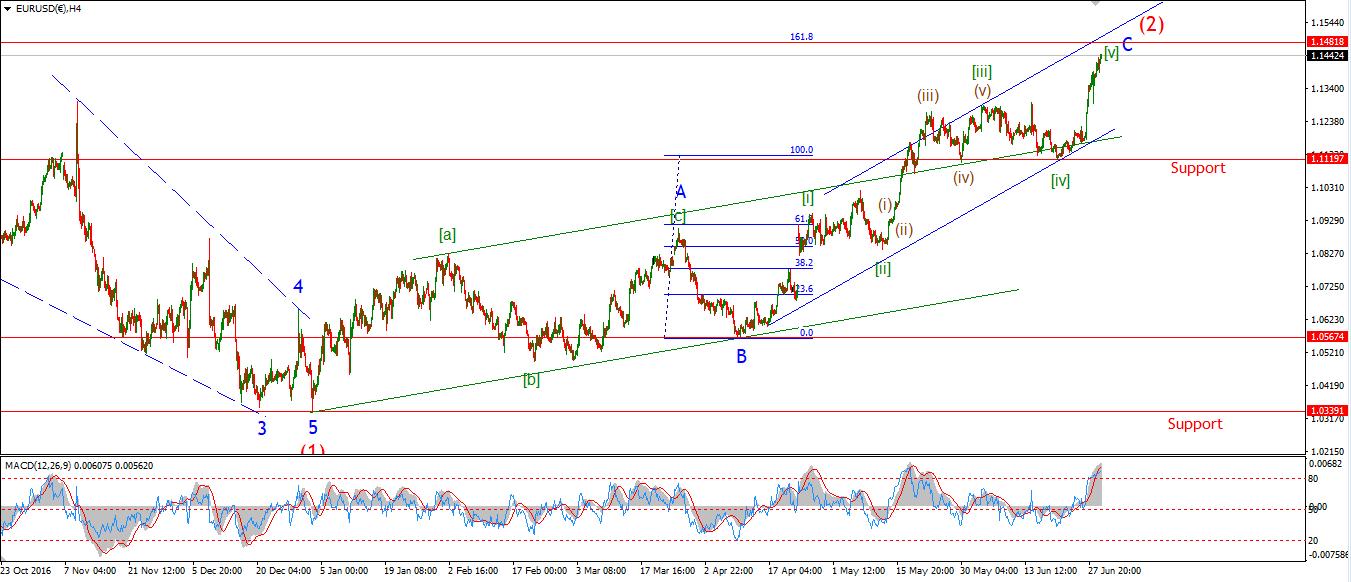 [/vc_column_text][vc_custom_heading text=”Daily” use_theme_fonts=”yes”][vc_column_text]
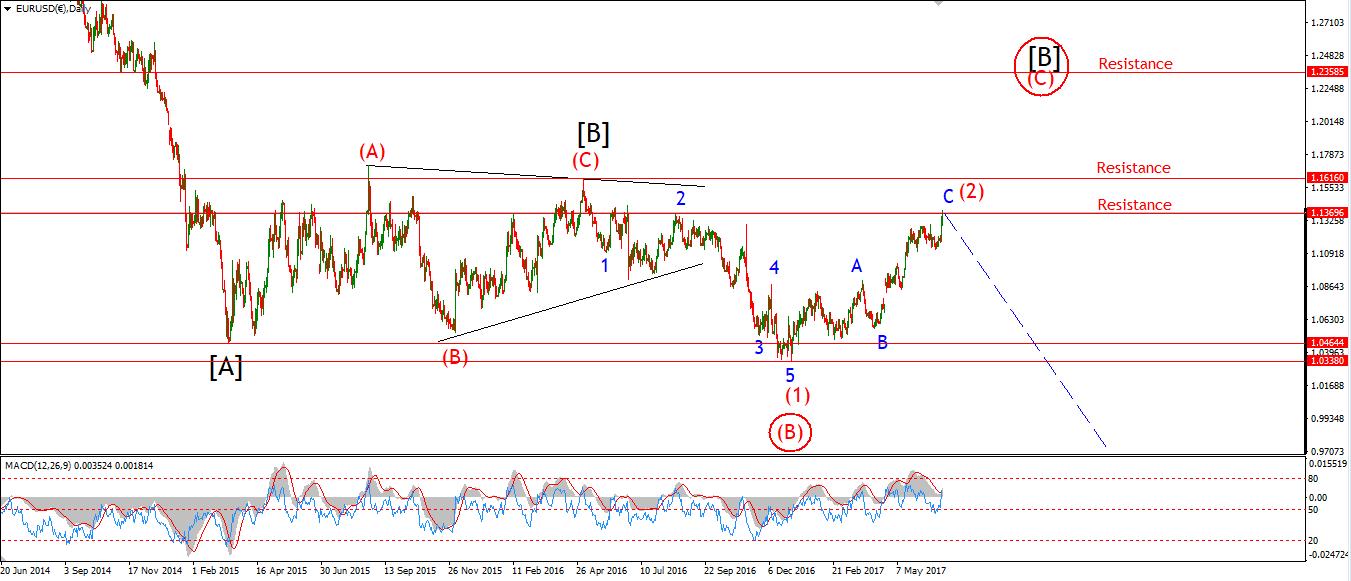 [/vc_column_text][/vc_column][/vc_row][vc_row][vc_column][vc_column_text]My Bias: short in wave 3 blue.
Wave Structure: downward impulse wave 1, 2 blue
Long term wave count: lower in wave 3 blue
Important risk events: EUR: German Retail Sales m/m, CPI Flash Estimate y/y. USD: Personal Spending m/m, Chicago PMI.
Bon soir, tout le monde!
EURUSD hit highs not seen since exactly one year ago!
And just like the last time we saw these highs,
The result will be the same!
The more this overbought and over-bullish situation persists,
The bigger the downfall we will see.
The target i set yesterday is now in sight.
1.1480 is where wave ‘C’ blue reaches a Fibonacci 162% of wave ‘A’ blue.
The 4hr chart shows another extreme in both MACD and RSI.
So upside momentum has topped out at this stage.
For the next few sessions Keep a close eye on a turn to the downside again.
A lower high with a momentum signal will offer a good short opportunity soon.[/vc_column_text][/vc_column][/vc_row][vc_row][vc_column][vc_separator border_width=”5″][/vc_column][/vc_row][vc_row][vc_column][vc_column_text]
USDJPY
[/vc_column_text][/vc_column][/vc_row][vc_row][vc_column][vc_separator border_width=”5″][/vc_column][/vc_row][vc_row][vc_column width=”2/3″][vc_custom_heading text=”30 min” use_theme_fonts=”yes”][vc_column_text]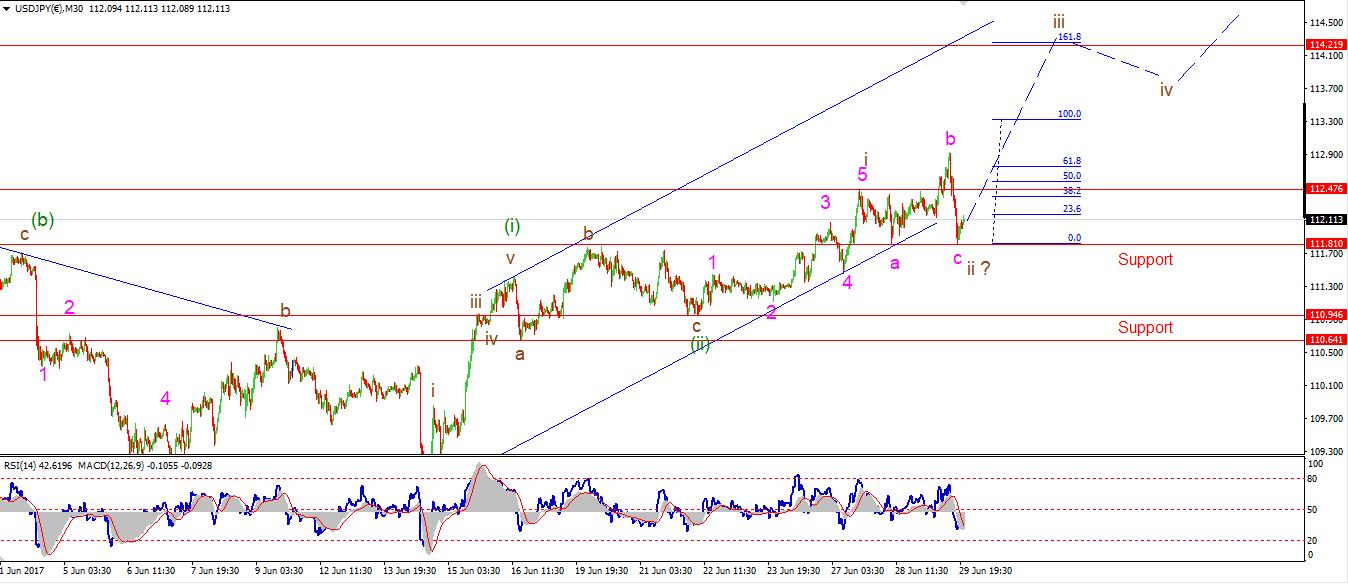 [/vc_column_text][/vc_column][vc_column width=”1/3″][vc_custom_heading text=”4 Hours” use_theme_fonts=”yes”][vc_column_text]
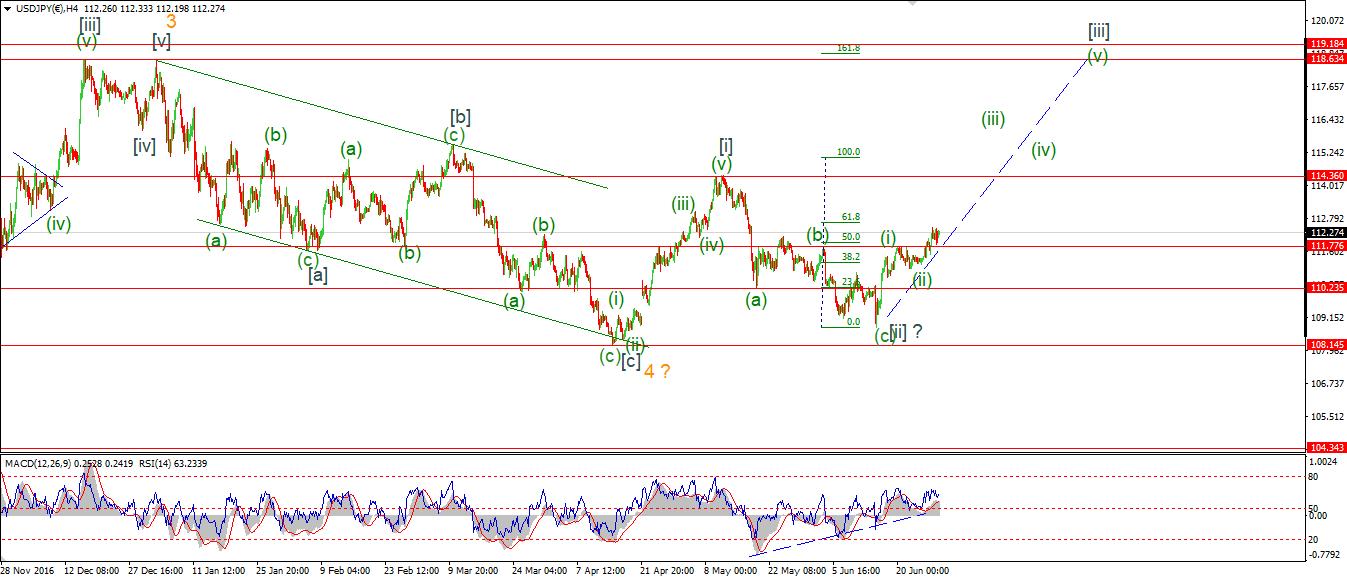 [/vc_column_text][vc_custom_heading text=”Daily” use_theme_fonts=”yes”][vc_column_text]
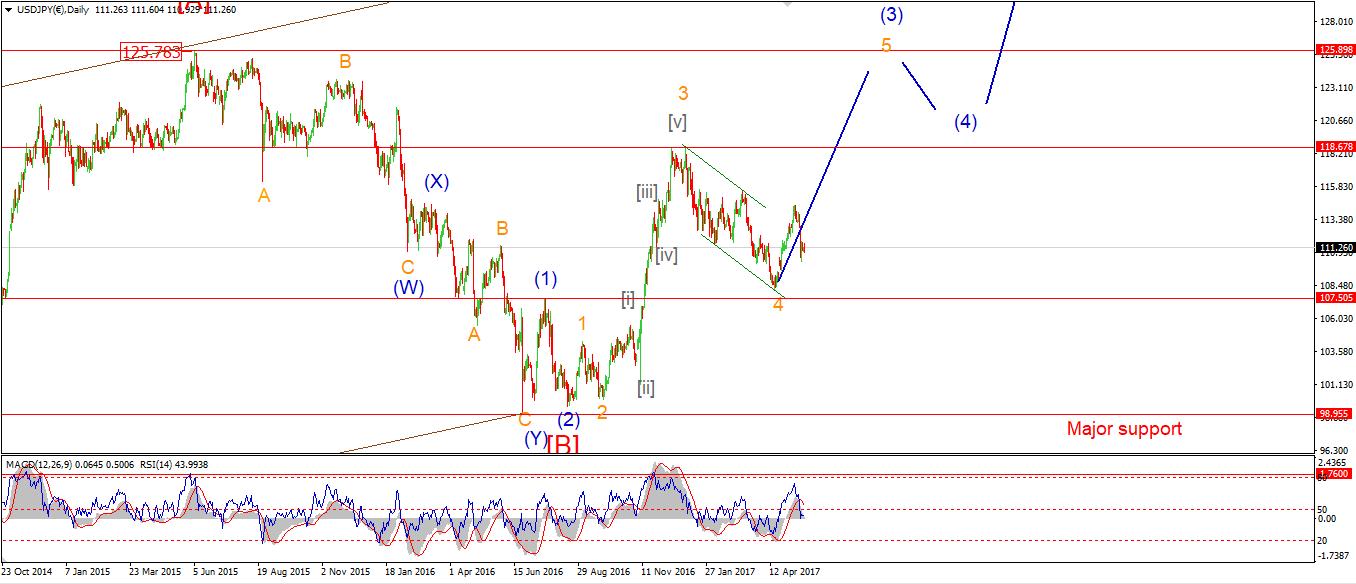 [/vc_column_text][/vc_column][/vc_row][vc_row][vc_column][vc_column_text]My Bias: LONG
Wave Structure: rally in wave [C]
Long term wave count: wave [C] is underway, upside to above 136.00
Important risk events: JPY: N/A. USD: Personal Spending m/m, Chicago PMI.
The short term action in USDJPY over the last few days seems to have traced out an expanded flat correction in wave ‘ii’ brown.
After rising in the overnight session,
The price then dropped in a five wave form off the high
I have labelled that wave ‘c’ pink.
The price has again popped higher off the lows,
So wave ‘iii’ brown may be underway.
An upside break of 112.47, the wave ‘i’ high, will signal that wave ‘iii’ has begun.
For tomorrow watch for that break to occur, and the formation of a higher low above 111.81.
110.94 is key support from here and must not be broken.[/vc_column_text][/vc_column][/vc_row][vc_row][vc_column][vc_separator][/vc_column][/vc_row][vc_row][vc_column][vc_column_text]
DOW JONES INDUSTRIALS
[/vc_column_text][/vc_column][/vc_row][vc_row][vc_column][vc_separator][/vc_column][/vc_row][vc_row][vc_column width=”2/3″][vc_custom_heading text=”30 min” use_theme_fonts=”yes”][vc_column_text]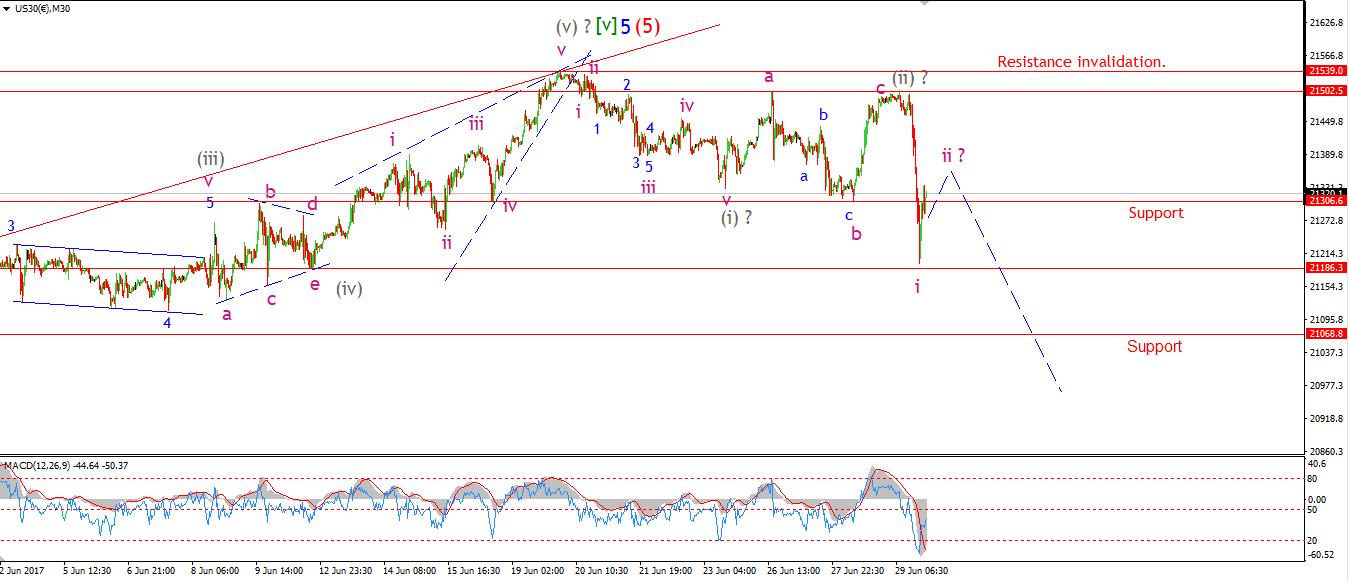 [/vc_column_text][/vc_column][vc_column width=”1/3″][vc_custom_heading text=”4 Hours” use_theme_fonts=”yes”][vc_column_text]
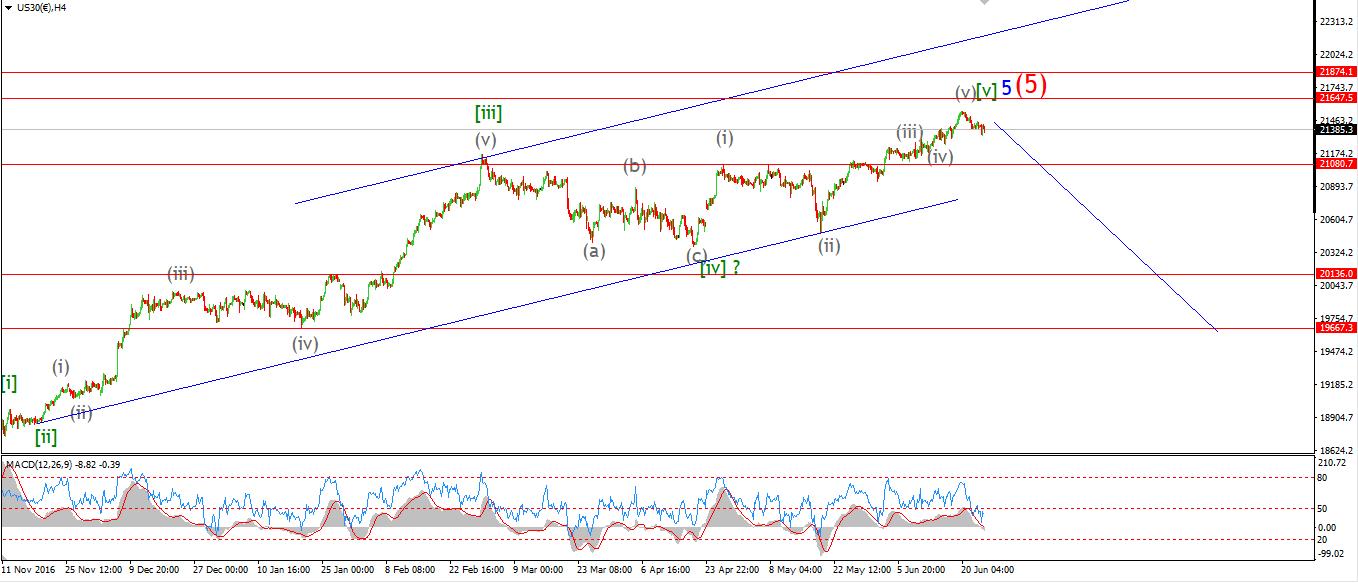 [/vc_column_text][vc_custom_heading text=”Daily” use_theme_fonts=”yes”][vc_column_text]
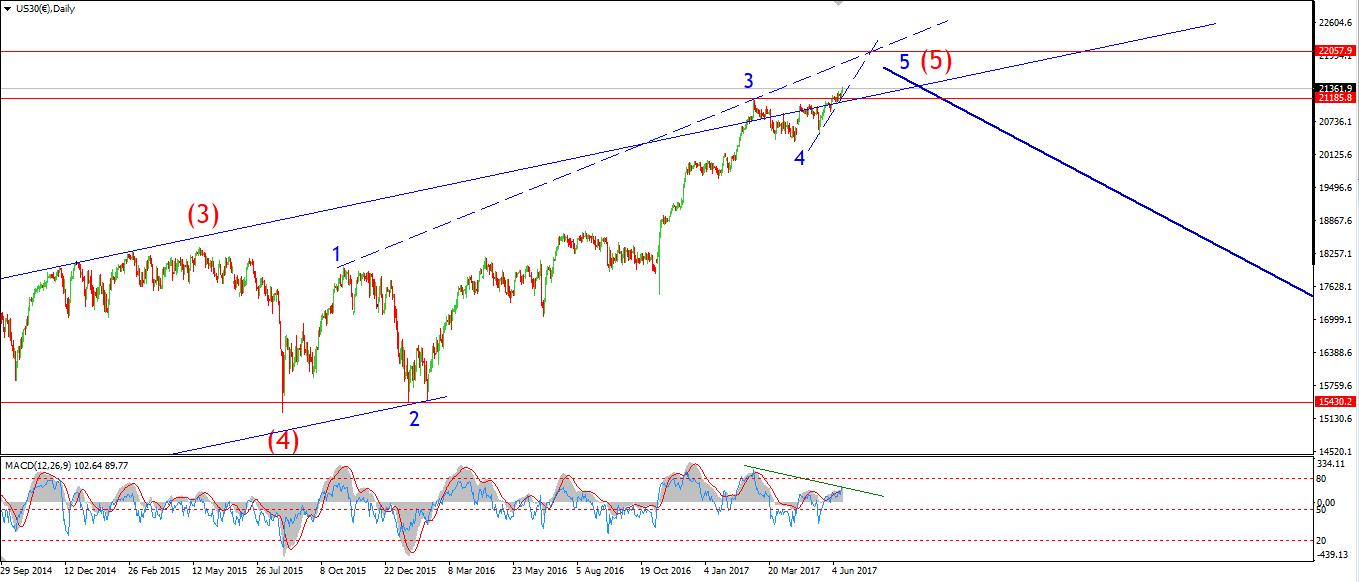 [/vc_column_text][/vc_column][/vc_row][vc_row][vc_column][vc_column_text]My Bias: market topping process ongoing
Wave Structure: Impulsive 5 wave structure, possibly topping in an all time high.
Long term wave count: Topping in wave (5)
Important risk events: USD: Personal Spending m/m, Chicago PMI.
The DOW got absolutely slammed today!
Last nights wave count was bang on calling the rise a flat correction in wave (ii) grey.
At the time of last nights update the price stood at 21479, the high reached 21502.
And the market dropped to a low of 21195 today.
The decline looks very impulsive and it counts well as a five wave decline.
Now we need to see a three wave corrective recovery to a lower high.
It is a common occurrence for air pockets to appear near the top of a market, and todays action fits that picture.
So yet again we get another sign that this market is on shaky ground.
For tomorrow watch for that three wave recovery in a possible wave ‘ii’ pink.[/vc_column_text][/vc_column][/vc_row][vc_row][vc_column][vc_separator][/vc_column][/vc_row][vc_row][vc_column][vc_column_text]
GOLD
[/vc_column_text][/vc_column][/vc_row][vc_row][vc_column][vc_separator][/vc_column][/vc_row][vc_row][vc_column width=”2/3″][vc_custom_heading text=”30 min” use_theme_fonts=”yes”][vc_column_text]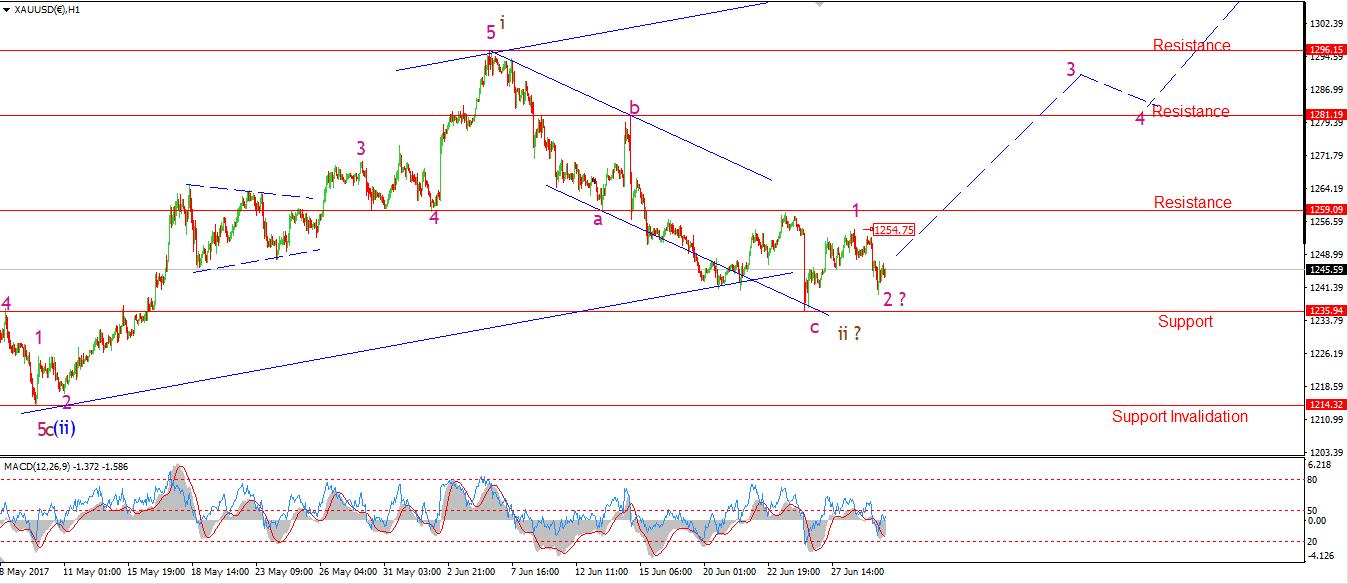 [/vc_column_text][/vc_column][vc_column width=”1/3″][vc_custom_heading text=”4 Hours” use_theme_fonts=”yes”][vc_column_text]
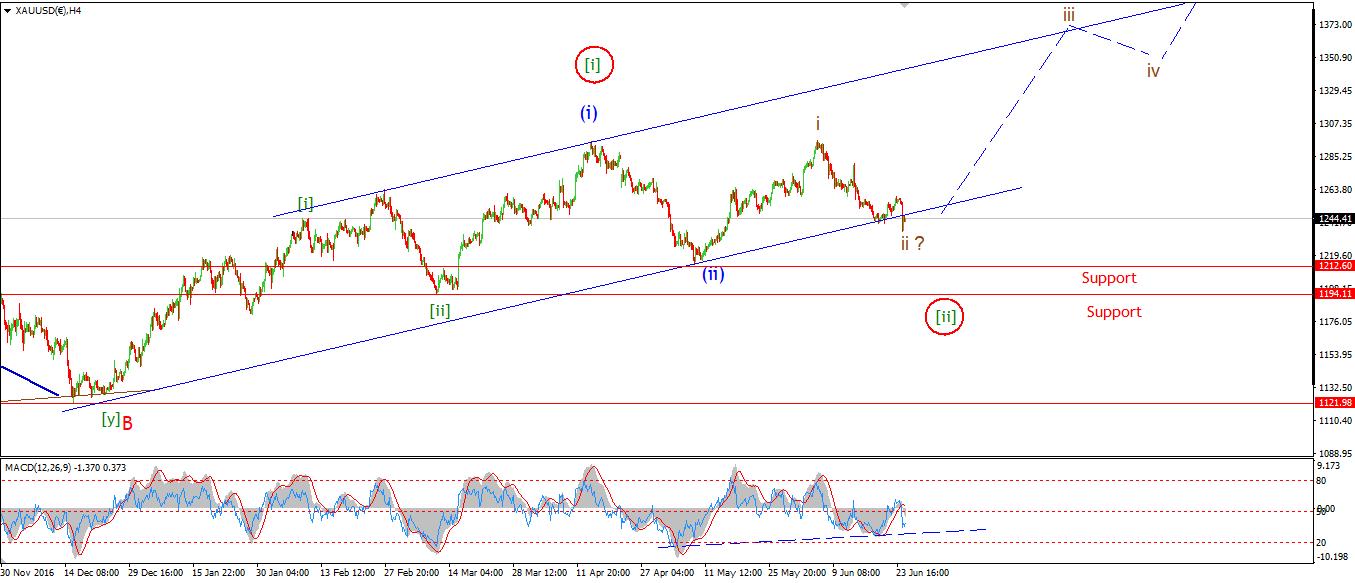 [/vc_column_text][vc_custom_heading text=”Daily” use_theme_fonts=”yes”][vc_column_text]
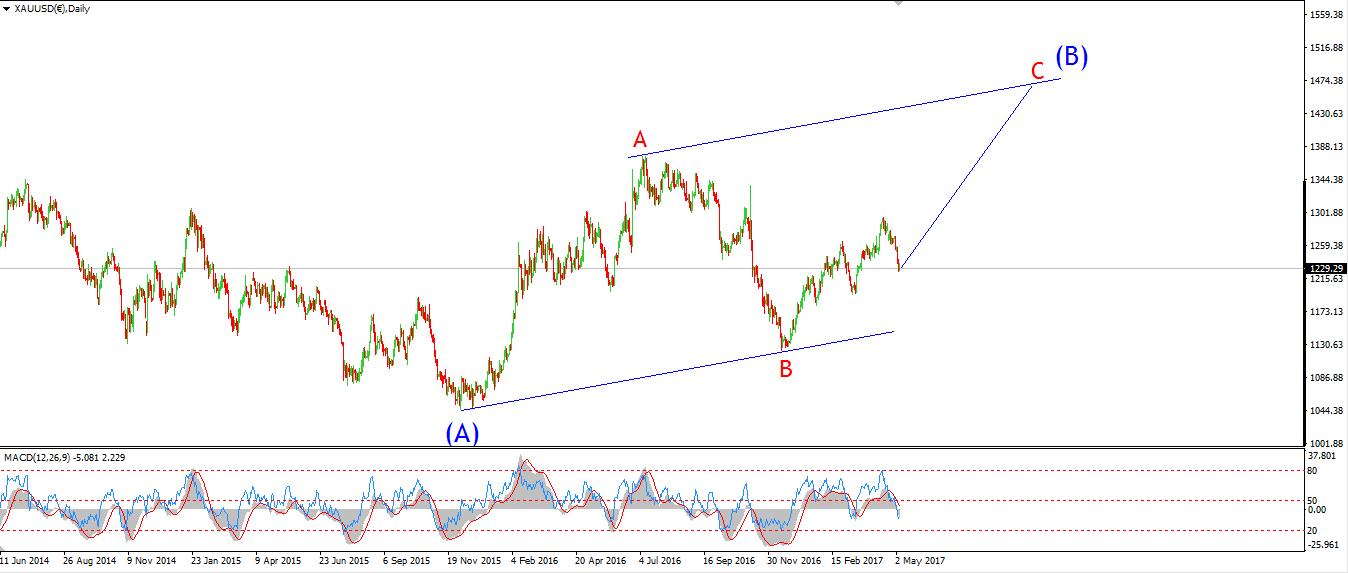 [/vc_column_text][/vc_column][/vc_row][vc_row][vc_column][vc_column_text]My Bias: Long towards 1550
Wave Structure: ZigZag correction to the upside.
Long term wave count: Topping in wave (B) at 1550
Important risk events: USD: Personal Spending m/m, Chicago PMI.
GOLD now displays another Elliott wave buy signal off the recent low at 1235.94.
The rise is in a five wave form and the decline has traced out three waves into todays low.
So for this evening the price has popped higher and the lows remain intact.
Initial resistance lies at 1259 and a break of that level will be another bullish signal.
But;
Today’s high lies at 1254.75, and a break of that level will signal wave ‘3’ pink has begun.
For the next few days it is important for GOLD to begin setting higher lows in an effort to kickoff the next bull run.[/vc_column_text][/vc_column][/vc_row]