
[vc_row][vc_column][vc_separator border_width=”5″][/vc_column][/vc_row][vc_row][vc_column][vc_column_text]
Good evening to one and all.
I hope you all survived the weekend in good shape.
We have reached september the 11th,
I can’t help but remember that day 16 years ago
when so many innocent people died in that horrific attack in New York city.
The world changed that day, and not for the better.
But,
I am a firm believer in the fact that through our own daily actions.
We can reshape the world around us to make it better.
I find it is a constant battle,
to aim to be a better version of myself in everything I do,
But there is the ever-present challenge in life!
And taking up this challenge is the only way this world will improve at all.
Down to business.[/vc_column_text][/vc_column][/vc_row]
[_s2If current_user_can(access_s2member_ccap_eurusd)]
[vc_row][vc_column][vc_separator border_width=”5″][/vc_column][/vc_row][vc_row][vc_column][vc_column_text]
EURUSD
[/vc_column_text][/vc_column][/vc_row][vc_row][vc_column][vc_separator border_width=”5″][/vc_column][/vc_row][vc_row][vc_column width=”2/3″][vc_custom_heading text=”30 min” use_theme_fonts=”yes”][vc_column_text] [/vc_column_text][/vc_column][vc_column width=”1/3″][vc_custom_heading text=”4 Hours” use_theme_fonts=”yes”][vc_column_text]
 [/vc_column_text][vc_custom_heading text=”Daily” use_theme_fonts=”yes”][vc_column_text]
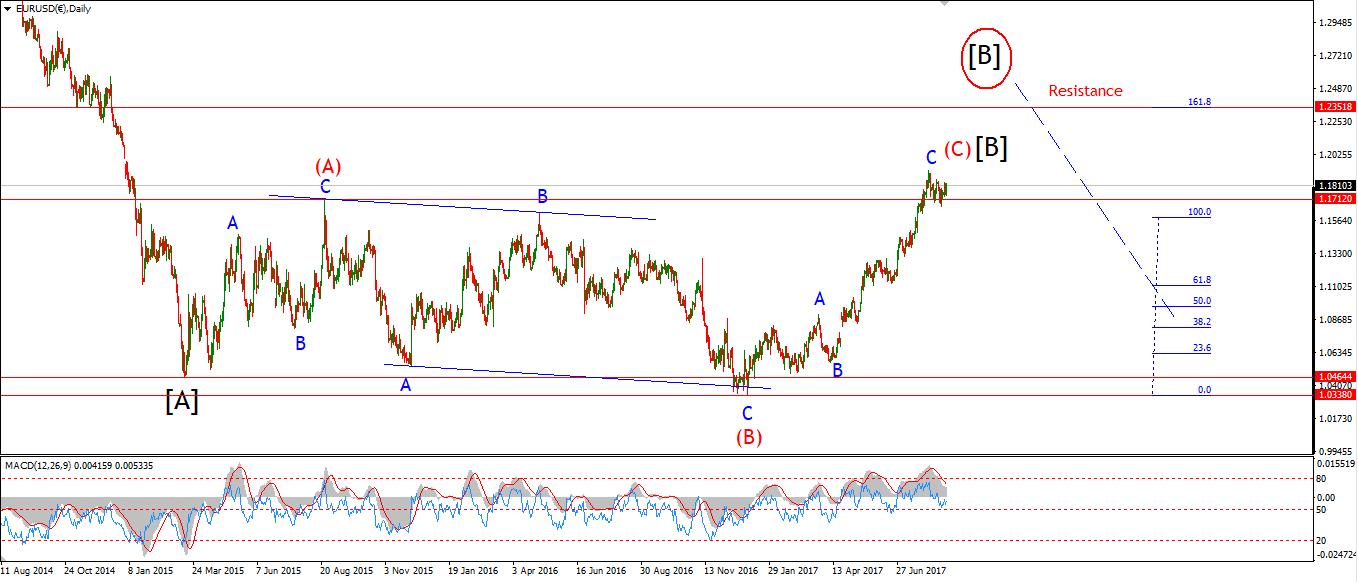 [/vc_column_text][/vc_column][/vc_row][vc_row][vc_column][vc_column_text]My Bias: long term bearish
Wave Structure: downward impulse wave
Long term wave count: lower in wave (3) red
Important risk events: EUR: N/A. USD: JOLTS Job Openings.
The price range contraction continued today in EURUSD.
The price has declined off Fridays high in three waves.
This price action has increased the odd’s for a contracting triangle wave ‘iv’ pink.
Today’s decline is approaching the rising lower trendline.
It would meet that trendline at about 1.1935.
The triangle should continue to contract in waves ‘d’ and ‘e’.
For tomorrow;
Watch for a reaction higher in wave ‘d’ off the lower trendline.
Wave ‘d’ should remain below 1.2092.[/vc_column_text][/vc_column][/vc_row]
[/_s2If]
[_s2If current_user_can(access_s2member_ccap_gbpusd)]
[vc_row][vc_column][vc_separator border_width=”5″][/vc_column][/vc_row][vc_row][vc_column][vc_column_text]
GBPUSD
[/vc_column_text][/vc_column][/vc_row][vc_row][vc_column][vc_separator border_width=”5″][/vc_column][/vc_row][vc_row][vc_column width=”2/3″][vc_custom_heading text=”30 min” use_theme_fonts=”yes”][vc_column_text] [/vc_column_text][/vc_column][vc_column width=”1/3″][vc_custom_heading text=”4 Hours” use_theme_fonts=”yes”][vc_column_text]
 [/vc_column_text][vc_custom_heading text=”Daily” use_theme_fonts=”yes”][vc_column_text]
 [/vc_column_text][/vc_column][/vc_row][vc_row][vc_column][vc_column_text]My Bias: short below parity in wave (5).
Wave Structure: continuing impulsive structure to the downside in wave (5)
Long term wave count: decline in wave (5) blue, below parity
Important risk events: GBP: CPI y/y, PPI Input m/m, RPI y/y. USD: JOLTS Job Openings.
Cable remained flat on the day and the price has not broken resistance at 1.3268 just yet.
The price action in the short term looks more like a minor correction,
Rather than a top in wave (c) brown.
So resistance at 1.3268 is critical at the moment.
On the 4hr chart I have shown an alternate wave count which would allow for a further rise into 1.3550 to complete wave (4).
This is based on a running flat wave ‘B’ red shown circled in red.
And then a triple combination wave structure to form the rally in wave ‘C’ red.
If the price breaks 1.3268,
Then I will switch to the alternate wave count.
The larger picture remains the same,
once wave (4) completes, this market is going to fall hard.
For tomorrow;
Watch that resistance at 1.3268.[/vc_column_text][/vc_column][/vc_row]
[/_s2If]
[_s2If current_user_can(access_s2member_ccap_usdjpy)]
[vc_row][vc_column][vc_separator border_width=”5″][/vc_column][/vc_row][vc_row][vc_column][vc_column_text]
USDJPY
[/vc_column_text][/vc_column][/vc_row][vc_row][vc_column][vc_separator border_width=”5″][/vc_column][/vc_row][vc_row][vc_column width=”2/3″][vc_custom_heading text=”30 min” use_theme_fonts=”yes”][vc_column_text] [/vc_column_text][/vc_column][vc_column width=”1/3″][vc_custom_heading text=”4 Hours” use_theme_fonts=”yes”][vc_column_text]
 [/vc_column_text][vc_custom_heading text=”Daily” use_theme_fonts=”yes”][vc_column_text]
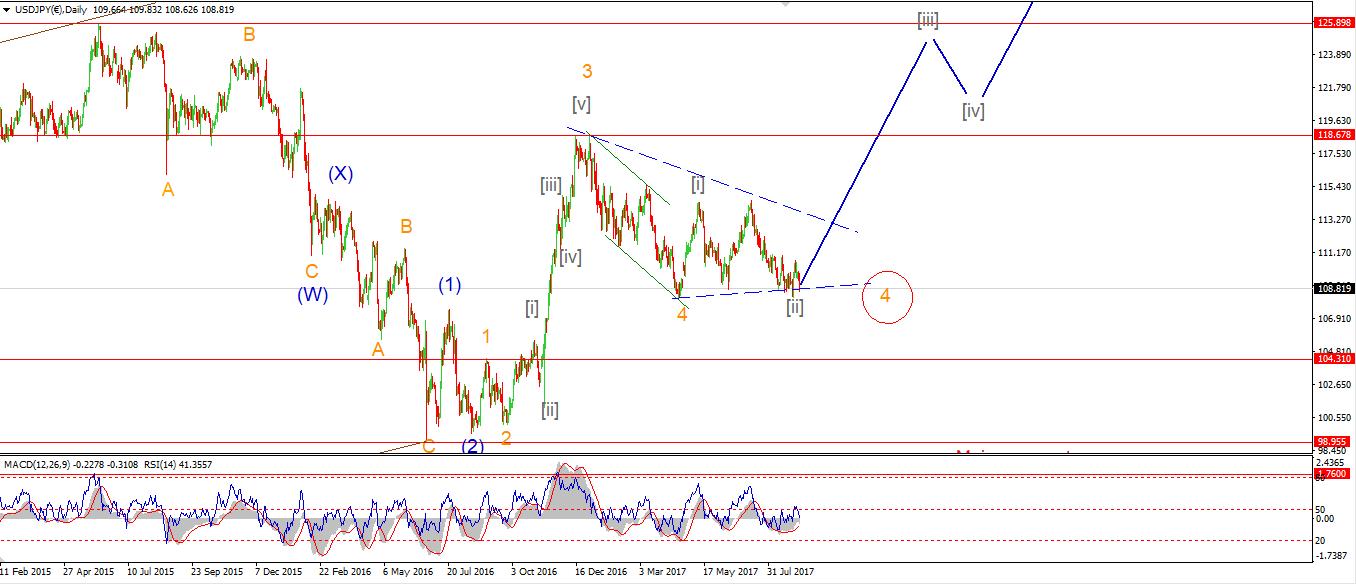 [/vc_column_text][/vc_column][/vc_row][vc_row][vc_column][vc_column_text]My Bias: LONG
Wave Structure: rally in wave [C]
Long term wave count: wave [C] is underway, upside to above 136.00
Important risk events: JPY: N/A. USD: JOLTS Job Openings.
USDJPY put in a serious rally today which has all the hallmarks of an impulse wave.
I can see a clear five wave pattern in the structure.
which fits nicely within a trend channel.
If the price creates a three wave decline off the highs of wave ‘i’ brown,
we will again be looking at a possible bullish Elliott wave signal.
The first resistance level lies at 109.83,
This initial impulse wave will encounter some resistance at that point.
107.35 forms the invalidation low for this interpretation.
For tomorrow;
I will be looking for this rally to top out and a corrective decline to begin in a possible wave ‘ii’.[/vc_column_text][/vc_column][/vc_row]
[/_s2If]
[_s2If current_user_can(access_s2member_ccap_dow_jones)]
[vc_row][vc_column][vc_separator][/vc_column][/vc_row][vc_row][vc_column][vc_column_text]
DOW JONES INDUSTRIALS
[/vc_column_text][/vc_column][/vc_row][vc_row][vc_column][vc_separator][/vc_column][/vc_row][vc_row][vc_column width=”2/3″][vc_custom_heading text=”30 min” use_theme_fonts=”yes”][vc_column_text] [/vc_column_text][/vc_column][vc_column width=”1/3″][vc_custom_heading text=”4 Hours” use_theme_fonts=”yes”][vc_column_text]
 [/vc_column_text][vc_custom_heading text=”Daily” use_theme_fonts=”yes”][vc_column_text]
 [/vc_column_text][/vc_column][/vc_row][vc_row][vc_column][vc_column_text]My Bias: market topping process ongoing
Wave Structure: Impulsive 5 wave structure, possibly topping in an all time high.
Long term wave count: Possibly topped in wave (5)
Important risk events: USD: JOLTS Job Openings.
The DOW impressed again today and broke resistance at 22038.
It is now a 50%/50% split between the current wave count and the alternate count, shown in the alternate wave count.
The alternate wave count is shown on the 4hr chart
It views the recent sideways action as a contracting triangle wave (iv) grey.
Which has just completed, and wave (v) grey has just begun.
The alternate wave count projects an initial target in wave (v) at about 22415.
Where wave (i) grey and wave (v) grey reach equality.
Price would meet the upper trendline again at about 22750.
If the price breaks the all time high at 21179,
It will trigger the alternate wave count.
This market remains on a knife edge.
A new all time high will simply postpone the inevitable bear market decline for a few weeks.
Not eliminate it!
I still urge everyone to review their investment stance,
You should not be heavily invested in stocks right now, under any circumstance.
There will come a time in a few years to be fully invested in stocks.
At that point – No one will want to touch them!
And I will be screaming buy,buy, buy!
For the short term;
It will take a break of support at 21598 to reaffirm the immediatley bearish wave count.
I am leaning towards the alternate wave count at the moment.[/vc_column_text][/vc_column][/vc_row]
[/_s2If]
[_s2If current_user_can(access_s2member_ccap_gold)]
[vc_row][vc_column][vc_separator][/vc_column][/vc_row][vc_row][vc_column][vc_column_text]
GOLD
[/vc_column_text][/vc_column][/vc_row][vc_row][vc_column][vc_separator][/vc_column][/vc_row][vc_row][vc_column width=”2/3″][vc_custom_heading text=”30 min” use_theme_fonts=”yes”][vc_column_text] [/vc_column_text][/vc_column][vc_column width=”1/3″][vc_custom_heading text=”4 Hours” use_theme_fonts=”yes”][vc_column_text]
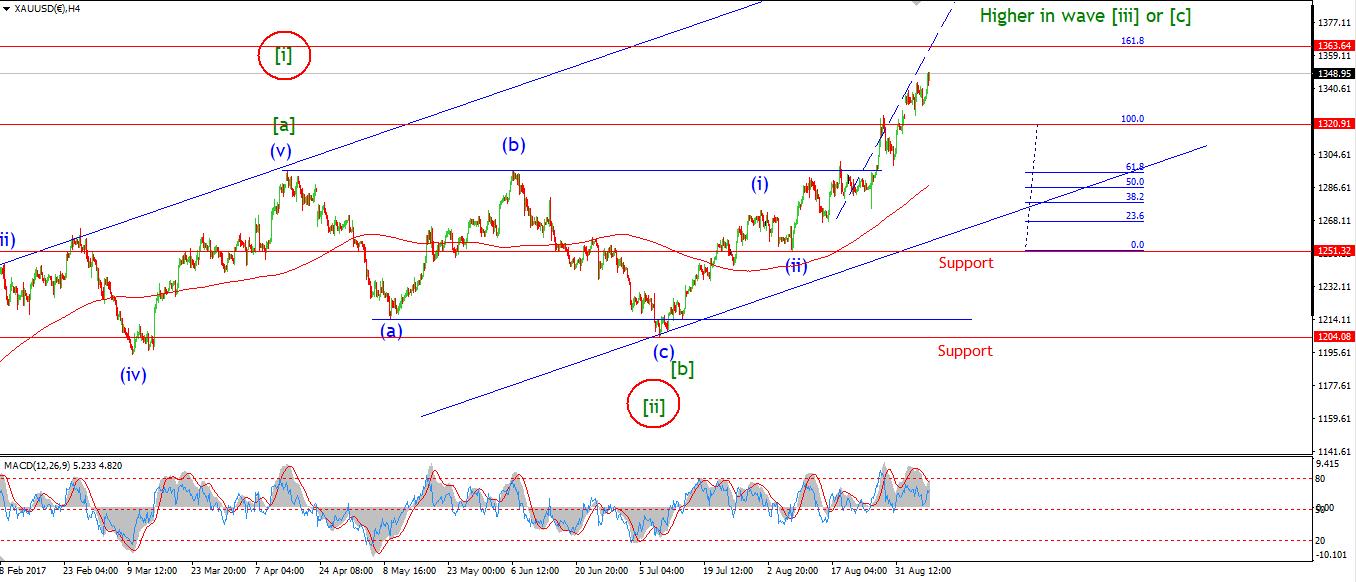 [/vc_column_text][vc_custom_heading text=”Daily” use_theme_fonts=”yes”][vc_column_text]
 [/vc_column_text][/vc_column][/vc_row][vc_row][vc_column][vc_column_text]My Bias: Long towards 1550
Wave Structure: ZigZag correction to the upside.
Long term wave count: Topping in wave (B) at 1550
Important risk events: USD: JOLTS Job Openings.
GOLD declined today and confirmed the alternate wave count with a break of 1332.
Wave ‘iv’ brown has now completed an expanding flat correction,
And price is again approaching support at 1325.
Wave ‘v’ brown is left, and the target remains between 1363 and 1372.
That will complete a clear five wave pattern in wave (iii) blue.
In general we are entering another consolidation period in the GOLD market,
Once wave (iii) blue completes,
wave (iv) blue will drag the price back into the 1320 region again.
For the next few days I do expect the price will rebound to new highs in wave ‘v’ brown.
A break of the wave ‘b’ high will confirm wave ‘v’ is underway.[/vc_column_text][/vc_column][/vc_row]
[/_s2If]