
[vc_row][vc_column][vc_separator border_width=”5″][/vc_column][/vc_row][vc_row][vc_column][vc_column_text]Good evening my friends!
In the case of Elliott wave analysis.
The slightest of moves can change things in a big way!
That is the case for USDJPY this evening, after another break of support and another refusal to confirm the larger scale rally.
More on this later.[/vc_column_text][/vc_column][/vc_row]
[_s2If current_user_can(access_s2member_ccap_eurusd)]
[vc_row][vc_column][vc_separator border_width=”5″][/vc_column][/vc_row][vc_row][vc_column][vc_column_text]
EURUSD
[/vc_column_text][/vc_column][/vc_row][vc_row][vc_column][vc_separator border_width=”5″][/vc_column][/vc_row][vc_row][vc_column width=”2/3″][vc_custom_heading text=”30 min” use_theme_fonts=”yes”][vc_column_text] [/vc_column_text][/vc_column][vc_column width=”1/3″][vc_custom_heading text=”4 Hours” use_theme_fonts=”yes”][vc_column_text]
 [/vc_column_text][vc_custom_heading text=”Daily” use_theme_fonts=”yes”][vc_column_text]
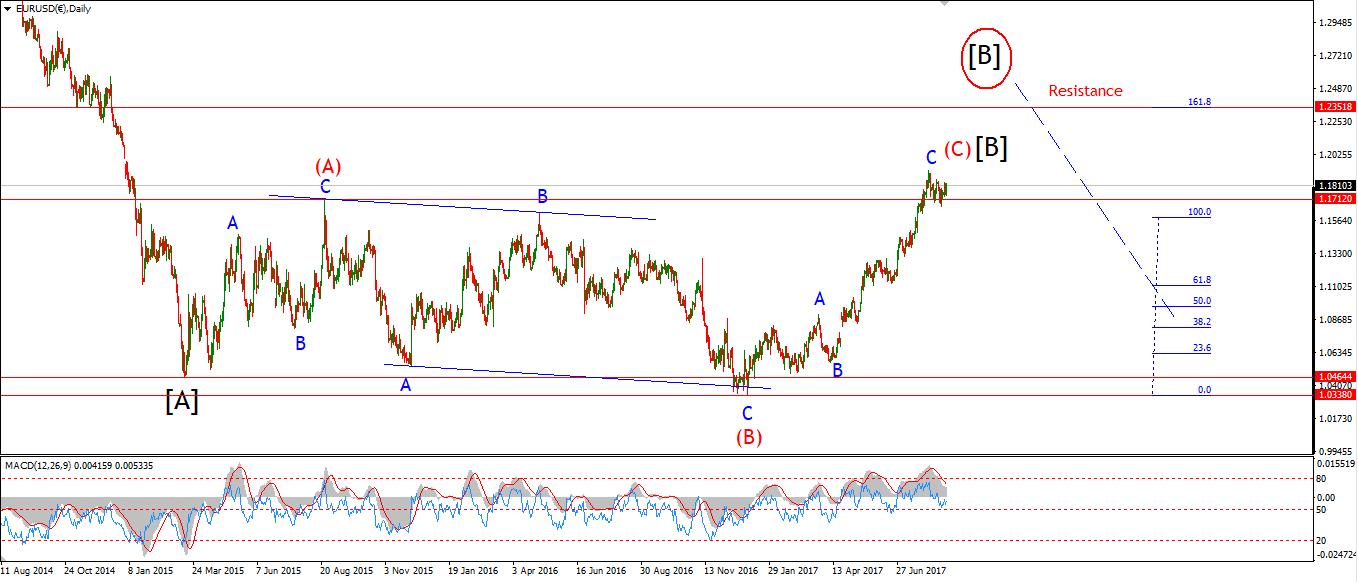 [/vc_column_text][/vc_column][/vc_row][vc_row][vc_column][vc_column_text]My Bias: long term bearish
Wave Structure: downward impulse wave
Long term wave count: lower in wave (3) red
Important risk events: EUR: N/A. USD: N/A.
EURUSD pushed the limits of the resistance but has not broken 1.2069 just yet.
There was a 120 point whipsaw movement this morning,
which caused a change in the labeling on the short term chart.
The decline off the high still counts best as a five wave structure.
The rise off 1.1822 is a messy affair!
I have shown a double combination with a contracting triangle wave ‘b’ pink as the best fit wave count.
For tomorrow;
Watch the high at 1.2069.
this level needs to hold,
lets see if we get another impulsive decline again tomorrow.[/vc_column_text][/vc_column][/vc_row]
[/_s2If]
[_s2If current_user_can(access_s2member_ccap_gbpusd)]
[vc_row][vc_column][vc_separator border_width=”5″][/vc_column][/vc_row][vc_row][vc_column][vc_column_text]
GBPUSD
[/vc_column_text][/vc_column][/vc_row][vc_row][vc_column][vc_separator border_width=”5″][/vc_column][/vc_row][vc_row][vc_column width=”2/3″][vc_custom_heading text=”30 min” use_theme_fonts=”yes”][vc_column_text] [/vc_column_text][/vc_column][vc_column width=”1/3″][vc_custom_heading text=”4 Hours” use_theme_fonts=”yes”][vc_column_text]
 [/vc_column_text][vc_custom_heading text=”Daily” use_theme_fonts=”yes”][vc_column_text]
 [/vc_column_text][/vc_column][/vc_row][vc_row][vc_column][vc_column_text]My Bias: short below parity in wave (5).
Wave Structure: continuing impulsive structure to the downside in wave (5)
Long term wave count: decline in wave (5) blue, below parity
Important risk events: GBP: Manufacturing Production m/m, Goods Trade Balance. USD: N/A.
The dollar decline extended into cable todays also.
The rise off 1.2774 still looks like a three wave structure and I have labelled it as such.
Wave [ii] green should top out soon to keep that three wave structure intact.
The interim high at wave (a) brown lies at 1.2979,
A decline below that high will confirm the end of the correction in wave [ii] green.
The 4hr chart shows a double top in RSI, which indicates that momentum is stalling.
For tomorrow;
watch for a return downwards in an impulsive fashion.
A lower high off wave [ii] green will create possible bearish signal.[/vc_column_text][/vc_column][/vc_row]
[/_s2If]
[_s2If current_user_can(access_s2member_ccap_usdjpy)]
[vc_row][vc_column][vc_separator border_width=”5″][/vc_column][/vc_row][vc_row][vc_column][vc_column_text]
USDJPY
[/vc_column_text][/vc_column][/vc_row][vc_row][vc_column][vc_separator border_width=”5″][/vc_column][/vc_row][vc_row][vc_column width=”2/3″][vc_custom_heading text=”30 min” use_theme_fonts=”yes”][vc_column_text] [/vc_column_text][/vc_column][vc_column width=”1/3″][vc_custom_heading text=”4 Hours” use_theme_fonts=”yes”][vc_column_text]
 [/vc_column_text][vc_custom_heading text=”Daily” use_theme_fonts=”yes”][vc_column_text]
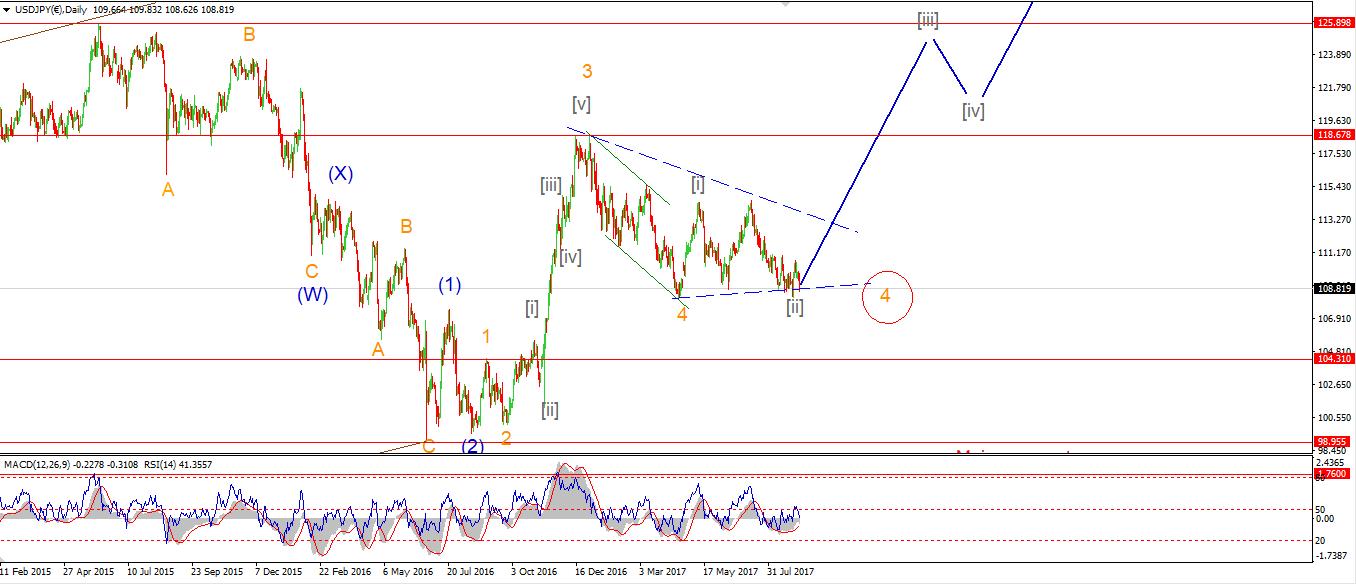 [/vc_column_text][/vc_column][/vc_row][vc_row][vc_column][vc_column_text]My Bias: LONG
Wave Structure: rally in wave [C]
Long term wave count: wave [C] is underway, upside to above 136.00
Important risk events: JPY: N/A. USD: N/A.
USDJPY – the market that will always disappoint you!
I have taken a wide angle view of the market today in order to re-orientate myself in this endless corrective phase.
No matter what way I look at the decline off the 118.63 high,
All I can see is a correction in process.
There are a few different ways to interpret this correction
but none the less, a corrective decline it remains.
I have shown a revised wave count in wave ‘4’ orange off that 118 high
This structure is a triple combination wave.
It has been a pain in the rear to follow of late,
But the wave count shown above does account for the action quite well.
The current decline over the summer is now labelled wave [c] grey.
It will trace out three waves as shown,
The price is now entering a zone of major support
with three significant levels in a cluster.
The daily chart shows 106.55 as the 61.8% retracement level of the whole rise into 118.63.
This is the most interesting level for the completion of wave [c] grey.
But the current momentum situation looks pretty bullish across the board.
So the price may not even get that far.
For the next week the game plan remains the same.
Watch for a completion of the larger pattern.
And the creation of another bullish signal.
This correction will finish soon.
When it does, I think the rally will be spectacular.[/vc_column_text][/vc_column][/vc_row]
[/_s2If]
[_s2If current_user_can(access_s2member_ccap_dow_jones)]
[vc_row][vc_column][vc_separator][/vc_column][/vc_row][vc_row][vc_column][vc_column_text]
DOW JONES INDUSTRIALS
[/vc_column_text][/vc_column][/vc_row][vc_row][vc_column][vc_separator][/vc_column][/vc_row][vc_row][vc_column width=”2/3″][vc_custom_heading text=”30 min” use_theme_fonts=”yes”][vc_column_text] [/vc_column_text][/vc_column][vc_column width=”1/3″][vc_custom_heading text=”4 Hours” use_theme_fonts=”yes”][vc_column_text]
 [/vc_column_text][vc_custom_heading text=”Daily” use_theme_fonts=”yes”][vc_column_text]
 [/vc_column_text][/vc_column][/vc_row][vc_row][vc_column][vc_column_text]My Bias: market topping process ongoing
Wave Structure: Impulsive 5 wave structure, possibly topping in an all time high.
Long term wave count: Possibly topped in wave (5)
Important risk events: USD: N/A.
The DOW has remained flat on the day
after the possible completion of wave ‘4’ blue.
The current decline can be viewed in a couple of different configurations,
but I think the idea of an extending wave ‘iii’ pink to the downside fits well so far.
Wave ‘iii’ pink has so far traced out four internal waves,
Wave ‘5’ blue should take the price into support at 21598 to complete.
The price must begin an acceleration to the downside soon in order to salvage the five wave structure.
For tomorrow;
Watch for the high at 21847, wave ‘4’ blue, to hold.
a break of the wave ‘3’ low at 21706 will confirm wave ‘5’ has begun.[/vc_column_text][/vc_column][/vc_row]
[/_s2If]
[_s2If current_user_can(access_s2member_ccap_gold)]
[vc_row][vc_column][vc_separator][/vc_column][/vc_row][vc_row][vc_column][vc_column_text]
GOLD
[/vc_column_text][/vc_column][/vc_row][vc_row][vc_column][vc_separator][/vc_column][/vc_row][vc_row][vc_column width=”2/3″][vc_custom_heading text=”30 min” use_theme_fonts=”yes”][vc_column_text] [/vc_column_text][/vc_column][vc_column width=”1/3″][vc_custom_heading text=”4 Hours” use_theme_fonts=”yes”][vc_column_text]
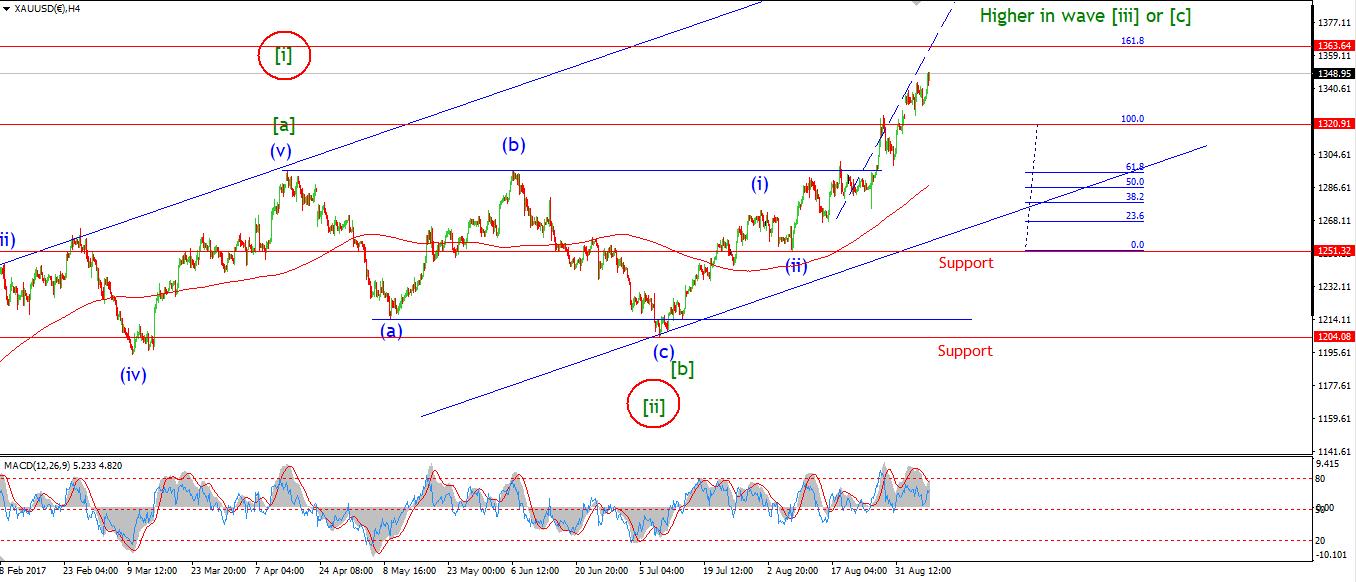 [/vc_column_text][vc_custom_heading text=”Daily” use_theme_fonts=”yes”][vc_column_text]
 [/vc_column_text][/vc_column][/vc_row][vc_row][vc_column][vc_column_text]My Bias: Long towards 1550
Wave Structure: ZigZag correction to the upside.
Long term wave count: Topping in wave (B) at 1550
Important risk events: USD: N/A.
GOLD may have completed a short wave ‘iv’ brown after todays impulsive rally.
The price again broke to new highs at 1349.10 in the cash market.
There is a chance that wave ‘iv’ may still complete a larger expanded flat correction.
Although the structure of todays rally does not point to that.
So for now we can call wave ‘v’ brown as underway.
This should trace out another five wave rally as illustrated.
There are two valid targets for wave (iii) blue to complete.
On the 4hr chart I have shown the Fibonacci extension which projects a high at 1363.
The short term chart shows a target for wave (iii) to complete is at 1372.
Where the 261.8% projection of wave ‘i’ brown from the wave ‘ii’ low lies.
So we have a nice tight range of targets to look for.
For tomorrow;
Watch for the low at wave ‘iv’ to hold
and a possible minor correction in wave ‘2’ pink.[/vc_column_text][/vc_column][/vc_row]
[/_s2If]