
[vc_row][vc_column][vc_separator border_width=”5″][/vc_column][/vc_row][vc_row][vc_column][vc_column_text]Evening Y’all!
There has been some interesting action over the last few hours accross the markets!
That critical point has been reached in some of the markets I follow.
Lets dive right in.
Life is short and there is not a moment to lose![/vc_column_text][/vc_column][/vc_row]
[_s2If current_user_can(access_s2member_ccap_eurusd)]
[vc_row][vc_column][vc_separator border_width=”5″][/vc_column][/vc_row][vc_row][vc_column][vc_column_text]
EURUSD
[/vc_column_text][/vc_column][/vc_row][vc_row][vc_column][vc_separator border_width=”5″][/vc_column][/vc_row][vc_row][vc_column width=”2/3″][vc_custom_heading text=”30 min” use_theme_fonts=”yes”][vc_column_text] [/vc_column_text][/vc_column][vc_column width=”1/3″][vc_custom_heading text=”4 Hours” use_theme_fonts=”yes”][vc_column_text]
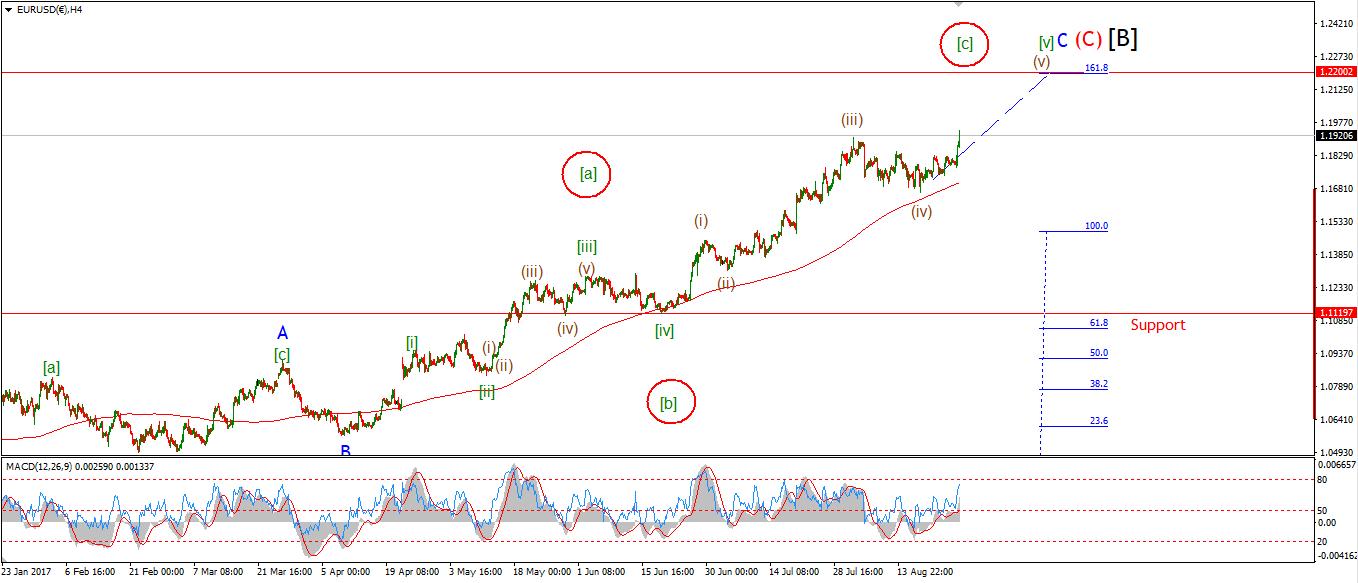 [/vc_column_text][vc_custom_heading text=”Daily” use_theme_fonts=”yes”][vc_column_text]
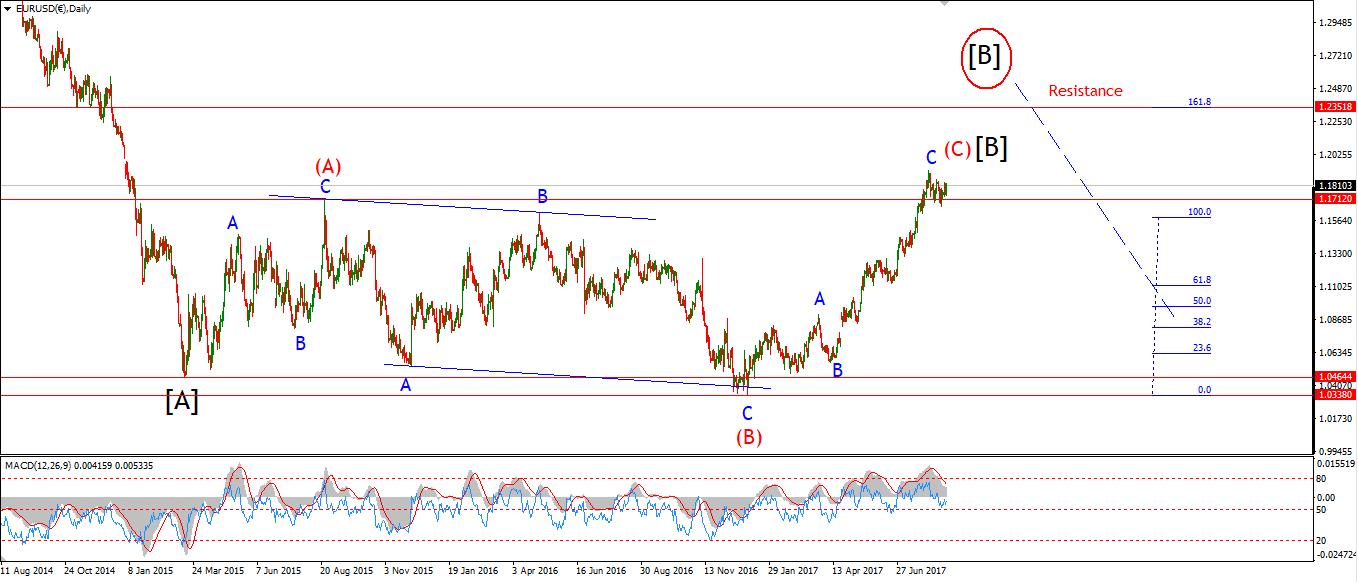 [/vc_column_text][/vc_column][/vc_row][vc_row][vc_column][vc_column_text]My Bias: long term bearish
Wave Structure: downward impulse wave
Long term wave count: lower in wave (3) red
Important risk events: EUR: N/A. USD: Trade Balance, ISM Non-Manufacturing PMI.
EURUSD barely fluttered today,
Given the sharp rally in GBPUSD,
I would have expect something similar to occur in EURUSD.
The lack of action has led me to switch the short term wave count to the alternate view.
the current wave count shows a decline off the recent high in wave ‘i’ pink.
Wave ‘ii’ is in three waves,
And wave ‘iii’ down may be underway as I write.
The sideways price action this week suggests a correction in wave ‘2’ grey.
If this wave count is correct,
Then we can expect a decline in wave ‘3’ grey to occur over the next couple of sessions.
For tomorrow;
The initial resistance at 1.1979 must hold
A decline below 1.1822, at wave ‘i’ will signal that wave ‘iii’ pink has begun.[/vc_column_text][/vc_column][/vc_row]
[/_s2If]
[_s2If current_user_can(access_s2member_ccap_gbpusd)]
[vc_row][vc_column][vc_separator border_width=”5″][/vc_column][/vc_row][vc_row][vc_column][vc_column_text]
GBPUSD
[/vc_column_text][/vc_column][/vc_row][vc_row][vc_column][vc_separator border_width=”5″][/vc_column][/vc_row][vc_row][vc_column width=”2/3″][vc_custom_heading text=”30 min” use_theme_fonts=”yes”][vc_column_text] [/vc_column_text][/vc_column][vc_column width=”1/3″][vc_custom_heading text=”4 Hours” use_theme_fonts=”yes”][vc_column_text]
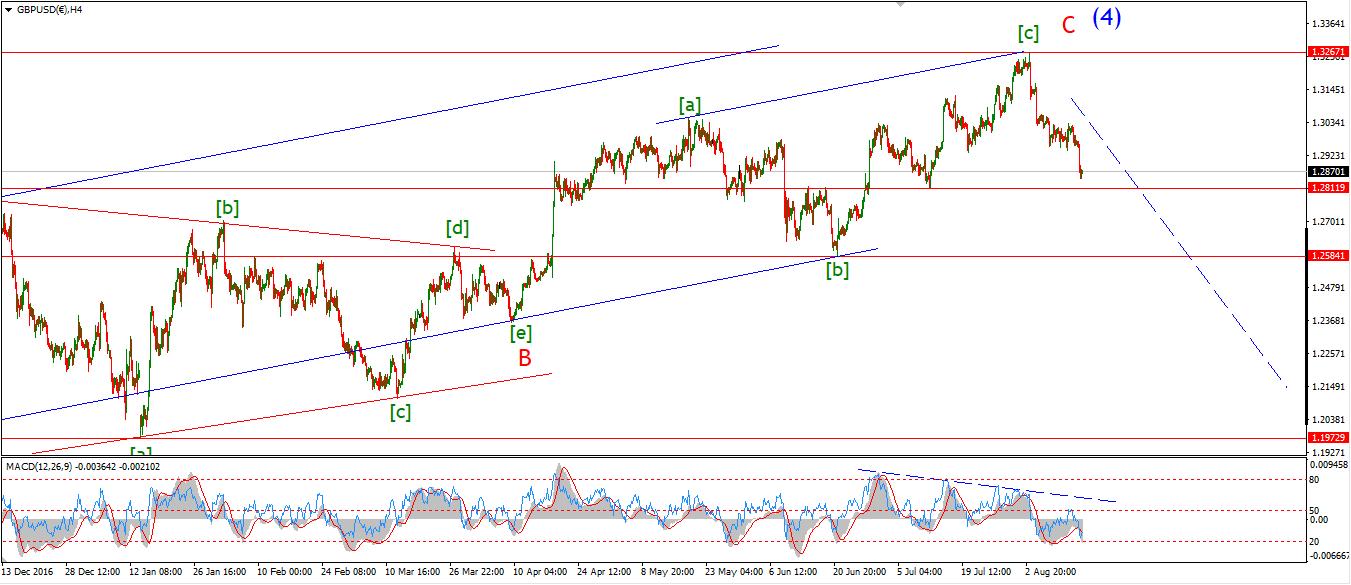 [/vc_column_text][vc_custom_heading text=”Daily” use_theme_fonts=”yes”][vc_column_text]
 [/vc_column_text][/vc_column][/vc_row][vc_row][vc_column][vc_column_text]My Bias: short below parity in wave (5).
Wave Structure: continuing impulsive structure to the downside in wave (5)
Long term wave count: decline in wave (5) blue, below parity
Important risk events: GBP: N/A. USD: Trade Balance, ISM Non-Manufacturing PMI.
The target for wave (c) to complete was set at 1.3057 and todays high reached 1.3042,
This rally has all but completed a three wave structure in wave [ii]
Todays rally brought the price above the 50% retracement level of wave [i].
The 61.8% retracement level lies at 1.3079.
At this point the price has completed an Elliott wave correction pattern,
It sits at trend channel resistance and an important Fib level.
So it is time to start looking for a reversal down into wave [iii] green.
For tomorrow;
Lets see the reaction to the 61.8% retracement level at 1.3079.
An impulsive decline,
Followed by a lower high will create an interesting opportunity.[/vc_column_text][/vc_column][/vc_row]
[/_s2If]
[_s2If current_user_can(access_s2member_ccap_usdjpy)]
[vc_row][vc_column][vc_separator border_width=”5″][/vc_column][/vc_row][vc_row][vc_column][vc_column_text]
USDJPY
[/vc_column_text][/vc_column][/vc_row][vc_row][vc_column][vc_separator border_width=”5″][/vc_column][/vc_row][vc_row][vc_column width=”2/3″][vc_custom_heading text=”30 min” use_theme_fonts=”yes”][vc_column_text] [/vc_column_text][/vc_column][vc_column width=”1/3″][vc_custom_heading text=”4 Hours” use_theme_fonts=”yes”][vc_column_text]
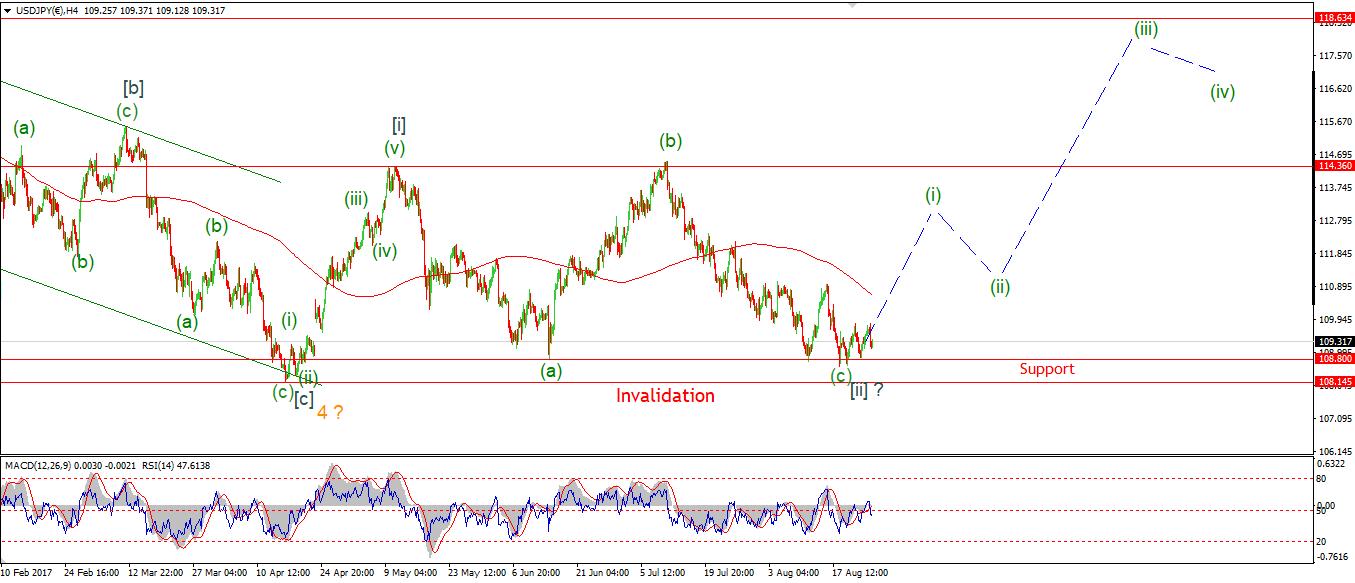 [/vc_column_text][vc_custom_heading text=”Daily” use_theme_fonts=”yes”][vc_column_text]
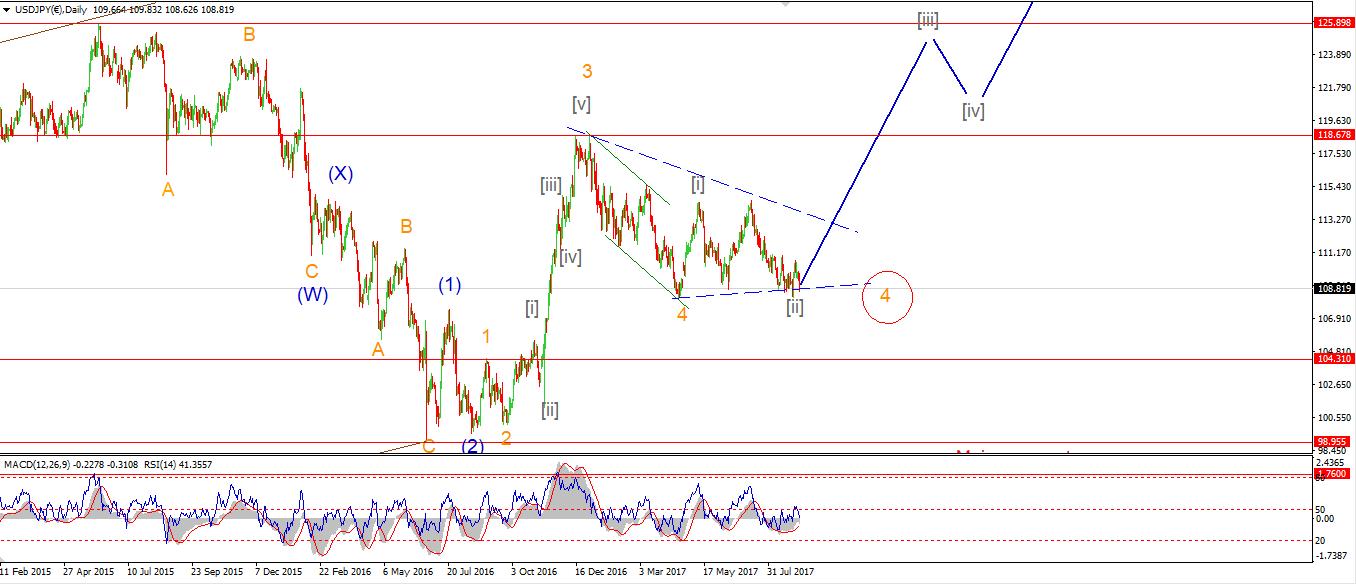 [/vc_column_text][/vc_column][/vc_row][vc_row][vc_column][vc_column_text]My Bias: LONG
Wave Structure: rally in wave [C]
Long term wave count: wave [C] is underway, upside to above 136.00
Important risk events: JPY: N/A. USD: Trade Balance, ISM Non-Manufacturing PMI.
My attention has been caught by the Daily MACD line today.
There is a solid upswing visible off the low which should be followed by a significant rally in wave [iii] grey.
I have updated the short term chart to show a developing rally at one higher degree.
Wave (i) green has now been followed by a very deep correction in wave (ii) green.
The declines must stop now for this bullish interpretation to remain valid.
For tomorrow;
Watch for 108.26 to hold.
If the price rallies above 109.55 tomorrow,
This will most likely be the beginning of wave (iii) green.[/vc_column_text][/vc_column][/vc_row]
[/_s2If]
[_s2If current_user_can(access_s2member_ccap_dow_jones)]
[vc_row][vc_column][vc_separator][/vc_column][/vc_row][vc_row][vc_column][vc_column_text]
DOW JONES INDUSTRIALS
[/vc_column_text][/vc_column][/vc_row][vc_row][vc_column][vc_separator][/vc_column][/vc_row][vc_row][vc_column width=”2/3″][vc_custom_heading text=”30 min” use_theme_fonts=”yes”][vc_column_text] [/vc_column_text][/vc_column][vc_column width=”1/3″][vc_custom_heading text=”4 Hours” use_theme_fonts=”yes”][vc_column_text]
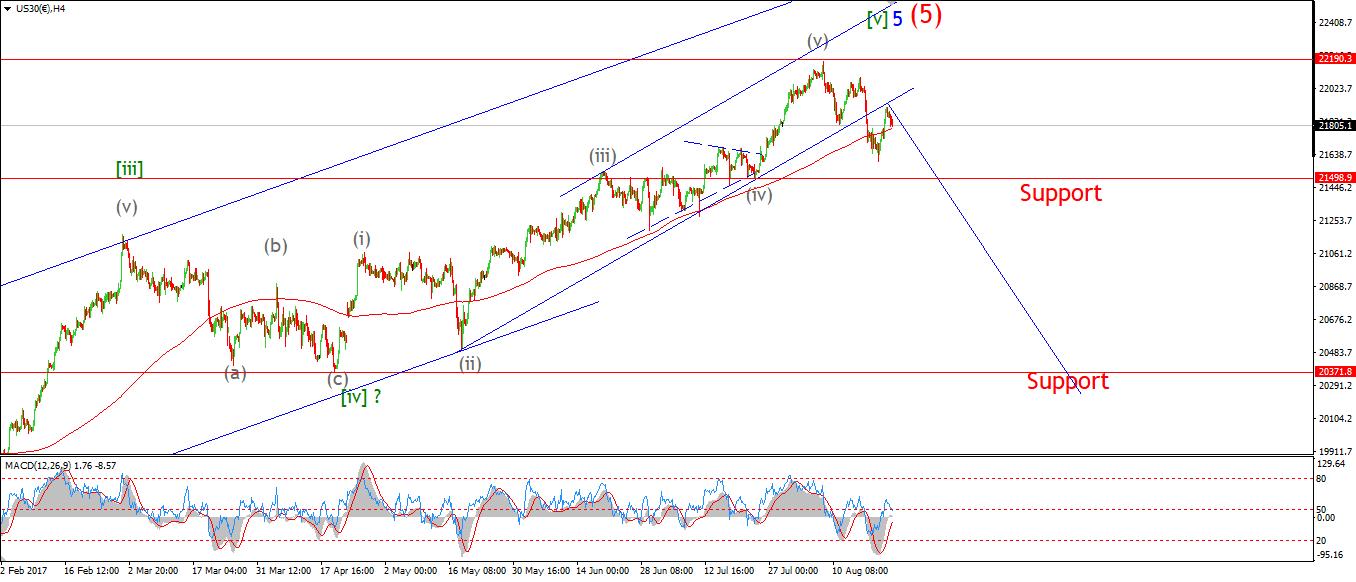 [/vc_column_text][vc_custom_heading text=”Daily” use_theme_fonts=”yes”][vc_column_text]
 [/vc_column_text][/vc_column][/vc_row][vc_row][vc_column][vc_column_text]My Bias: market topping process ongoing
Wave Structure: Impulsive 5 wave structure, possibly topping in an all time high.
Long term wave count: Possibly topped in wave (5)
Important risk events: USD: Trade Balance, ISM Non-Manufacturing PMI.
The DOW reacted badly today to Fridays sell-off.
The wave count was calling for a drop, and the market followed.
There is a very real possibility that wave ‘iii’ pink has now begun to the downside.
The wave count has been updated to show a possible decline phase in wave ‘iii’ of (iii) of [iii] underway.
This wave setup brings with it the possibility of a very large acceleration to the downside.
The low at wave (i) grey lies at 21600 (cash)
If this level breaks it will confirm the larger bearish wave count and a decline in wave (iii) grey should accelerate.
The initial target for wave (iii) grey lies at 21250,
The 161.8% Fibonacci extention of wave (i).
For tomorrow;
Watch for a the low at wave ‘i’ pink to hold,
Further declines below 21600 will confirm wave (iii).[/vc_column_text][/vc_column][/vc_row]
[/_s2If]
[_s2If current_user_can(access_s2member_ccap_gold)]
[vc_row][vc_column][vc_separator][/vc_column][/vc_row][vc_row][vc_column][vc_column_text]
GOLD
[/vc_column_text][/vc_column][/vc_row][vc_row][vc_column][vc_separator][/vc_column][/vc_row][vc_row][vc_column width=”2/3″][vc_custom_heading text=”30 min” use_theme_fonts=”yes”][vc_column_text] [/vc_column_text][/vc_column][vc_column width=”1/3″][vc_custom_heading text=”4 Hours” use_theme_fonts=”yes”][vc_column_text]
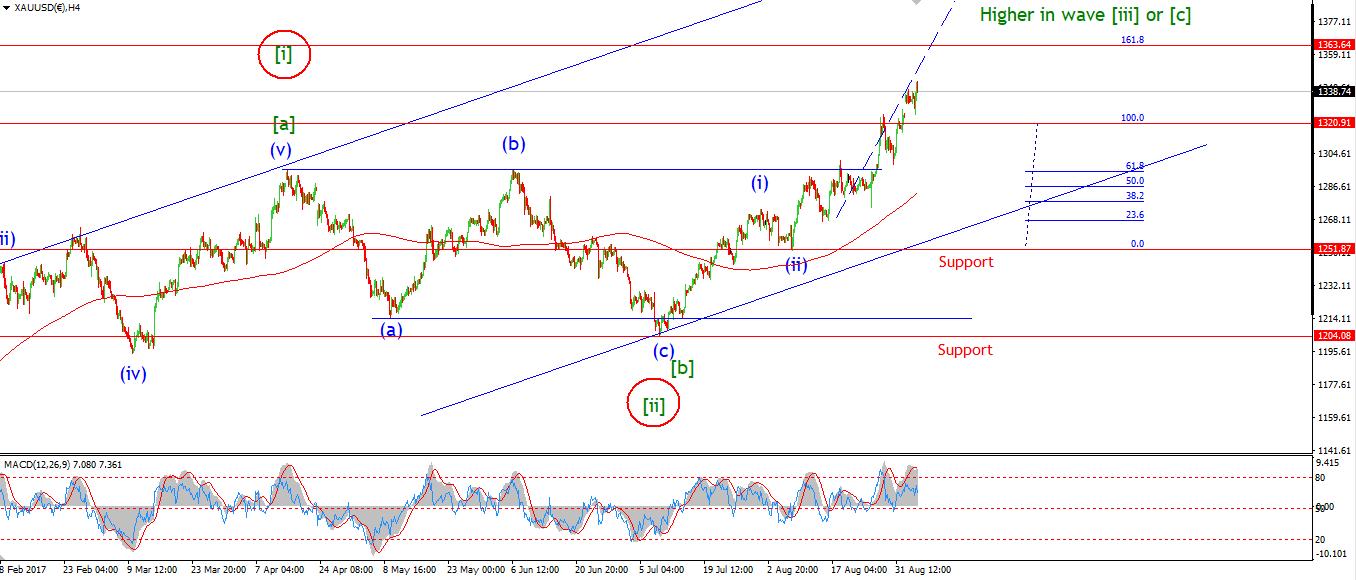 [/vc_column_text][vc_custom_heading text=”Daily” use_theme_fonts=”yes”][vc_column_text]
 [/vc_column_text][/vc_column][/vc_row][vc_row][vc_column][vc_column_text]My Bias: Long towards 1550
Wave Structure: ZigZag correction to the upside.
Long term wave count: Topping in wave (B) at 1550
Important risk events: USD: Trade Balance, ISM Non-Manufacturing PMI.
I was looking for a further rally today to close out wave ‘5’ pink.
And after a small decline this morning,
the market rallied again and topped out at 1343 so far today.
A tag of the upper trendline would cap off wave ‘iii’ brown nicely.
But at this point it is wise to look for a larger correction in wave ‘iv‘ brown to begin soon.
It is worth noting on the 4hr chart,
that wave (iii) blue is still projected to reach 1363 before completing.
So the correction in wave ‘iv’ brown will be followed by another rally in short order.
For tomorrow;
Watch for signs that wave ‘iii’ brown has completed
Wave ‘iv’ should carry the price lower into about 1320 again depending on the pattern.[/vc_column_text][/vc_column][/vc_row]
[/_s2If]