
[vc_row][vc_column][vc_separator border_width=”5″][/vc_column][/vc_row][vc_row][vc_column][vc_column_text]Good evening everyone from my cosy home facing the Atlantic seaboard.
I am home again,
after a day of hauling luggage and kids halfway across Europe,
I have to say, it is GOOOOOOOD to be back!
I have just arrived in the door at 23.00,
so you will forgive the shorter update this evening.
I might just fall asleep at the keyboard!
[/vc_column_text][/vc_column][/vc_row]
[_s2If current_user_can(access_s2member_ccap_eurusd)]
[vc_row][vc_column][vc_separator border_width=”5″][/vc_column][/vc_row][vc_row][vc_column][vc_column_text]
EURUSD
[/vc_column_text][/vc_column][/vc_row][vc_row][vc_column][vc_separator border_width=”5″][/vc_column][/vc_row][vc_row][vc_column width=”2/3″][vc_custom_heading text=”30 min” use_theme_fonts=”yes”][vc_column_text] [/vc_column_text][/vc_column][vc_column width=”1/3″][vc_custom_heading text=”4 Hours” use_theme_fonts=”yes”][vc_column_text]
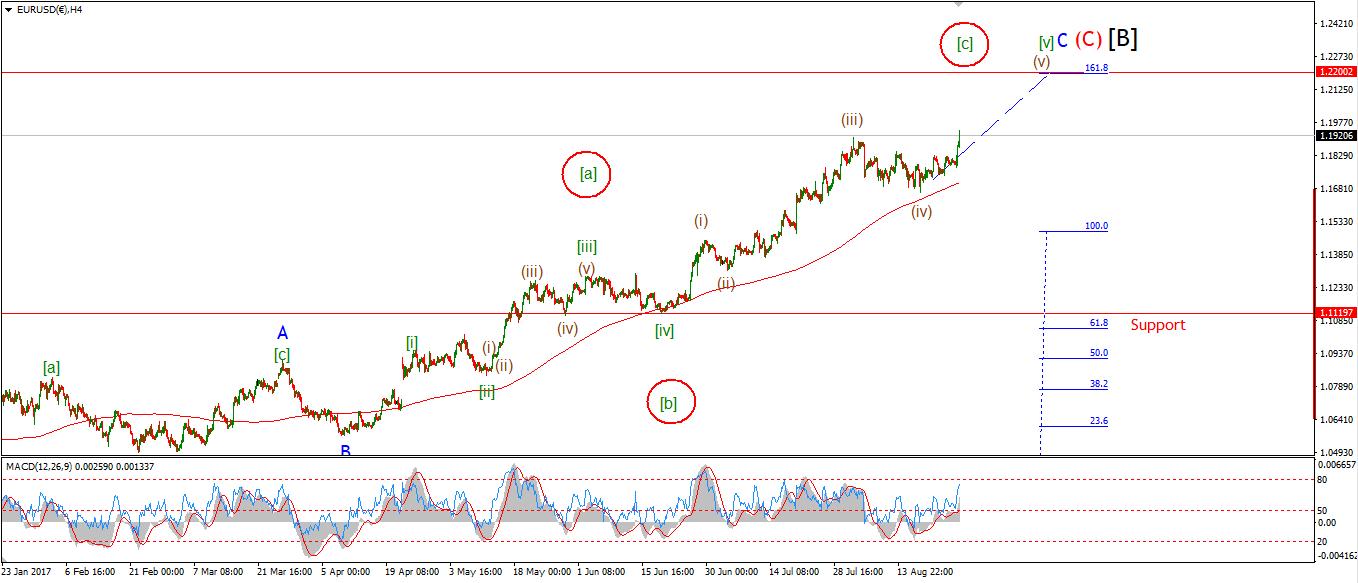 [/vc_column_text][vc_custom_heading text=”Daily” use_theme_fonts=”yes”][vc_column_text]
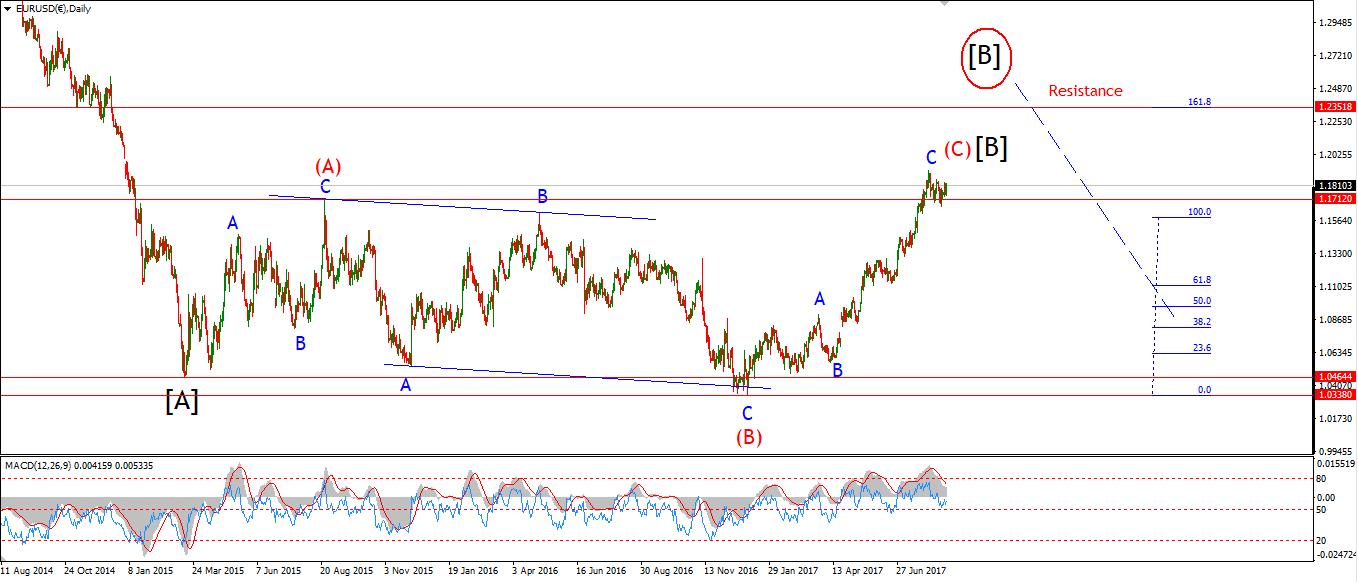 [/vc_column_text][/vc_column][/vc_row][vc_row][vc_column][vc_column_text]My Bias: long term bearish
Wave Structure: downward impulse wave
Long term wave count: lower in wave (3) red
Important risk events: EUR: N/A. USD: Factory Orders m/m. USD: Factory Orders m/m.
EURUSD seems to be at a crossroads right now.
The preferred wave count still calls for another run up to meet the upper trendline one last time.
But the recent heavy decline off the high is interesting,
The alternate view is that this market has now topped and we should be ready again for a larger turn down.
The key level to watch in this regard, is 1.1753.
Any break of that level will trigger the alternate wave count and switch the focus to the downside again.
For tomorrow;
Watch the low labelled wave ‘iv’ at 1.1822.
If that level fails to hold, it will be a sign that the market is beginning to turn.[/vc_column_text][/vc_column][/vc_row]
[/_s2If]
[_s2If current_user_can(access_s2member_ccap_gbpusd)]
[vc_row][vc_column][vc_separator border_width=”5″][/vc_column][/vc_row][vc_row][vc_column][vc_column_text]
GBPUSD
[/vc_column_text][/vc_column][/vc_row][vc_row][vc_column][vc_separator border_width=”5″][/vc_column][/vc_row][vc_row][vc_column width=”2/3″][vc_custom_heading text=”30 min” use_theme_fonts=”yes”][vc_column_text] [/vc_column_text][/vc_column][vc_column width=”1/3″][vc_custom_heading text=”4 Hours” use_theme_fonts=”yes”][vc_column_text]
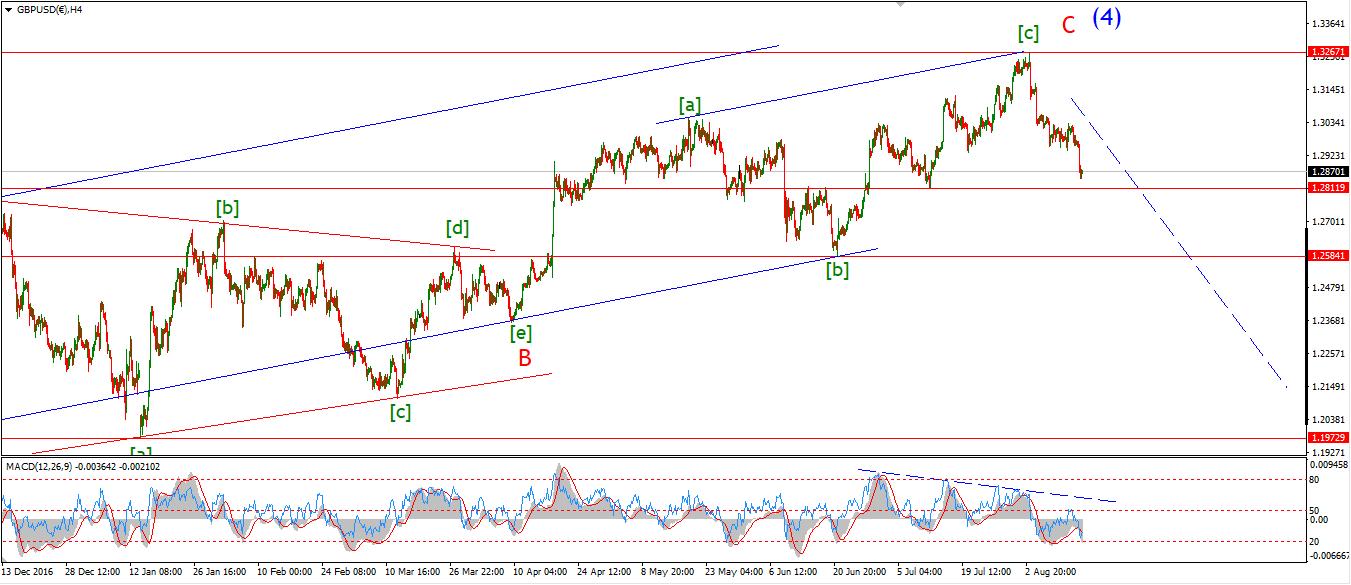 [/vc_column_text][vc_custom_heading text=”Daily” use_theme_fonts=”yes”][vc_column_text]
 [/vc_column_text][/vc_column][/vc_row][vc_row][vc_column][vc_column_text]My Bias: short below parity in wave (5).
Wave Structure: continuing impulsive structure to the downside in wave (5)
Long term wave count: decline in wave (5) blue, below parity
Important risk events: GBP: Services PMI. USD: Factory Orders m/m. USD: Factory Orders m/m.
The declines off the high labelled wave ‘iii’ in GBPUSD look corrective for now.
Todays low touched the lower trendline and the decline has stalled.
The short term level to watch lies at 1.2885, labelled wave ‘i’ pink,
wave ‘iv’ should not cross below that line in a five wave structure.
So we should look for wave ‘v’ pink to carry the market higher from here.
Wave (c) brown will reach equality with wave (a) brown at 1.3057,
So this is the target for wave (c) to complete.
For tomorrow;
A break of 1.2885 will put the current short term count in danger.[/vc_column_text][/vc_column][/vc_row]
[/_s2If]
[_s2If current_user_can(access_s2member_ccap_usdjpy)]
[vc_row][vc_column][vc_separator border_width=”5″][/vc_column][/vc_row][vc_row][vc_column][vc_column_text]
USDJPY
[/vc_column_text][/vc_column][/vc_row][vc_row][vc_column][vc_separator border_width=”5″][/vc_column][/vc_row][vc_row][vc_column width=”2/3″][vc_custom_heading text=”30 min” use_theme_fonts=”yes”][vc_column_text] [/vc_column_text][/vc_column][vc_column width=”1/3″][vc_custom_heading text=”4 Hours” use_theme_fonts=”yes”][vc_column_text]
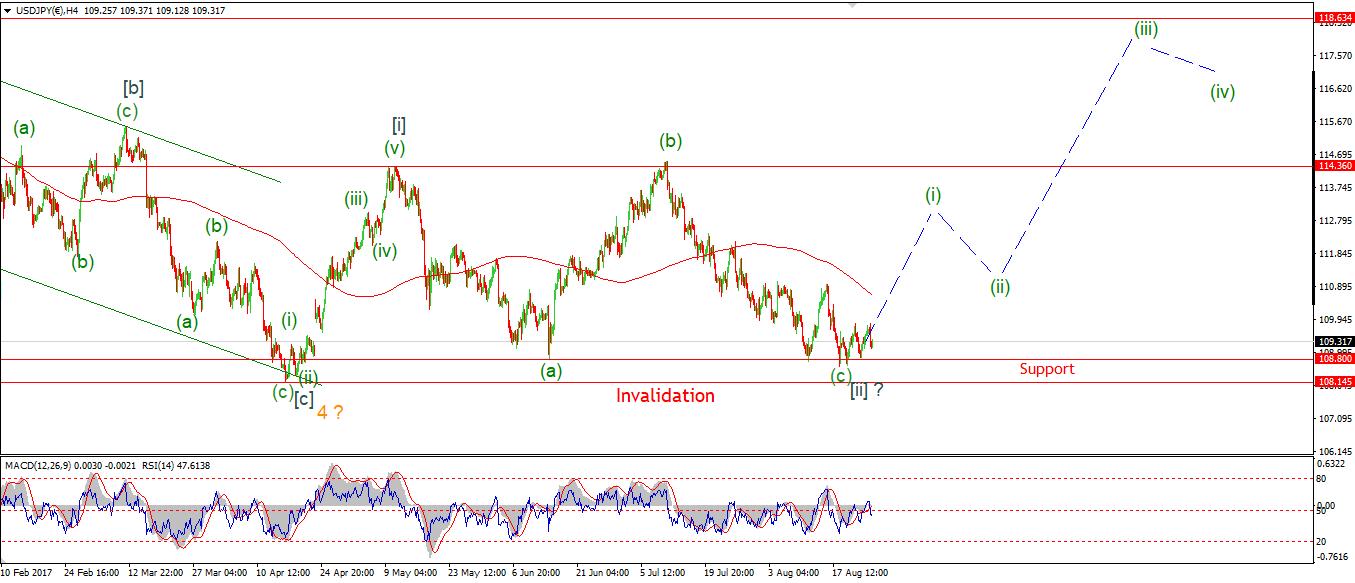 [/vc_column_text][vc_custom_heading text=”Daily” use_theme_fonts=”yes”][vc_column_text]
 [/vc_column_text][/vc_column][/vc_row][vc_row][vc_column][vc_column_text]My Bias: LONG
Wave Structure: rally in wave [C]
Long term wave count: wave [C] is underway, upside to above 136.00
Important risk events: JPY: N/A. USD: Factory Orders m/m. USD: Factory Orders m/m.
USDJPY gapped lower in the overnight trade.
The action still looks corrective off the high labelled wave ‘i’.
And the price is now sitting between the 50% and 61.8% retracement levels.
A correction in wave ‘ii’ should fid support here.
If the price forms a further higher low and fills todays gap in the price at above 110.00,
Then we could be looking at the start of wave ‘iii’ brown.
109.37 marks the low of the day,
For tomorrow;
Watch for this level to hold, and a rally into the gap.
Traders just do not want to believe that the Dollar could possibly build a long term rally against the YEN.
This disbelief is evident in the gap lower today,
And this disbelief is also fertile ground for a change in trend![/vc_column_text][/vc_column][/vc_row]
[/_s2If]
[_s2If current_user_can(access_s2member_ccap_dow_jones)]
[vc_row][vc_column][vc_separator][/vc_column][/vc_row][vc_row][vc_column][vc_column_text]
DOW JONES INDUSTRIALS
[/vc_column_text][/vc_column][/vc_row][vc_row][vc_column][vc_separator][/vc_column][/vc_row][vc_row][vc_column width=”2/3″][vc_custom_heading text=”30 min” use_theme_fonts=”yes”][vc_column_text] [/vc_column_text][/vc_column][vc_column width=”1/3″][vc_custom_heading text=”4 Hours” use_theme_fonts=”yes”][vc_column_text]
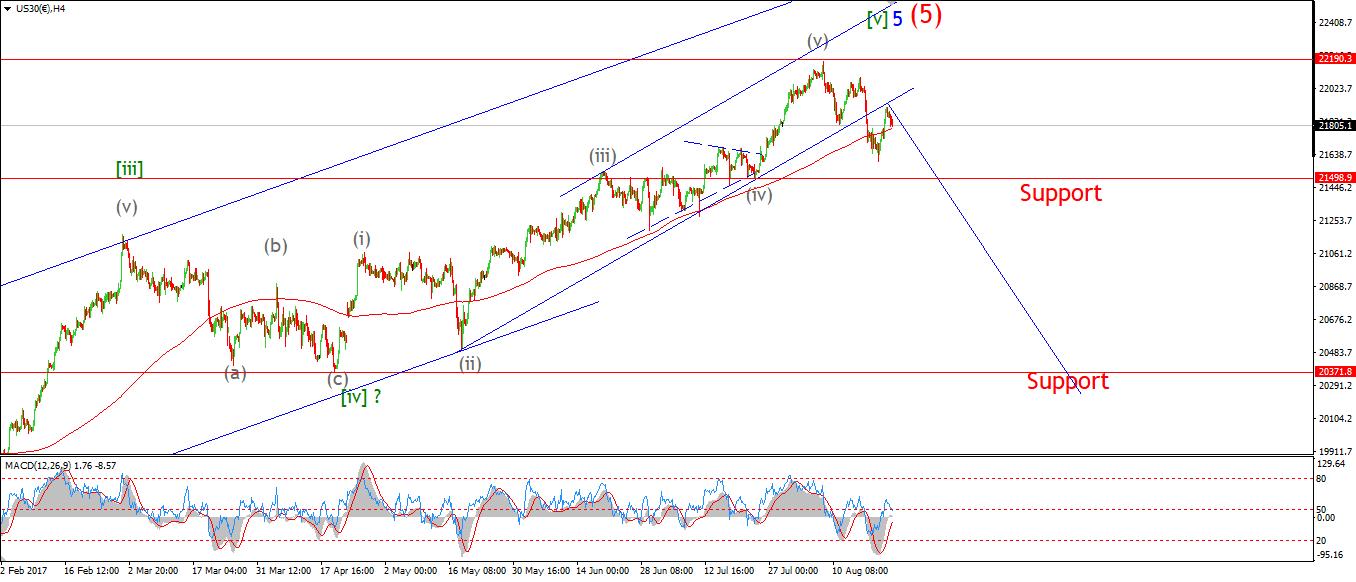 [/vc_column_text][vc_custom_heading text=”Daily” use_theme_fonts=”yes”][vc_column_text]
 [/vc_column_text][/vc_column][/vc_row][vc_row][vc_column][vc_column_text]My Bias: market topping process ongoing
Wave Structure: Impulsive 5 wave structure, possibly topping in an all time high.
Long term wave count: Possibly topped in wave (5)
Important risk events: USD: Factory Orders m/m.
The DOW did not trade today, but the derivative market was open.
The action looks corrective off the low after fridays sell off into the close.
We will have to wait until we get the cash market response tomorrow,
If Fridays high at 22038 holds
and the price turns down again in an impulsive fashion,
This will save the immediately bearish outlook, and set the market up for a fall in a possible wave (iii) grey.
For tomorrow;
Watch the reaction to Fridays selloff.
A corrective flat market will signal that a turn down is again on the cards.[/vc_column_text][/vc_column][/vc_row]
[/_s2If]
[_s2If current_user_can(access_s2member_ccap_gold)]
[vc_row][vc_column][vc_separator][/vc_column][/vc_row][vc_row][vc_column][vc_column_text]
GOLD
[/vc_column_text][/vc_column][/vc_row][vc_row][vc_column][vc_separator][/vc_column][/vc_row][vc_row][vc_column width=”2/3″][vc_custom_heading text=”30 min” use_theme_fonts=”yes”][vc_column_text] [/vc_column_text][/vc_column][vc_column width=”1/3″][vc_custom_heading text=”4 Hours” use_theme_fonts=”yes”][vc_column_text]
 [/vc_column_text][vc_custom_heading text=”Daily” use_theme_fonts=”yes”][vc_column_text]
 [/vc_column_text][/vc_column][/vc_row][vc_row][vc_column][vc_column_text]My Bias: Long towards 1550
Wave Structure: ZigZag correction to the upside.
Long term wave count: Topping in wave (B) at 1550
Important risk events: USD: Factory Orders m/m.
GOLD again rose today in wave ‘5’ of ‘iii’,
bringing the price above the target set for wave ‘iii’ brown.
This target was at 1332,
Todays high reached 1338.89 in the cash market,
so that original Fibonacci target has been met.
The price remained flat for the rest of the day,
Indicating that wave ‘5’ pink may not be complete just yet.
there is a possibility that the upper trendline will bet reached in the region of 1350 before closing out wave ‘iii’ brown.
For tomorrow;
Watch for the high at wave ‘3’ pink to hold,
a larger corrective decline off todays high will signal that wave ‘iv’ brown has in fact begun.[/vc_column_text][/vc_column][/vc_row]
[/_s2If]