
[vc_row][vc_column][vc_separator border_width=”5″][/vc_column][/vc_row][vc_row][vc_column][vc_column_text]Hello again everyone!
Here is another update on the short term charts, most of the markets have unfolded as expected over the last few days with the exception of the DOW.
Lets do a quick run through of each market.
[/vc_column_text][/vc_column][/vc_row]
[_s2If current_user_can(access_s2member_ccap_eurusd)]
[vc_row][vc_column][vc_separator border_width=”5″][/vc_column][/vc_row][vc_row][vc_column][vc_column_text]
EURUSD
[/vc_column_text][/vc_column][/vc_row][vc_row][vc_column][vc_separator border_width=”5″][/vc_column][/vc_row][vc_row][vc_column width=”2/3″][vc_custom_heading text=”30 min” use_theme_fonts=”yes”][vc_column_text] [/vc_column_text][/vc_column][vc_column width=”1/3″][vc_custom_heading text=”4 Hours” use_theme_fonts=”yes”][vc_column_text]
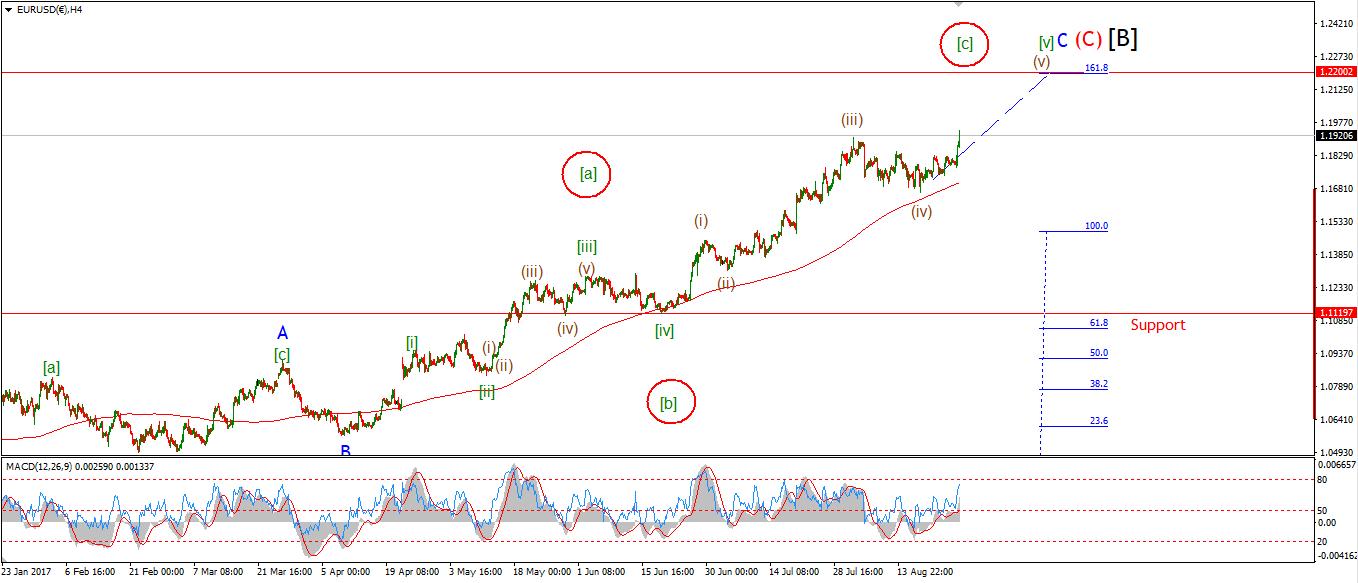 [/vc_column_text][vc_custom_heading text=”Daily” use_theme_fonts=”yes”][vc_column_text]
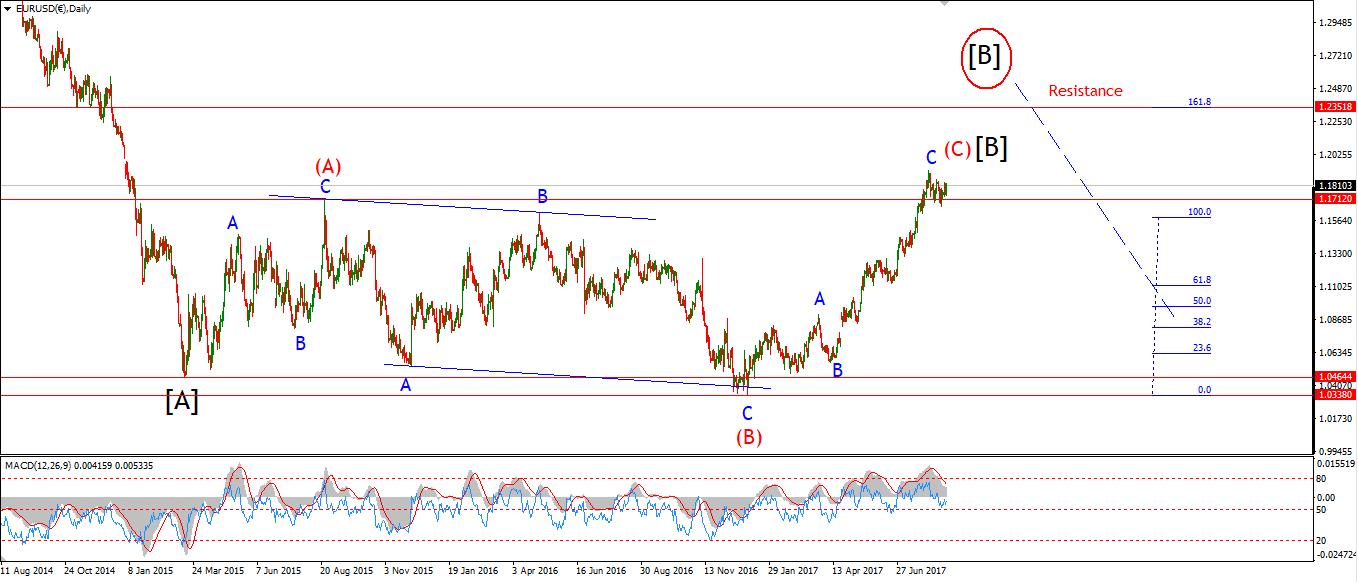 [/vc_column_text][/vc_column][/vc_row][vc_row][vc_column][vc_column_text]My Bias: long term bearish
Wave Structure: downward impulse wave
Long term wave count: lower in wave (3) red
EURUSD:
The market did decline off the recent high in a possible wave ‘iv pink. Todays rally has been in three waves so far. This opens the possibility that the market has in-fact topped at the recent high. This is shown as the alternate view circled in red. A break of 1.1753 will trigger the alternate wave count.
For now the operating wave count remains with the upper target set at the upper trendline, 1.2200 will do it to complete the larger wave structure.
[/vc_column_text][/vc_column][/vc_row]
[/_s2If]
[_s2If current_user_can(access_s2member_ccap_gbpusd)]
[vc_row][vc_column][vc_separator border_width=”5″][/vc_column][/vc_row][vc_row][vc_column][vc_column_text]
GBPUSD
[/vc_column_text][/vc_column][/vc_row][vc_row][vc_column][vc_separator border_width=”5″][/vc_column][/vc_row][vc_row][vc_column width=”2/3″][vc_custom_heading text=”30 min” use_theme_fonts=”yes”][vc_column_text] [/vc_column_text][/vc_column][vc_column width=”1/3″][vc_custom_heading text=”4 Hours” use_theme_fonts=”yes”][vc_column_text]
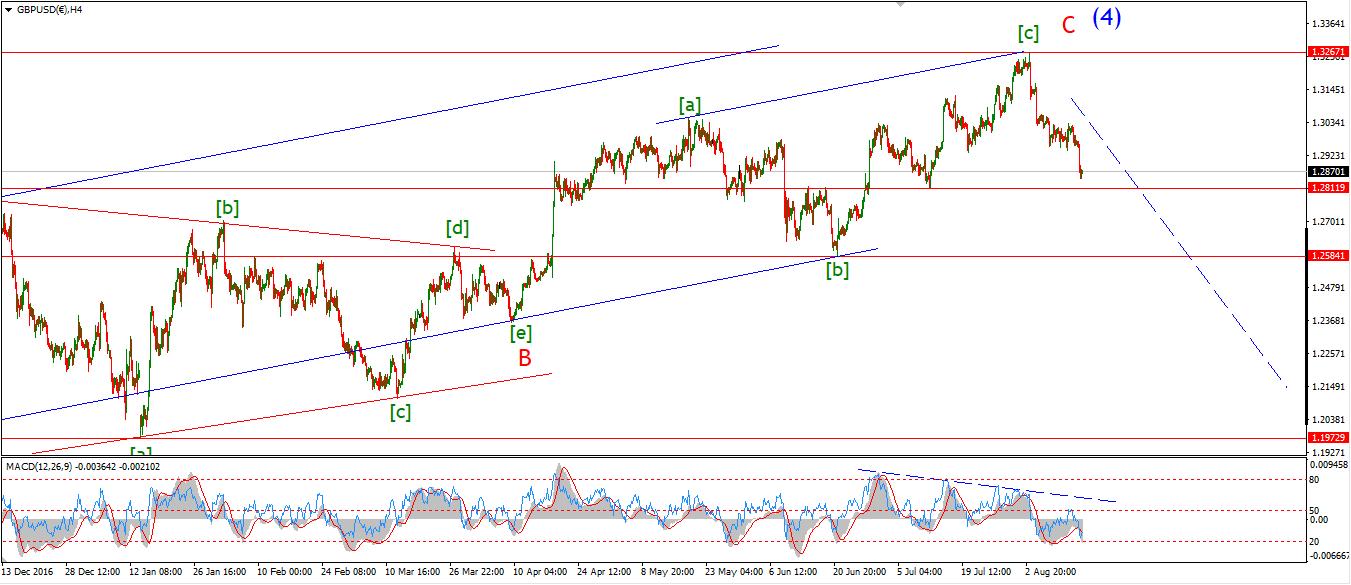 [/vc_column_text][vc_custom_heading text=”Daily” use_theme_fonts=”yes”][vc_column_text]
 [/vc_column_text][/vc_column][/vc_row][vc_row][vc_column][vc_column_text]My Bias: short below parity in wave (5).
Wave Structure: continuing impulsive structure to the downside in wave (5)
Long term wave count: decline in wave (5) blue, below parity
GBPUSD:
The wave count had suggested a three wave rally in a second wave labelled [ii] green. The rise in wave (c) brown has almost completed a five wave structure, labelled in pink. The price will meet the upper trend line at about 1.3030.
[/vc_column_text][/vc_column][/vc_row]
[/_s2If]
[_s2If current_user_can(access_s2member_ccap_usdjpy)]
[vc_row][vc_column][vc_separator border_width=”5″][/vc_column][/vc_row][vc_row][vc_column][vc_column_text]
USDJPY
[/vc_column_text][/vc_column][/vc_row][vc_row][vc_column][vc_separator border_width=”5″][/vc_column][/vc_row][vc_row][vc_column width=”2/3″][vc_custom_heading text=”30 min” use_theme_fonts=”yes”][vc_column_text] [/vc_column_text][/vc_column][vc_column width=”1/3″][vc_custom_heading text=”4 Hours” use_theme_fonts=”yes”][vc_column_text]
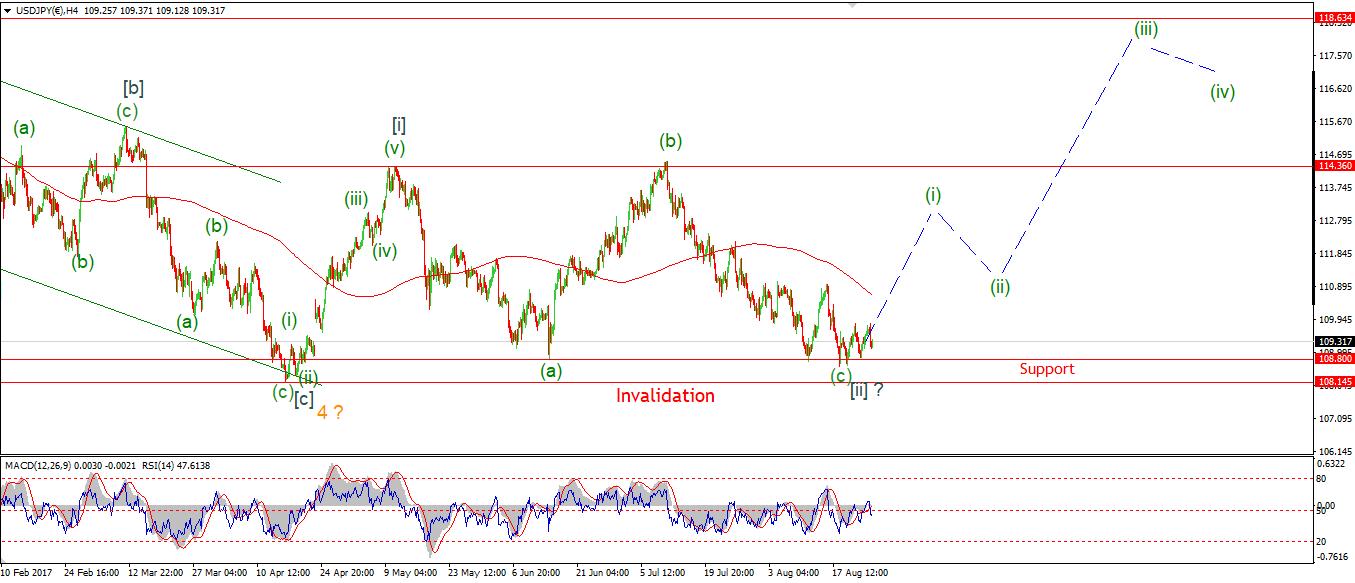 [/vc_column_text][vc_custom_heading text=”Daily” use_theme_fonts=”yes”][vc_column_text]
 [/vc_column_text][/vc_column][/vc_row][vc_row][vc_column][vc_column_text]My Bias: LONG
Wave Structure: rally in wave [C]
Long term wave count: wave [C] is beginning, upside to above 136.00
USDJPY:
I am again very interested in the price action displayed in USDJPY, The price has stopped short of breaking resistance at 111.05, but given the preferred wave count, this should not be far away.
The best interpretation for the rise off the low is a five wave structure in wave ‘i’ brown. the decline off yesterdays high is a clear three wave structure. And the price has bounced again in a bullish reaction off todays low.
If 109.55 holds, and the price rallies above the wave ‘i’ high at 110.67, this action will be very bullish, and a possible rally in wave ‘iii’ brown could be under way at that point.
111.05 remains the key resistance to and rally.
[/vc_column_text][/vc_column][/vc_row]
[/_s2If]
[_s2If current_user_can(access_s2member_ccap_dow_jones)]
[vc_row][vc_column][vc_separator][/vc_column][/vc_row][vc_row][vc_column][vc_column_text]
DOW JONES INDUSTRIALS
[/vc_column_text][/vc_column][/vc_row][vc_row][vc_column][vc_separator][/vc_column][/vc_row][vc_row][vc_column width=”2/3″][vc_custom_heading text=”30 min” use_theme_fonts=”yes”][vc_column_text] [/vc_column_text][/vc_column][vc_column width=”1/3″][vc_custom_heading text=”4 Hours” use_theme_fonts=”yes”][vc_column_text]
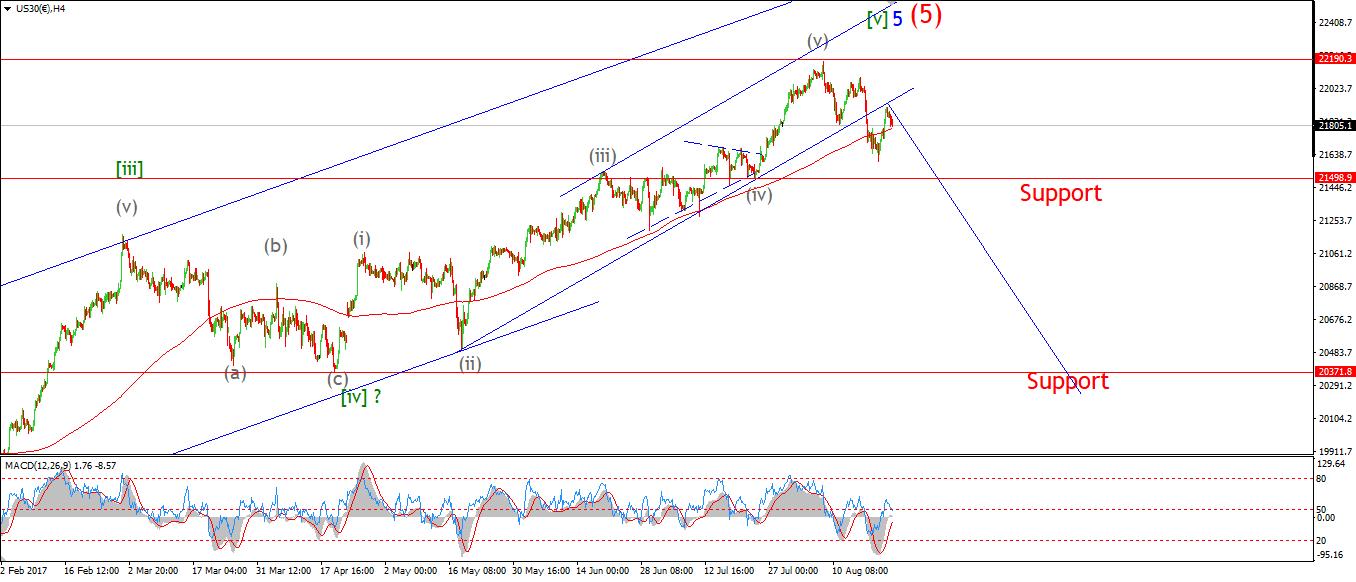 [/vc_column_text][vc_custom_heading text=”Daily” use_theme_fonts=”yes”][vc_column_text]
 [/vc_column_text][/vc_column][/vc_row][vc_row][vc_column][vc_column_text]My Bias: market topping process ongoing
Wave Structure: Impulsive 5 wave structure, possibly topping in an all time high.
Long term wave count: Topped in wave (5) possible bear market beginning.
DOW:
The Price has grinded higher in a possible wave ‘c’ of (ii). although at the high of the day the price was only about 45 points below invalidating this bearish interpretation.
The wave count still stands until resistance at 22085.7 is broken, the rise off the low at wave (i) grey is still best viewed as a three wave structure, and this still suggests that the market is rising in a correction. 22085 is the price to watch on Monday.
[/vc_column_text][/vc_column][/vc_row]
[/_s2If]
[_s2If current_user_can(access_s2member_ccap_gold)]
[vc_row][vc_column][vc_separator][/vc_column][/vc_row][vc_row][vc_column][vc_column_text]
GOLD
[/vc_column_text][/vc_column][/vc_row][vc_row][vc_column][vc_separator][/vc_column][/vc_row][vc_row][vc_column width=”2/3″][vc_custom_heading text=”30 min” use_theme_fonts=”yes”][vc_column_text] [/vc_column_text][/vc_column][vc_column width=”1/3″][vc_custom_heading text=”4 Hours” use_theme_fonts=”yes”][vc_column_text]
 [/vc_column_text][vc_custom_heading text=”Daily” use_theme_fonts=”yes”][vc_column_text]
 [/vc_column_text][/vc_column][/vc_row][vc_row][vc_column][vc_column_text]My Bias: Long towards 1550
Wave Structure: ZigZag correction to the upside.
Long term wave count: Topping in wave (B) at 1550
GOLD:
The bullish action in Gold continued over the last few days. the price rallied out of a correction in wave ‘4’ pink as suggested by the earlier report this week. Although my chart shows a break of the wave ‘1’ high at 1300.69 in wave ‘4’, this did not occur in the cash market, So the bullish five wave structure remains intact.
The trend channel now suggests a break above 1350 to complete wave ‘iii’ brown. Once that occurs, it will be time to look for a correction again in a possible wave ‘iv’ brown.
The bullish scenario for GOLD is hotting up now, and we could be very close to a serious acceleration phase.
1300.69 remains key support in the short term structure.[/vc_column_text][/vc_column][/vc_row]
[/_s2If]