
[_s2If current_user_can(access_s2member_ccap_eurusd)]
[vc_row][vc_column][vc_separator border_width=”5″][/vc_column][/vc_row][vc_row][vc_column][vc_column_text]
EURUSD
[/vc_column_text][/vc_column][/vc_row][vc_row][vc_column][vc_separator border_width=”5″][/vc_column][/vc_row][vc_row][vc_column width=”2/3″][vc_custom_heading text=”30 min” use_theme_fonts=”yes”][vc_column_text] [/vc_column_text][/vc_column][vc_column width=”1/3″][vc_custom_heading text=”4 Hours” use_theme_fonts=”yes”][vc_column_text]
 [/vc_column_text][vc_custom_heading text=”Daily” use_theme_fonts=”yes”][vc_column_text]
 [/vc_column_text][/vc_column][/vc_row][vc_row][vc_column][vc_column_text]My Bias: long term bearish
Wave Structure: downward impulse wave
Long term wave count: lower in wave (3) red
Important risk events: EUR: ECB President Draghi Speaks, Flash Manufacturing PMI, Flash Services PMI. USD: New Home Sales, Crude Oil Inventories.
Good evening to you all,
It has been overcast and raining in the west of Ireland for about two weeks now,
I cant remember what the sun looks like!
Summer, how are ya!
Anyway, down to business.
EURUSD did decline today in a promising fashion,
The decline is likely the beginning of wave ‘iii’ pink.
This wave should trace out five internal waves to reach the target at about 1.1480 or so.
The decline has not crossed the previous intraday low at 1.1730.
so that is the level to watch.
A break of that level will shift the focus to the downside.
The 4hr chart shows a contineous slide to negative territory for the momentum indicators.
The Divergence has been long established,
But there has not been a solid decline in price yet.
This could change quickly!
The price is also approaching the 200MA,
A break below that line will be another nail in the coffin.
For tomorrow;
The initial level of interest is 1.1730,
A break of that level will turn the tide
and should lead to a quick decline in wave ‘3’ grey.[/vc_column_text][/vc_column][/vc_row]
[/_s2If]
[_s2If current_user_can(access_s2member_ccap_gbpusd)]
[vc_row][vc_column][vc_separator border_width=”5″][/vc_column][/vc_row][vc_row][vc_column][vc_column_text]
GBPUSD
[/vc_column_text][/vc_column][/vc_row][vc_row][vc_column][vc_separator border_width=”5″][/vc_column][/vc_row][vc_row][vc_column width=”2/3″][vc_custom_heading text=”30 min” use_theme_fonts=”yes”][vc_column_text] [/vc_column_text][/vc_column][vc_column width=”1/3″][vc_custom_heading text=”4 Hours” use_theme_fonts=”yes”][vc_column_text]
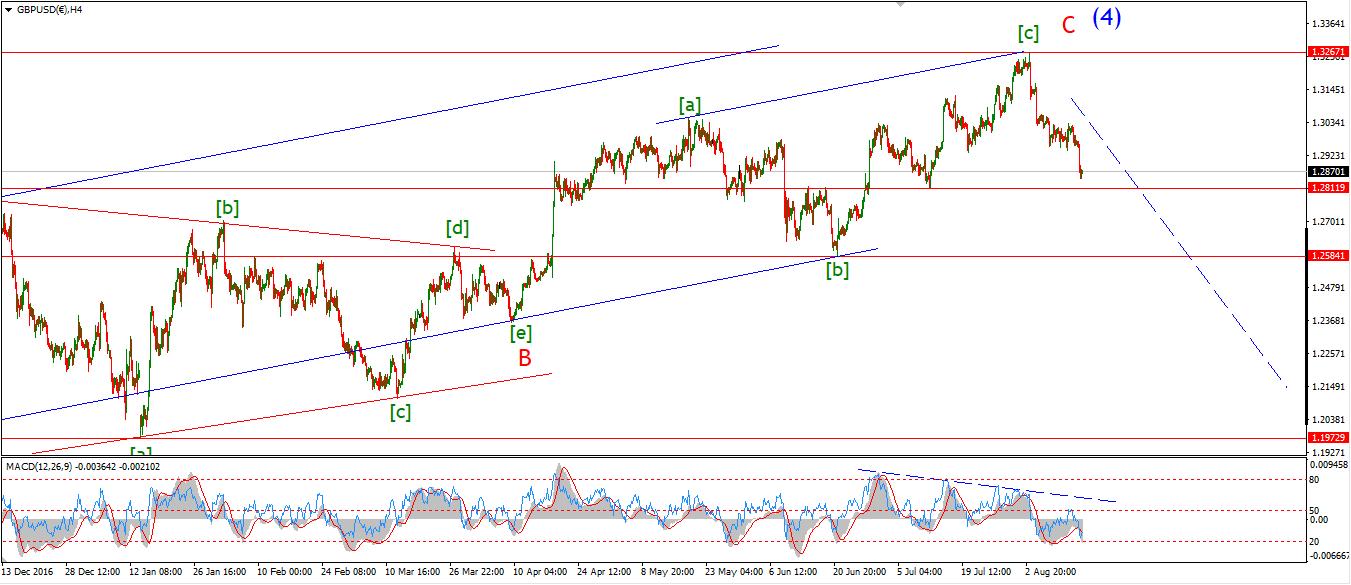 [/vc_column_text][vc_custom_heading text=”Daily” use_theme_fonts=”yes”][vc_column_text]
 [/vc_column_text][/vc_column][/vc_row][vc_row][vc_column][vc_column_text]My Bias: short below parity in wave (5).
Wave Structure: continuing impulsive structure to the downside in wave (5)
Long term wave count: decline in wave (5) blue, below parity
Important risk events: GBP: N/A. USD: New Home Sales, Crude Oil Inventories.
I have spoken about 1.2811 over the last few weeks as major support for the current bearish wave setup.
This marks the level of the previous wave (b) brown shown on the chart.
The price declined into 1.2810 twice today,
A clear break of that level will reduce the chances for another major rally significantly.
For tomorrow;
I have labelled todays decline as wave ‘1’ grey,
A slight corrective rise in wave ‘2’ grey should be followed by another sharp decline in wave ‘3’.
Watch for 1.2916 to hold,
A clear break of support and the beginning of wave ‘iii’ pink.[/vc_column_text][/vc_column][/vc_row]
[/_s2If]
[_s2If current_user_can(access_s2member_ccap_usdjpy)]
[vc_row][vc_column][vc_separator border_width=”5″][/vc_column][/vc_row][vc_row][vc_column][vc_column_text]
USDJPY
[/vc_column_text][/vc_column][/vc_row][vc_row][vc_column][vc_separator border_width=”5″][/vc_column][/vc_row][vc_row][vc_column width=”2/3″][vc_custom_heading text=”30 min” use_theme_fonts=”yes”][vc_column_text]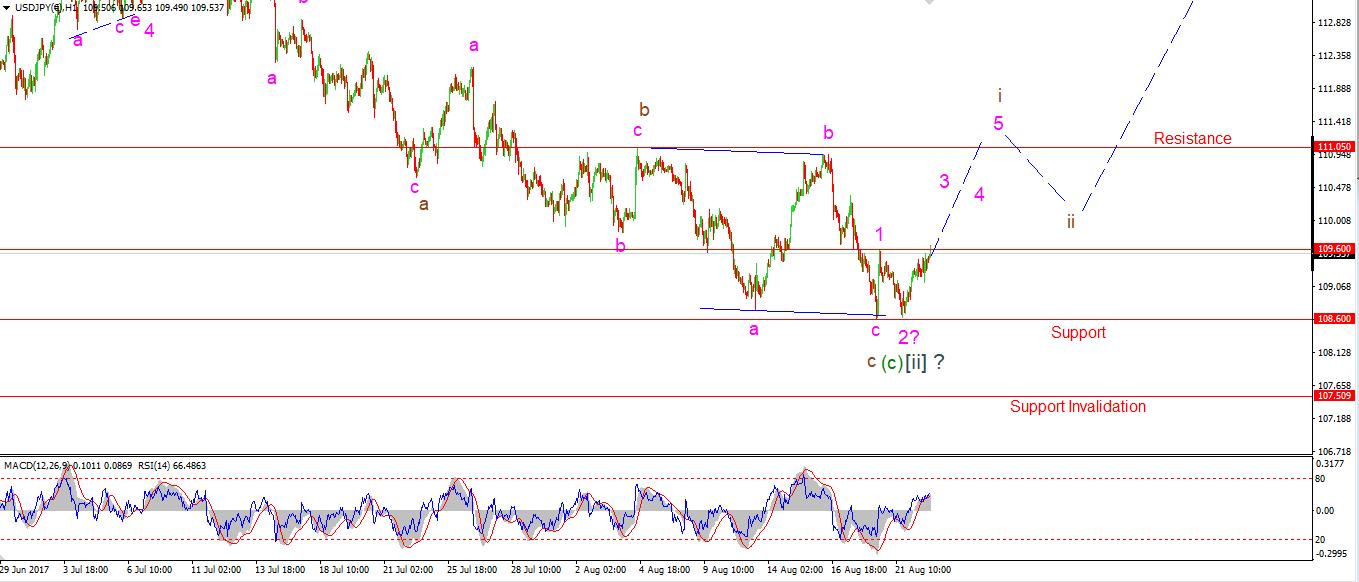 [/vc_column_text][/vc_column][vc_column width=”1/3″][vc_custom_heading text=”4 Hours” use_theme_fonts=”yes”][vc_column_text]
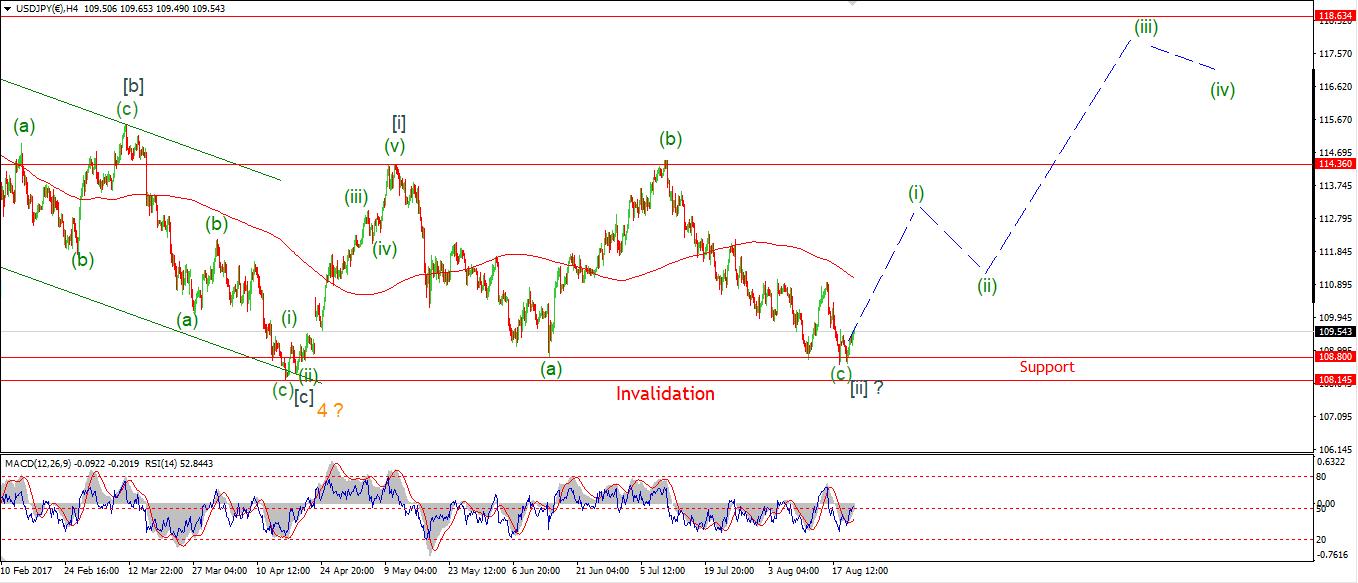 [/vc_column_text][vc_custom_heading text=”Daily” use_theme_fonts=”yes”][vc_column_text]
 [/vc_column_text][/vc_column][/vc_row][vc_row][vc_column][vc_column_text]My Bias: LONG
Wave Structure: rally in wave [C]
Long term wave count: wave [C] is underway, upside to above 136.00
Important risk events: JPY: N/A. USD: New Home Sales, Crude Oil Inventories.
So far the rise off support at 108.60 has been in three waves.
The price structure sits just above major support at 107.50,
if this market is going to turn up,
Which I think it will,
It has simply got to happen this week.
There is a clear bullish momentum divergence on the 4hr chart.
With a double bottom in place in RSI.
The price has spent the last 6 weeks in decline,
even though the larger wave form is still very bullish on the daily chart.
I get the feeling that this market is storing up a very large recoil rally,
Which could take the price above 118.60 in wave [iii] grey,
If this wave count proves correct.
For the next few days it is touch and go for the bullish setup.
But if there is a positive move into 111.05
followed by a corrective decline,
This will be the setup I have been waiting for.
108.60 must hold.[/vc_column_text][/vc_column][/vc_row]
[/_s2If]
[_s2If current_user_can(access_s2member_ccap_dow_jones)]
[vc_row][vc_column][vc_separator][/vc_column][/vc_row][vc_row][vc_column][vc_column_text]
DOW JONES INDUSTRIALS
[/vc_column_text][/vc_column][/vc_row][vc_row][vc_column][vc_separator][/vc_column][/vc_row][vc_row][vc_column width=”2/3″][vc_custom_heading text=”30 min” use_theme_fonts=”yes”][vc_column_text]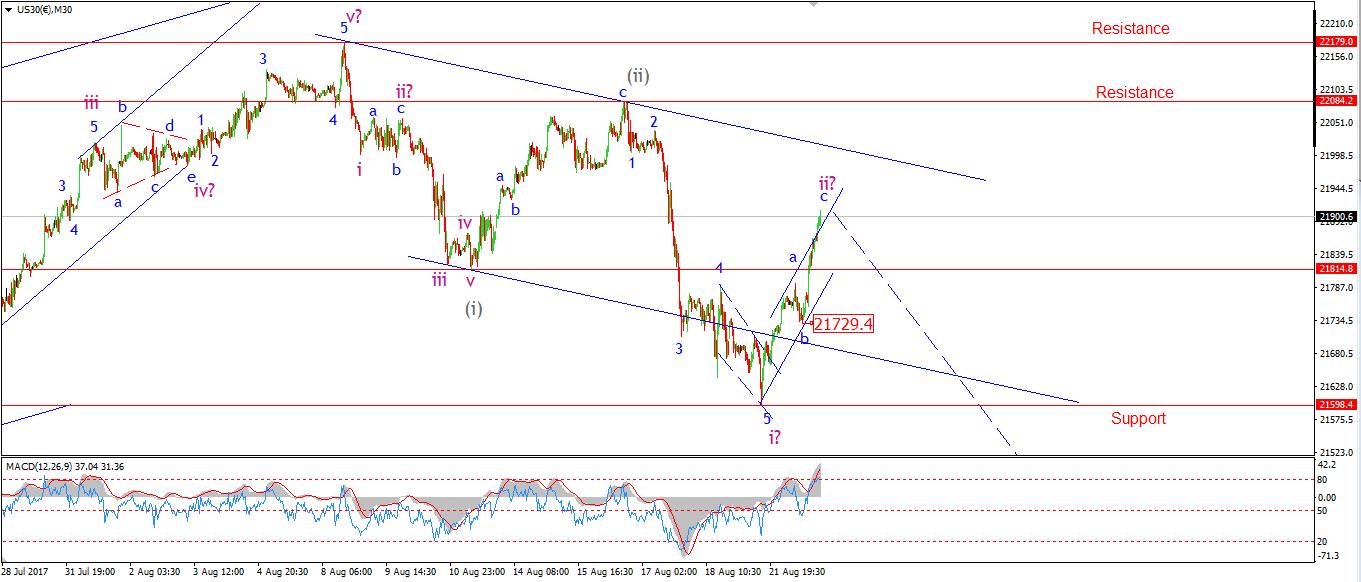 [/vc_column_text][/vc_column][vc_column width=”1/3″][vc_custom_heading text=”4 Hours” use_theme_fonts=”yes”][vc_column_text]
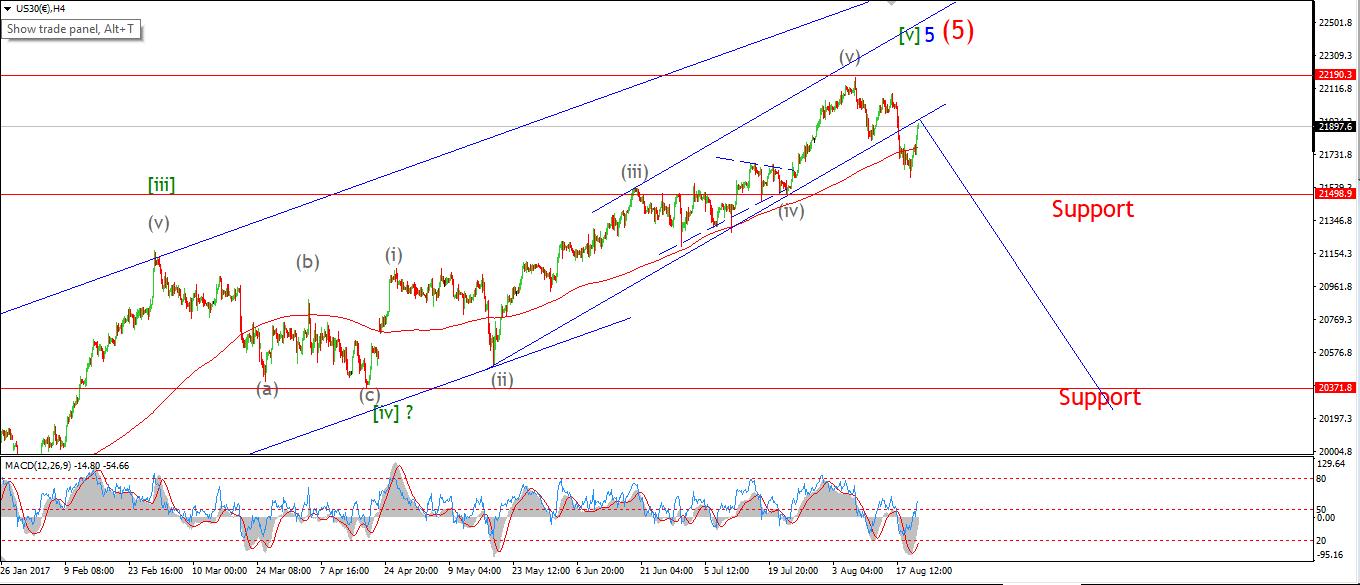 [/vc_column_text][vc_custom_heading text=”Daily” use_theme_fonts=”yes”][vc_column_text]
 [/vc_column_text][/vc_column][/vc_row][vc_row][vc_column][vc_column_text]My Bias: market topping process ongoing
Wave Structure: Impulsive 5 wave structure, possibly topping in an all time high.
Long term wave count: Topping in wave (5)
Important risk events: USD: New Home Sales, Crude Oil Inventories.
The declines off the recent all time highs have so far traced out a three wave form.
Which does point to a corrective decline.
But,
The rally of the recent low is best counted as a three wave move,
Which again points to a corrective rise in wave ‘ii’ pink.
So;
The bearish wave count is still a very real probability from here.
On the 4hr chart,
Last weeks declines punched down through the 200MA,
Which is a general bearish warning sign.
and since then,
The price has rebounded into the large rising trend channel,
which should offer resistance.
The daily RSI has now given a momentum sell signal
after a showing major divergence form the price for most of the year,
with successive lower highs.
At this point,
We have a bearish setup in Elliott waves, Momentum signals, and price action.
So this could get ugly.
For tomorrow;
Watch for signs turn down from todays highs in wave ‘iii’ pink.
A drop below wave ‘b’ will be the initial sign of a turn down.
22084 is the bearish invalidation line.[/vc_column_text][/vc_column][/vc_row]
[/_s2If]
[_s2If current_user_can(access_s2member_ccap_gold)]
[vc_row][vc_column][vc_separator][/vc_column][/vc_row][vc_row][vc_column][vc_column_text]
GOLD
[/vc_column_text][/vc_column][/vc_row][vc_row][vc_column][vc_separator][/vc_column][/vc_row][vc_row][vc_column width=”2/3″][vc_custom_heading text=”30 min” use_theme_fonts=”yes”][vc_column_text] [/vc_column_text][/vc_column][vc_column width=”1/3″][vc_custom_heading text=”4 Hours” use_theme_fonts=”yes”][vc_column_text]
 [/vc_column_text][vc_custom_heading text=”Daily” use_theme_fonts=”yes”][vc_column_text]
 [/vc_column_text][/vc_column][/vc_row][vc_row][vc_column][vc_column_text]My Bias: Long towards 1550
Wave Structure: ZigZag correction to the upside.
Long term wave count: Topping in wave (B) at 1550
Important risk events: USD: New Home Sales, Crude Oil Inventories.
Initial support at 1280 has held so far today.
The price structure shows three levels of support at three degrees of trend right now.
The alternate wave count remains a possibility still,
This will be ruled out by a rise above 1300.75.
Wave ‘3’ pink is now projected to reach 1334,
And wave ‘iii’ brown is projected to 1332.
This offers a nice cluster of Fibonacci levels for a target for wave ‘iii’.
For tomorrow;
Continue to watch for bullish action off 1280.46,
A break of 1300.73 will signal wave ‘3’ pink is underway.[/vc_column_text][/vc_column][/vc_row]
[/_s2If]