
[_s2If current_user_can(access_s2member_ccap_eurusd)]
[vc_row][vc_column][vc_separator border_width=”5″][/vc_column][/vc_row][vc_row][vc_column][vc_column_text]
EURUSD
[/vc_column_text][/vc_column][/vc_row][vc_row][vc_column][vc_separator border_width=”5″][/vc_column][/vc_row][vc_row][vc_column width=”2/3″][vc_custom_heading text=”30 min” use_theme_fonts=”yes”][vc_column_text] [/vc_column_text][/vc_column][vc_column width=”1/3″][vc_custom_heading text=”4 Hours” use_theme_fonts=”yes”][vc_column_text]
 [/vc_column_text][vc_custom_heading text=”Daily” use_theme_fonts=”yes”][vc_column_text]
 [/vc_column_text][/vc_column][/vc_row][vc_row][vc_column][vc_column_text]My Bias: long term bearish
Wave Structure: downward impulse wave
Long term wave count: lower in wave (3) red
Important risk events: EUR: German ZEW Economic Sentiment. USD: Mortgage Delinquencies.
Good evening all, I hope you are in good shape!
EURUSD pulled a small rally out of the hat today.
This has changed the short term wave count slightly,
The structure off the high is now viewed as a a decline in waves (i) and (ii)
Followed by another ‘i,ii’ sequence.
As mentioned on Friday,
The price must decline substantially from here to remain bearish in the short term.
1.1847 marks the high of wave (ii) brown,
A break above that level will rule out the bearish wave count.
The alternate count is shown on the daily chart circled in red.
A higher target for wave [B] exists at the 161.8% Fibonacci extension of wave [A].
If the high at 1.1910 is broken it will trigger the alternate wave count.
For tomorrow;
Watch 1.1847, It must hold from here.
If the price declines below 1.1730, it will add some confidence to the bearish setup.
A further decline below 1.1660 will greatly increase the probability of the bearish wave count.[/vc_column_text][/vc_column][/vc_row]
[/_s2If]
[_s2If current_user_can(access_s2member_ccap_gbpusd)]
[vc_row][vc_column][vc_separator border_width=”5″][/vc_column][/vc_row][vc_row][vc_column][vc_column_text]
GBPUSD
[/vc_column_text][/vc_column][/vc_row][vc_row][vc_column][vc_separator border_width=”5″][/vc_column][/vc_row][vc_row][vc_column width=”2/3″][vc_custom_heading text=”30 min” use_theme_fonts=”yes”][vc_column_text] [/vc_column_text][/vc_column][vc_column width=”1/3″][vc_custom_heading text=”4 Hours” use_theme_fonts=”yes”][vc_column_text]
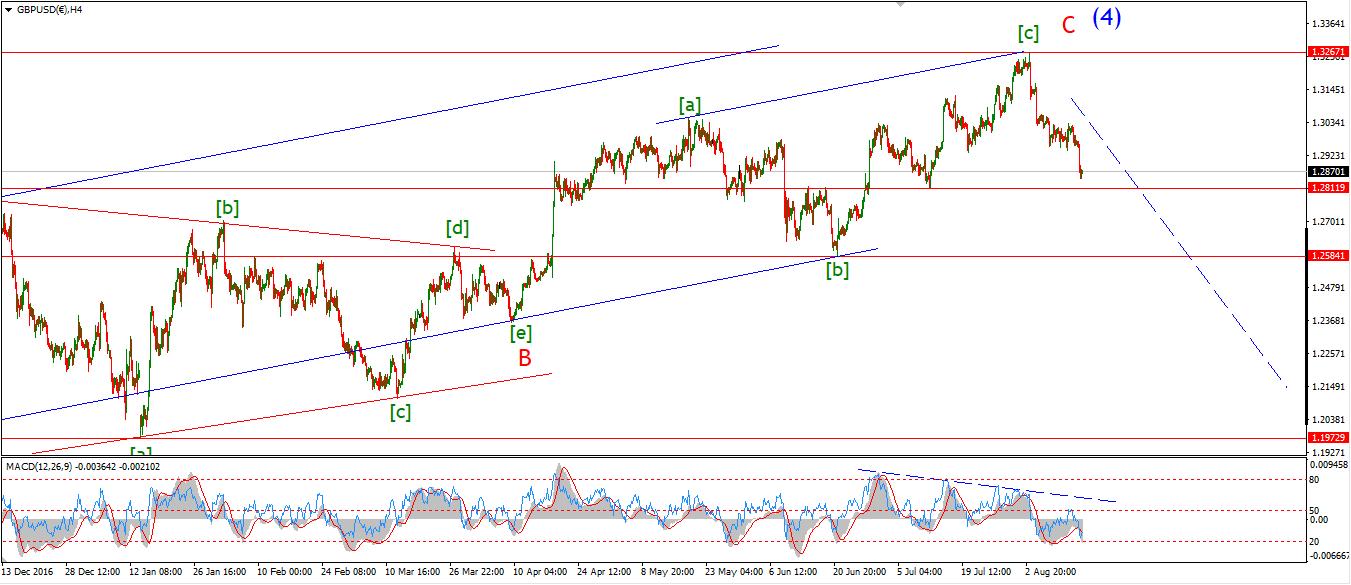 [/vc_column_text][vc_custom_heading text=”Daily” use_theme_fonts=”yes”][vc_column_text]
 [/vc_column_text][/vc_column][/vc_row][vc_row][vc_column][vc_column_text]My Bias: short below parity in wave (5).
Wave Structure: continuing impulsive structure to the downside in wave (5)
Long term wave count: decline in wave (5) blue, below parity
Important risk events: GBP: Public Sector Net Borrowing. USD: Mortgage Delinquencies.
The action in cable remained corrective today.
The market was flat and this has prompted a slightly different wave count.
I have switched to the alternate count which shows a larger degree decline in wave (i) and (ii) off the high,
Followed by a minor degree decline in wave ‘i’ and ‘ii’
The current setup is very bearish,
And it calls for a substantial decline in wave ‘iii’ pink very soon.
Wave ‘ii’ pink seems to be tracing out a very complex triple combination correction.
This involves three separate three wave structures joining up to create the larger wave.
For tomorrow;
1.2917 is providing some resistance to wave ‘ii’,
If the price declines in an impulsive fashion from here it will signal the beginning of wave ‘iii’ pink.
A break of support at 1.2810 will add significant weight to the bearish wave count.
[/vc_column_text][/vc_column][/vc_row]
[/_s2If]
[_s2If current_user_can(access_s2member_ccap_usdjpy)]
[vc_row][vc_column][vc_separator border_width=”5″][/vc_column][/vc_row][vc_row][vc_column][vc_column_text]
USDJPY
[/vc_column_text][/vc_column][/vc_row][vc_row][vc_column][vc_separator border_width=”5″][/vc_column][/vc_row][vc_row][vc_column width=”2/3″][vc_custom_heading text=”30 min” use_theme_fonts=”yes”][vc_column_text] [/vc_column_text][/vc_column][vc_column width=”1/3″][vc_custom_heading text=”4 Hours” use_theme_fonts=”yes”][vc_column_text]
 [/vc_column_text][vc_custom_heading text=”Daily” use_theme_fonts=”yes”][vc_column_text]
 [/vc_column_text][/vc_column][/vc_row][vc_row][vc_column][vc_column_text]My Bias: LONG
Wave Structure: rally in wave [C]
Long term wave count: wave [C] is underway, upside to above 136.00
Important risk events: JPY: N/A. USD: Mortgage Delinquencies.
USDJPY remains in limbo after todays trade!
The decline today did not yet break support at 108.60,
But it got very close,
so, from this point 108.60 is the level to watch for a reversal higher.
On the 4hr chart I can see that the RSI has created another double bottom over the last week.
And the daily RSI has diverged upwards from the price,
This momentum situation is signalling another turn higher soon.
It is worth keeping in mind the alternate wave count shown on the daily chart,
This shows wave ‘4’ orange as a contracting triangle.
This alternate wave count is also calling for a rally into about 113.00 as the next leg of that possibily triangle.
For the next few days I will be keeping a close eye on the action off 108.60.[/vc_column_text][/vc_column][/vc_row]
[/_s2If]
[_s2If current_user_can(access_s2member_ccap_dow_jones)]
[vc_row][vc_column][vc_separator][/vc_column][/vc_row][vc_row][vc_column][vc_column_text]
DOW JONES INDUSTRIALS
[/vc_column_text][/vc_column][/vc_row][vc_row][vc_column][vc_separator][/vc_column][/vc_row][vc_row][vc_column width=”2/3″][vc_custom_heading text=”30 min” use_theme_fonts=”yes”][vc_column_text] [/vc_column_text][/vc_column][vc_column width=”1/3″][vc_custom_heading text=”4 Hours” use_theme_fonts=”yes”][vc_column_text]
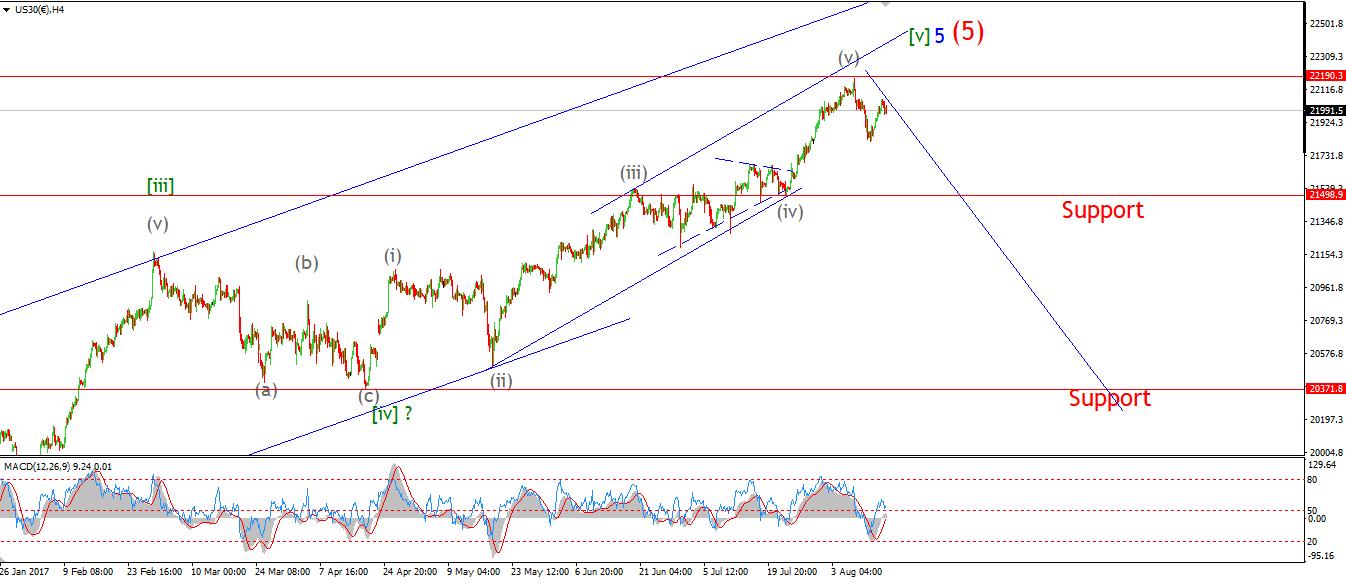 [/vc_column_text][vc_custom_heading text=”Daily” use_theme_fonts=”yes”][vc_column_text]
 [/vc_column_text][/vc_column][/vc_row][vc_row][vc_column][vc_column_text]My Bias: market topping process ongoing
Wave Structure: Impulsive 5 wave structure, possibly topping in an all time high.
Long term wave count: Topping in wave (5)
Important risk events: USD: Mortgage Delinquencies.
Todays new low in stocks looks like a three wave decline in wave ‘b’, within the larger unfolding wave ‘ii’ pink.
Wave ‘ii’ is possibly tracing out an expanded flat correction to the upside.
Wave ‘c’ blue should take the price back into resistance at 21815 again before completing.
Wave ‘c’ should trace out a five wave structure.
So,
21815 now takes on a new significance in this wave count,
This could prove to be the pivot point aroound which a larger wave down will begin.
I have shown a possible alternate count also,
This shows an ongoing contracting triangle wave ‘iv’,
A break of the high at wave ‘a’ blue, will rule out this interpretation.
For tomorrow;
Watch for a rally into resistance at 21815,
Also take note of the action around that point.[/vc_column_text][/vc_column][/vc_row]
[/_s2If]
[_s2If current_user_can(access_s2member_ccap_gold)]
[vc_row][vc_column][vc_separator][/vc_column][/vc_row][vc_row][vc_column][vc_column_text]
GOLD
[/vc_column_text][/vc_column][/vc_row][vc_row][vc_column][vc_separator][/vc_column][/vc_row][vc_row][vc_column width=”2/3″][vc_custom_heading text=”30 min” use_theme_fonts=”yes”][vc_column_text] [/vc_column_text][/vc_column][vc_column width=”1/3″][vc_custom_heading text=”4 Hours” use_theme_fonts=”yes”][vc_column_text]
 [/vc_column_text][vc_custom_heading text=”Daily” use_theme_fonts=”yes”][vc_column_text]
 [/vc_column_text][/vc_column][/vc_row][vc_row][vc_column][vc_column_text]My Bias: Long towards 1550
Wave Structure: ZigZag correction to the upside.
Long term wave count: Topping in wave (B) at 1550
Important risk events: USD: Mortgage Delinquencies.
GOLD may have completed wave ‘2’ pink today.
The decline off Fridays high was sharp, but given the larger wave count,
it is prudent to look for a sharp rally to occur soon.
The next move up will be in wave ‘3’ of ‘iii’ of (iii).
So, the bullish potential is very large at this point in time.
Todays low reached 1280.46,
a decline below this level will signal that a larger wave ‘ii’ is unfolding,
as shown in the alternate count.
For tomorrow;
A further rise above 1300 will signal that wave ‘3’ pink has begun.
Wave ‘3’ pink should carry the price most of the way to the target at 1332.[/vc_column_text][/vc_column][/vc_row]
[/_s2If]