
[_s2If current_user_can(access_s2member_ccap_eurusd)]
[vc_row][vc_column][vc_separator border_width=”5″][/vc_column][/vc_row][vc_row][vc_column][vc_column_text]
EURUSD
[/vc_column_text][/vc_column][/vc_row][vc_row][vc_column][vc_separator border_width=”5″][/vc_column][/vc_row][vc_row][vc_column width=”2/3″][vc_custom_heading text=”30 min” use_theme_fonts=”yes”][vc_column_text] [/vc_column_text][/vc_column][vc_column width=”1/3″][vc_custom_heading text=”4 Hours” use_theme_fonts=”yes”][vc_column_text]
 [/vc_column_text][vc_custom_heading text=”Daily” use_theme_fonts=”yes”][vc_column_text]
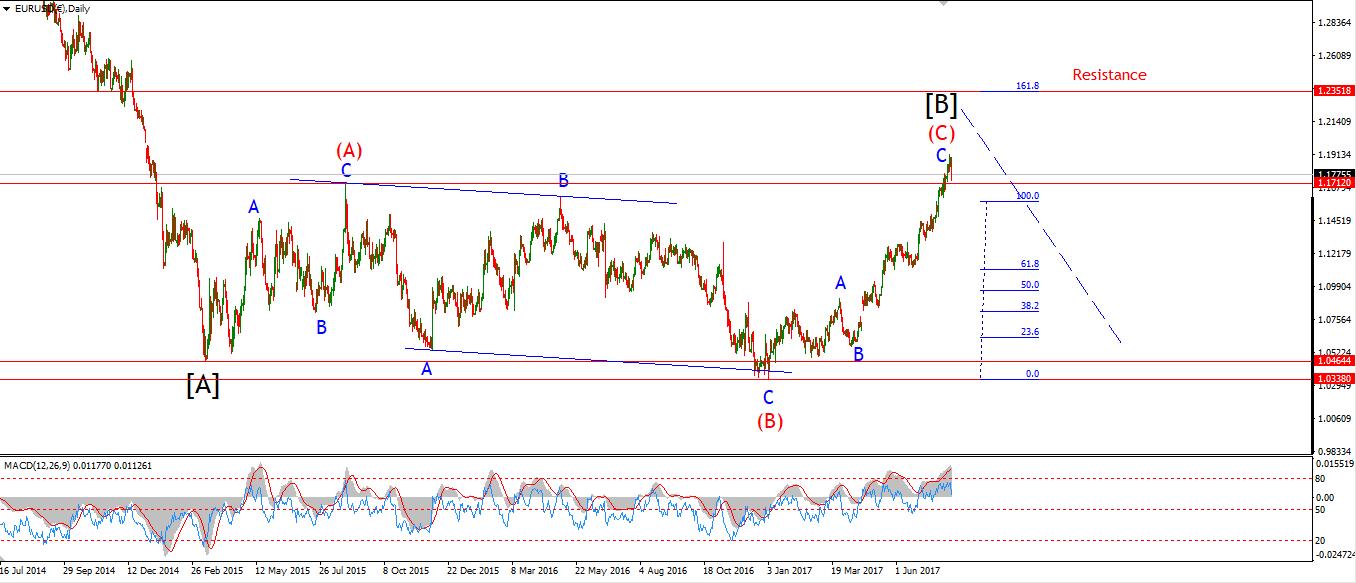 [/vc_column_text][/vc_column][/vc_row][vc_row][vc_column][vc_column_text]My Bias: long term bearish
Wave Structure: downward impulse wave
Long term wave count: lower in wave (3) red
Important risk events: EUR: German Prelim GDP q/q. USD: Retail Sales m/m, Empire State Manufacturing Index, Import Prices m/m.
Greetings to one and all!
I hope you had a great (or at least interesting) weekend!
I have been house bound, and a happy hostage of two little girls!
as my wife works long days and weekends.
There were some interesting developments today as you will see.
Lets start with EURUSD.
The price declined off the upper trendline today.
So wave ‘ii’ is possibly complete at the recent high.
The price did not cross 1.1748 just yet,
This is the level of the minor wave ‘b’ and the initial signal for a turn down in wave ‘iii’ pink.
wave ‘ii’ reached 1.1847, so this level must hold from here.
If the price breaks breaks 1.1748 and creates a lower high,
That action will suggest that wave ‘iii’ has begun.
A break of 1.1687 will confirm the fact.
For tomorrow;
Watch for a decline through 1.1748.
the Fibonacci target for wave ‘iii’ is at 1.1487.[/vc_column_text][/vc_column][/vc_row]
[/_s2If]
[_s2If current_user_can(access_s2member_ccap_gbpusd)]
[vc_row][vc_column][vc_separator border_width=”5″][/vc_column][/vc_row][vc_row][vc_column][vc_column_text]
GBPUSD
[/vc_column_text][/vc_column][/vc_row][vc_row][vc_column][vc_separator border_width=”5″][/vc_column][/vc_row][vc_row][vc_column width=”2/3″][vc_custom_heading text=”30 min” use_theme_fonts=”yes”][vc_column_text] [/vc_column_text][/vc_column][vc_column width=”1/3″][vc_custom_heading text=”4 Hours” use_theme_fonts=”yes”][vc_column_text]
 [/vc_column_text][vc_custom_heading text=”Daily” use_theme_fonts=”yes”][vc_column_text]
 [/vc_column_text][/vc_column][/vc_row][vc_row][vc_column][vc_column_text]My Bias: short below parity in wave (5).
Wave Structure: continuing impulsive structure to the downside in wave (5)
Long term wave count: decline in wave (5) blue, below parity
Important risk events: GBP: CPI y/y. USD: Retail Sales m/m, Empire State Manufacturing Index, Import Prices m/m.
The price never reached the target at 1.3053,
But instead turned down off fridays high.
So, there is a chance that wave ‘ii’ pink is complete at Fridays high.
A further break of support at 1.2931 will confirm it.
The alternate count allows for wave ‘ii’ to rally in three waves o a further high above resistance.
For tomorrow;
If 1.3031 holds, and the price again declines below support,
That will signal that wave ‘iii’ pink has begun and that further lows will follow.
The Fibonacci target for wave ‘iii’ pink lies at 1.2645.[/vc_column_text][/vc_column][/vc_row]
[/_s2If]
[_s2If current_user_can(access_s2member_ccap_usdjpy)]
[vc_row][vc_column][vc_separator border_width=”5″][/vc_column][/vc_row][vc_row][vc_column][vc_column_text]
USDJPY
[/vc_column_text][/vc_column][/vc_row][vc_row][vc_column][vc_separator border_width=”5″][/vc_column][/vc_row][vc_row][vc_column width=”2/3″][vc_custom_heading text=”30 min” use_theme_fonts=”yes”][vc_column_text] [/vc_column_text][/vc_column][vc_column width=”1/3″][vc_custom_heading text=”4 Hours” use_theme_fonts=”yes”][vc_column_text]
 [/vc_column_text][vc_custom_heading text=”Daily” use_theme_fonts=”yes”][vc_column_text]
 [/vc_column_text][/vc_column][/vc_row][vc_row][vc_column][vc_column_text]My Bias: LONG
Wave Structure: rally in wave [C]
Long term wave count: wave [C] is underway, upside to above 136.00
Important risk events: JPY: N/A. USD: Retail Sales m/m, Empire State Manufacturing Index, Import Prices m/m.
I have been on the look out for a bullish signal in USDJPY and a turn into a very large wave [iii] for a couple of weeks now.
We have had a few false signals recently as the price closes out the correction in wave [ii] grey.
Todays action is another positive sign,
The market has rallied in an impulsive form
and is on the verge of completing five waves up in a a possible wave ‘1’ pink.
If this current price action creates fives waves up,
followed by a corrective, three wave decline,
That will form another bullish elliott wave signal.
And an early indication that the bottom is finally in for USDJPY.
The 4hr RSI has again reached the centreline from an over sold position,
Indicating that momentum has turned up again.
For tomorrow;
Watch for the completion of a five wave pattern in wave ‘1’ pink.
A break of 111.05 will confirm the end of the correction.[/vc_column_text][/vc_column][/vc_row]
[/_s2If]
[_s2If current_user_can(access_s2member_ccap_dow_jones)]
[vc_row][vc_column][vc_separator][/vc_column][/vc_row][vc_row][vc_column][vc_column_text]
DOW JONES INDUSTRIALS
[/vc_column_text][/vc_column][/vc_row][vc_row][vc_column][vc_separator][/vc_column][/vc_row][vc_row][vc_column width=”2/3″][vc_custom_heading text=”30 min” use_theme_fonts=”yes”][vc_column_text] [/vc_column_text][/vc_column][vc_column width=”1/3″][vc_custom_heading text=”4 Hours” use_theme_fonts=”yes”][vc_column_text]
 [/vc_column_text][vc_custom_heading text=”Daily” use_theme_fonts=”yes”][vc_column_text]
 [/vc_column_text][/vc_column][/vc_row][vc_row][vc_column][vc_column_text]My Bias: market topping process ongoing
Wave Structure: Impulsive 5 wave structure, possibly topping in an all time high.
Long term wave count: Topping in wave (5)
Important risk events: USD: Retail Sales m/m, Empire State Manufacturing Index, Import Prices m/m.
Todays rally in the DOW suggests that the price is moving at a higher degree wave (ii) grey.
I have relabeled the decline as a complete wave (i) grey,
With wave (ii) possibly complete at the high of the day.
The price has retreated below the 22000 level again this evening,
That level may well act as resistance from here on.
22046 marks the 61.8% retracement level, and the previous wave ‘ii’ lies at 22059.
So this forms a solid zone of resistance to any advance.
For tomorrow;
A break of resistance will cast doubt over the short term bearish stance.
Watch for a decline into 21909,
If the price crosses below this level, it will indicate that wave ‘i’ of (iii) is underway.[/vc_column_text][/vc_column][/vc_row]
[/_s2If]
[_s2If current_user_can(access_s2member_ccap_gold)]
[vc_row][vc_column][vc_separator][/vc_column][/vc_row][vc_row][vc_column][vc_column_text]
GOLD
[/vc_column_text][/vc_column][/vc_row][vc_row][vc_column][vc_separator][/vc_column][/vc_row][vc_row][vc_column width=”2/3″][vc_custom_heading text=”30 min” use_theme_fonts=”yes”][vc_column_text] [/vc_column_text][/vc_column][vc_column width=”1/3″][vc_custom_heading text=”4 Hours” use_theme_fonts=”yes”][vc_column_text]
 [/vc_column_text][vc_custom_heading text=”Daily” use_theme_fonts=”yes”][vc_column_text]
 [/vc_column_text][/vc_column][/vc_row][vc_row][vc_column][vc_column_text]My Bias: Long towards 1550
Wave Structure: ZigZag correction to the upside.
Long term wave count: Topping in wave (B) at 1550
Important risk events: USD: Retail Sales m/m, Empire State Manufacturing Index, Import Prices m/m.
GOLD declined into the lower trendline as expected today.
The low of the day so far is at 1278.55.
The rise off the low does not look impulsive,
So wave ‘ii’ may be about to extend into a larger structure.
If that is the case, 1271 will act as support for a larger wave ‘ii’.
A further rally above 1291.92 will signal wave ‘iii’ brown has begun.
For tomorrow;
Watch for todays low at 1278 to remain intact.
A break of that low will signal a larger wave ‘ii’ is developing.
[/vc_column_text][/vc_column][/vc_row]
[/_s2If]