
[_s2If current_user_can(access_s2member_ccap_eurusd)]
[vc_row][vc_column][vc_separator border_width=”5″][/vc_column][/vc_row][vc_row][vc_column][vc_column_text]
EURUSD
[/vc_column_text][/vc_column][/vc_row][vc_row][vc_column][vc_separator border_width=”5″][/vc_column][/vc_row][vc_row][vc_column width=”2/3″][vc_custom_heading text=”30 min” use_theme_fonts=”yes”][vc_column_text]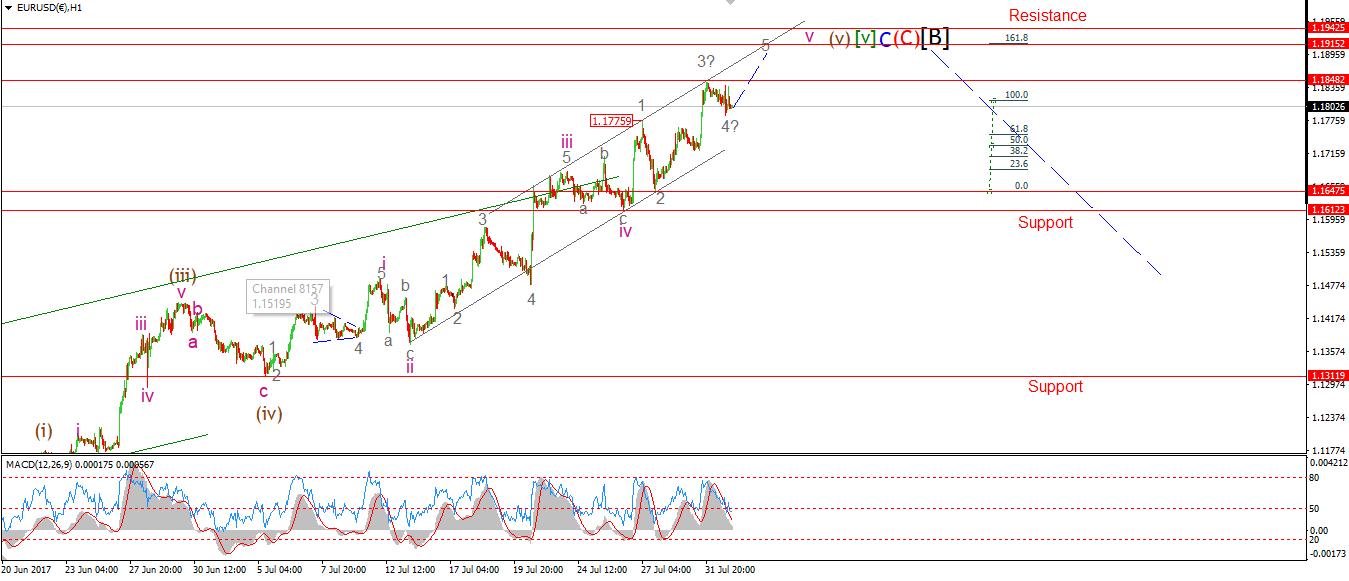 [/vc_column_text][/vc_column][vc_column width=”1/3″][vc_custom_heading text=”4 Hours” use_theme_fonts=”yes”][vc_column_text]
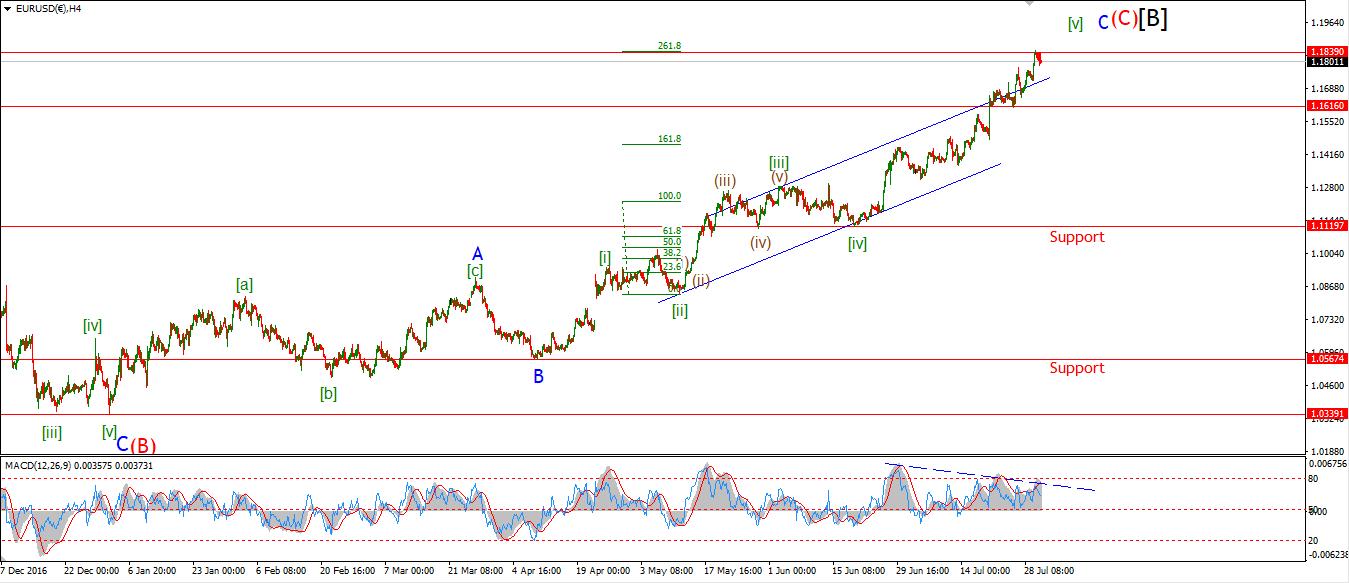 [/vc_column_text][vc_custom_heading text=”Daily” use_theme_fonts=”yes”][vc_column_text]
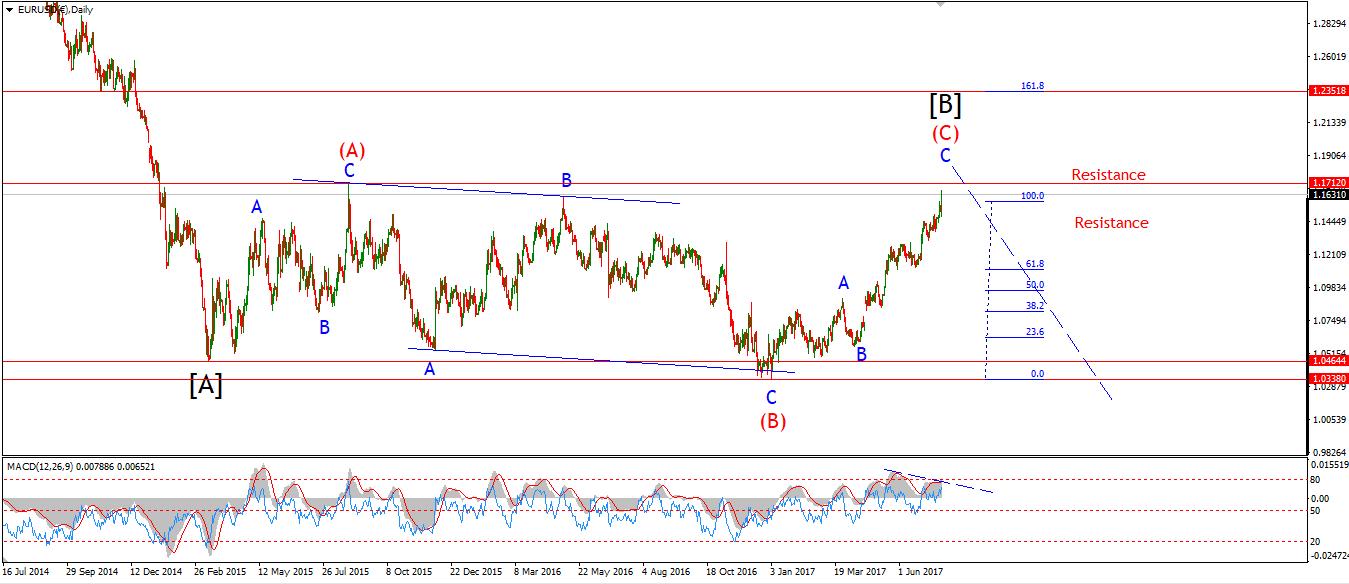 [/vc_column_text][/vc_column][/vc_row][vc_row][vc_column][vc_column_text]My Bias: long term bearish
Wave Structure: downward impulse wave
Long term wave count: lower in wave (3) red
Important risk events: EUR: Spanish Unemployment Change. USD: ADP Non-Farm Employment Change, Crude Oil Inventories.
Good evening to one and all!
It has been a scorcher here today, and the annual racing festival is in full swing.
So the town is steeped in a party atmosphere these days.
The EURUSD party is coming to an end at seven degrees of trend right now.
I have been asked why this rally has persisted much further than I expected.
The answer lies in the high number of degrees in operation here.
As the structure has progressed,
each lower degree of trend has extended.
Thereby pushing the structre higher and higher.
But, the extended nature of this structure leaves it open to a quick collapse.
And that is worth keeping in mind as wave ‘5’ grey completes this week.
Back to the action.
The price corrected today in a possible wave ‘4’ grey,
This leaves wave ‘5’ grey left to complete the larger structure.
the upper trend line is coming into focus now.
The target range for wave ‘5’ grey lies between 1.1915 and 1.1942.
So, for tomorrow;
Watch for another rise into the upper trendline.
I will be interested to see how the price reacts to the target range resistance.[/vc_column_text][/vc_column][/vc_row]
[/_s2If]
[_s2If current_user_can(access_s2member_ccap_gbpusd)]
[vc_row][vc_column][vc_separator border_width=”5″][/vc_column][/vc_row][vc_row][vc_column][vc_column_text]
GBPUSD
[/vc_column_text][/vc_column][/vc_row][vc_row][vc_column][vc_separator border_width=”5″][/vc_column][/vc_row][vc_row][vc_column width=”2/3″][vc_custom_heading text=”30 min” use_theme_fonts=”yes”][vc_column_text] [/vc_column_text][/vc_column][vc_column width=”1/3″][vc_custom_heading text=”4 Hours” use_theme_fonts=”yes”][vc_column_text]
 [/vc_column_text][vc_custom_heading text=”Daily” use_theme_fonts=”yes”][vc_column_text]
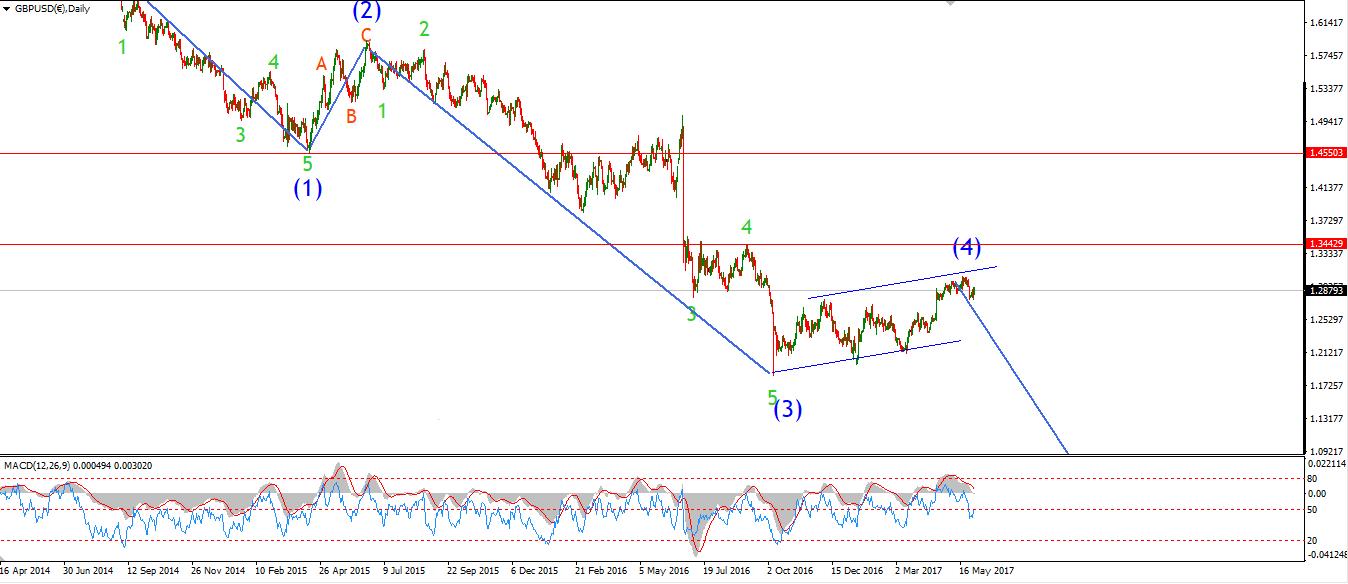 [/vc_column_text][/vc_column][/vc_row][vc_row][vc_column][vc_column_text]My Bias: short below parity in wave (5).
Wave Structure: continuing impulsive structure to the downside in wave (5)
Long term wave count: decline in wave (5) blue, below parity
Important risk events: GBP: Construction PMI. USD: ADP Non-Farm Employment Change, Crude Oil Inventories.
Cable reached a high of 1.3244 today.
The target was set at 1.3250,
so we are in range for a top to form in the next few days.
As it stands, wave ‘c’ pink has reached equality with wave ‘a’ pink as shown on the short term chart.
The first major support level lies at 1.3124.
If the price croses below this point,
That will be the initial signal that a top is in place.
On the 4hr chart,
There is now a bearish divergence in place with four lower highs in the RSI.
Which came off an extreme high in momentum.
This is the biggest indication that a significant decline is in the making.
For tomorrow;
Watch for the upper trend line of the short term trend channel to repel the price structure.
Lets see if we get an impulsive looking decline that we can work with.[/vc_column_text][/vc_column][/vc_row]
[/_s2If]
[_s2If current_user_can(access_s2member_ccap_usdjpy)]
[vc_row][vc_column][vc_separator border_width=”5″][/vc_column][/vc_row][vc_row][vc_column][vc_column_text]
USDJPY
[/vc_column_text][/vc_column][/vc_row][vc_row][vc_column][vc_separator border_width=”5″][/vc_column][/vc_row][vc_row][vc_column width=”2/3″][vc_custom_heading text=”30 min” use_theme_fonts=”yes”][vc_column_text] [/vc_column_text][/vc_column][vc_column width=”1/3″][vc_custom_heading text=”4 Hours” use_theme_fonts=”yes”][vc_column_text]
 [/vc_column_text][vc_custom_heading text=”Daily” use_theme_fonts=”yes”][vc_column_text]
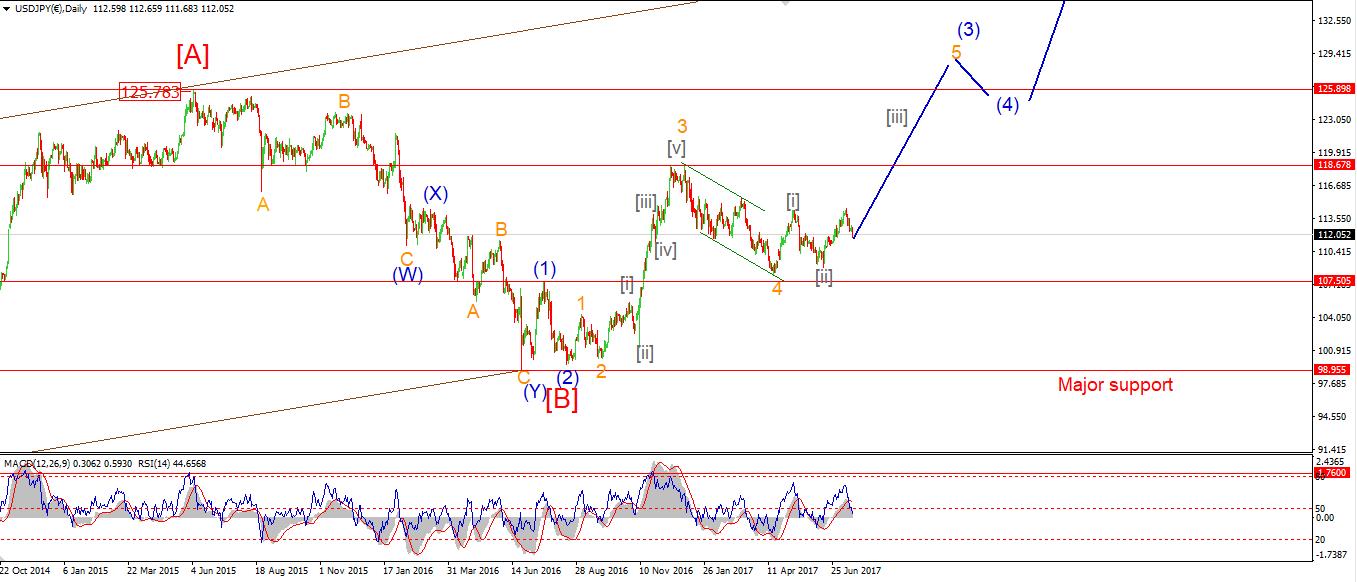 [/vc_column_text][/vc_column][/vc_row][vc_row][vc_column][vc_column_text]My Bias: LONG
Wave Structure: rally in wave [C]
Long term wave count: wave [C] is underway, upside to above 136.00
Important risk events: JPY: N/A. USD: ADP Non-Farm Employment Change, Crude Oil Inventories.
USDJPY ended flat after todays session which has killed downside momentum totally.
The 4hr RSI is now pointing upwards again and on the verge of another bullish upside centreline cross.
From here on,
The lower trendline of the trend channel must begin to act as a support for the price.
We need to see the price push back into above those previous swing lows,
The low of wave ‘a’ at 110.60 should switch from resistance to support after a new bullish Elliott wave signal
For tomorrow;
Watch for a rise above 11060 in an impulsive fashion.[/vc_column_text][/vc_column][/vc_row]
[/_s2If]
[_s2If current_user_can(access_s2member_ccap_dow_jones)]
[vc_row][vc_column][vc_separator][/vc_column][/vc_row][vc_row][vc_column][vc_column_text]
DOW JONES INDUSTRIALS
[/vc_column_text][/vc_column][/vc_row][vc_row][vc_column][vc_separator][/vc_column][/vc_row][vc_row][vc_column width=”2/3″][vc_custom_heading text=”30 min” use_theme_fonts=”yes”][vc_column_text]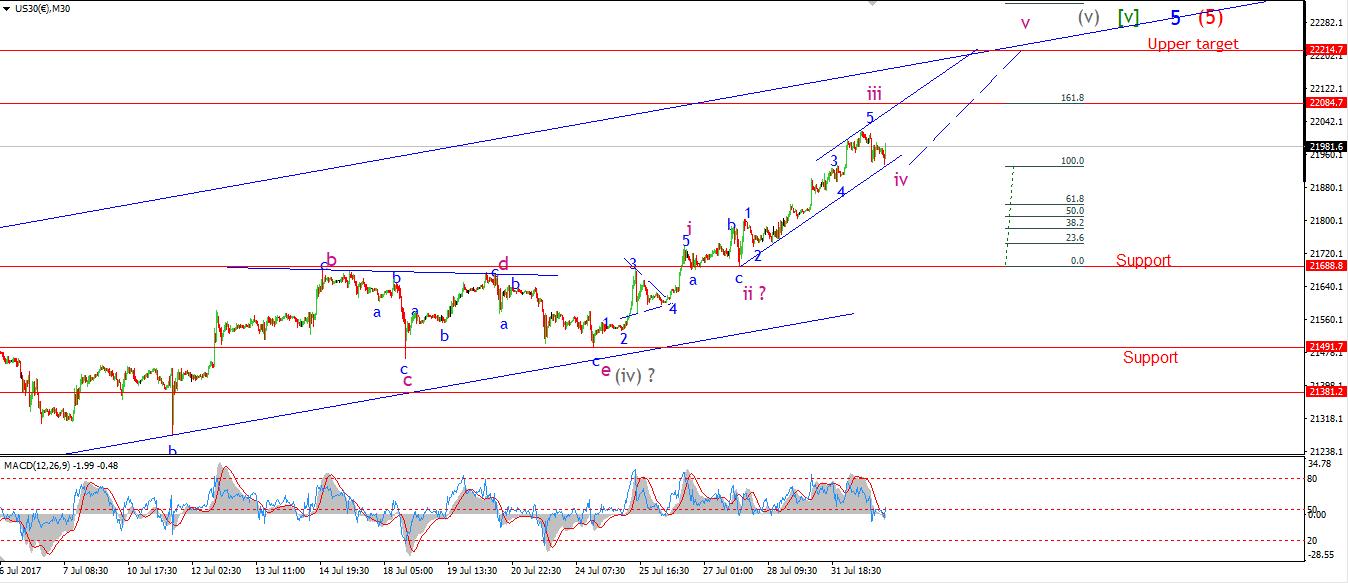 [/vc_column_text][/vc_column][vc_column width=”1/3″][vc_custom_heading text=”4 Hours” use_theme_fonts=”yes”][vc_column_text]
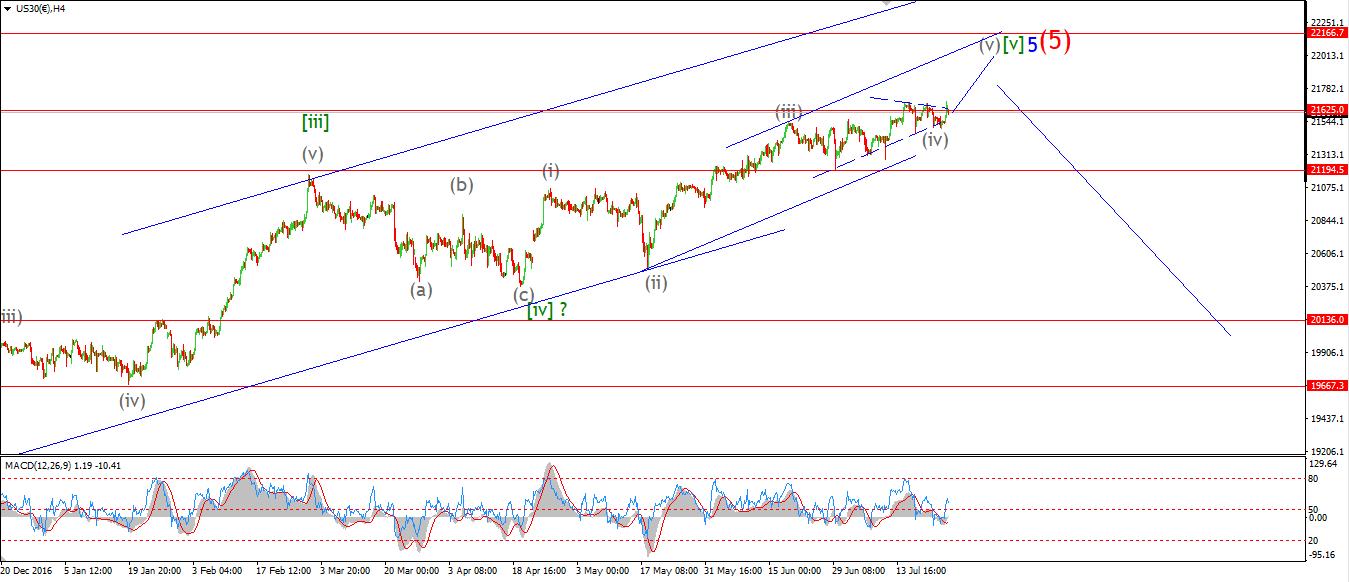 [/vc_column_text][vc_custom_heading text=”Daily” use_theme_fonts=”yes”][vc_column_text]
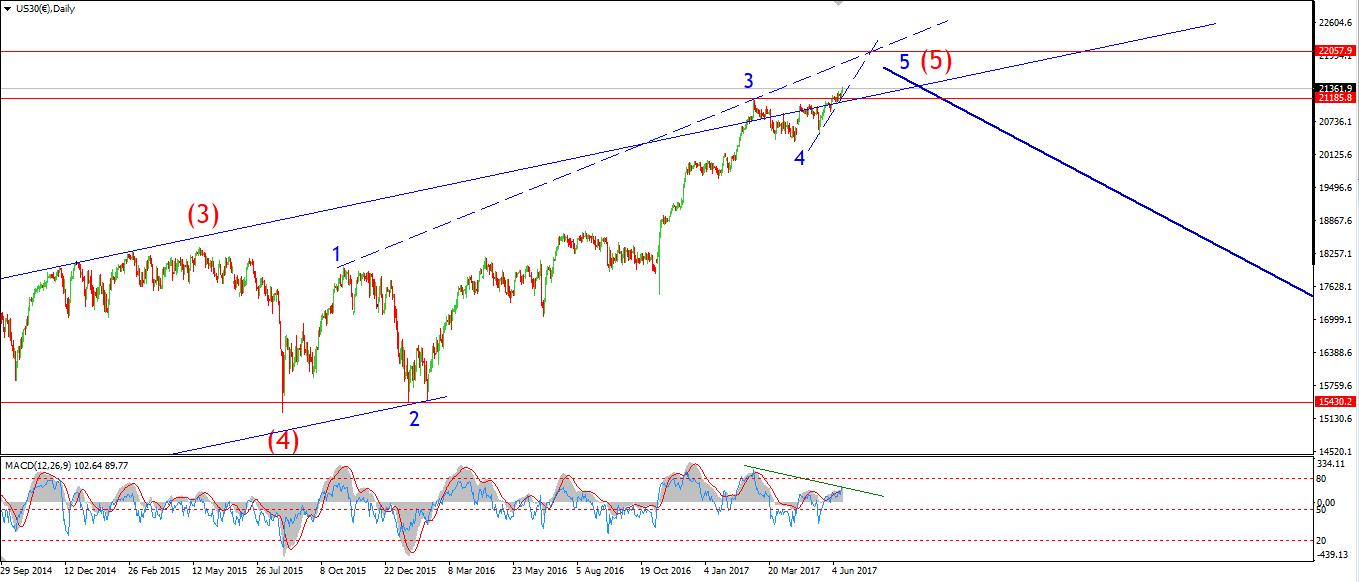 [/vc_column_text][/vc_column][/vc_row][vc_row][vc_column][vc_column_text]My Bias: market topping process ongoing
Wave Structure: Impulsive 5 wave structure, possibly topping in an all time high.
Long term wave count: Topping in wave (5)
Important risk events: USD: ADP Non-Farm Employment Change, Crude Oil Inventories.
The US30 CFD broke 22000 today, the cash market reached a high of 21986.
And the declines this afternoon again look corrective.
I have labelled the decline as wave ‘iv’ pink,
Which leaves a further rise in wave ‘v’ to follow into the upper trendline.
A likely target for wave ‘v’ pink is at the upper trendline of the rising trend channel.
This could take the price up to about 22200 before completing the larger structure.
On the 4hr chart you can clearly see a bearish head and shoulders pattern which is now half way to completion.
this is a time tested indication of a topping market,
So I will monitor the progression from this point on.
The 4hr RSI has turned down from an extreme level in an indication of a topping momentum.
yesterdays high was 82.88.
A reading not seen since early march.
For tomorrow;
Watch for wave ‘iv’ to complete and wave ‘v’ pink to begin.[/vc_column_text][/vc_column][/vc_row]
[/_s2If]
[_s2If current_user_can(access_s2member_ccap_gold)]
[vc_row][vc_column][vc_separator][/vc_column][/vc_row][vc_row][vc_column][vc_column_text]
GOLD
[/vc_column_text][/vc_column][/vc_row][vc_row][vc_column][vc_separator][/vc_column][/vc_row][vc_row][vc_column width=”2/3″][vc_custom_heading text=”30 min” use_theme_fonts=”yes”][vc_column_text] [/vc_column_text][/vc_column][vc_column width=”1/3″][vc_custom_heading text=”4 Hours” use_theme_fonts=”yes”][vc_column_text]
 [/vc_column_text][vc_custom_heading text=”Daily” use_theme_fonts=”yes”][vc_column_text]
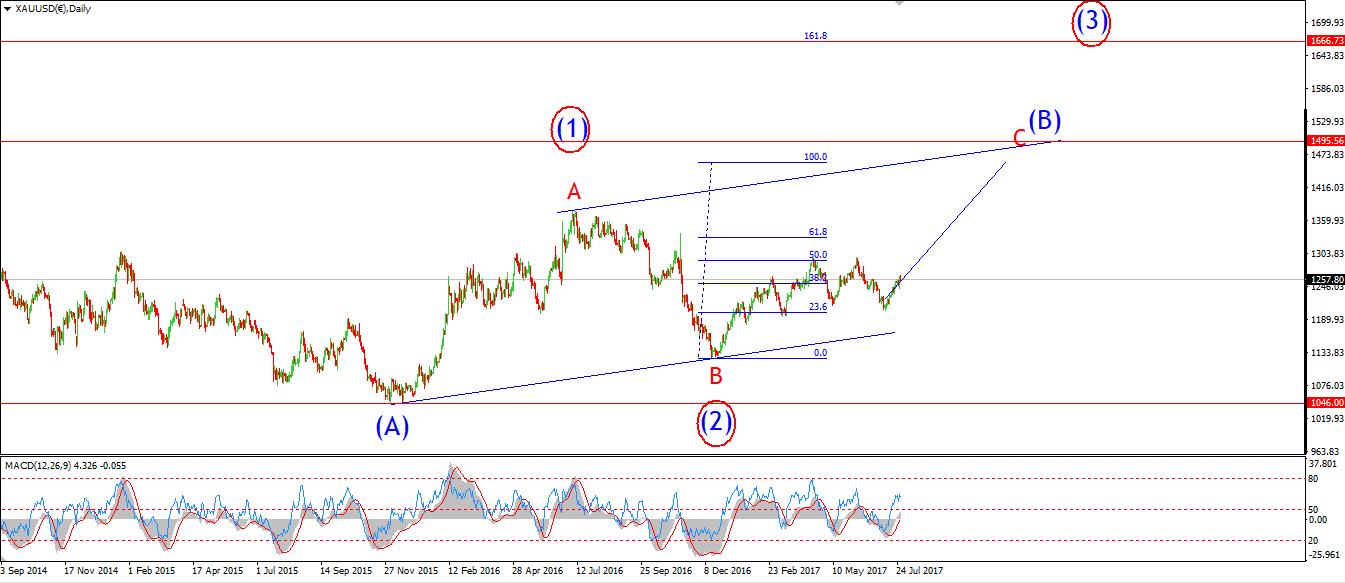 [/vc_column_text][/vc_column][/vc_row][vc_row][vc_column][vc_column_text]My Bias: Long towards 1550
Wave Structure: ZigZag correction to the upside.
Long term wave count: Topping in wave (B) at 1550
Important risk events: USD: ADP Non-Farm Employment Change, Crude Oil Inventories.
GOLD popped higher after a brief flat correction.
Wave ‘2’ pink is possibly complete at the lows of the day of 1262.
The fact that the price rose impulsively off todays low adds weight to the idea that wave ‘3’ pink has begun.
If the current interpretation is correct, then the price is now rising in wave ‘3’ of ‘iii’.
The probability that wave ‘iii’ will break above 1300 is quite high.
The Fibonacci extension of wave ‘i’ projects a target for wave ‘iii’ at 1330.
For tomorrow,
Watch for the low of wave ‘2’ pink to hold and for a rise above the upper trendline as wave ‘3’ takes hold.[/vc_column_text][/vc_column][/vc_row]
[/_s2If]