
[_s2If current_user_can(access_s2member_ccap_eurusd)]
[vc_row][vc_column][vc_separator border_width=”5″][/vc_column][/vc_row][vc_row][vc_column][vc_column_text]
EURUSD
[/vc_column_text][/vc_column][/vc_row][vc_row][vc_column][vc_separator border_width=”5″][/vc_column][/vc_row][vc_row][vc_column width=”2/3″][vc_custom_heading text=”30 min” use_theme_fonts=”yes”][vc_column_text] [/vc_column_text][/vc_column][vc_column width=”1/3″][vc_custom_heading text=”4 Hours” use_theme_fonts=”yes”][vc_column_text]
 [/vc_column_text][vc_custom_heading text=”Daily” use_theme_fonts=”yes”][vc_column_text]
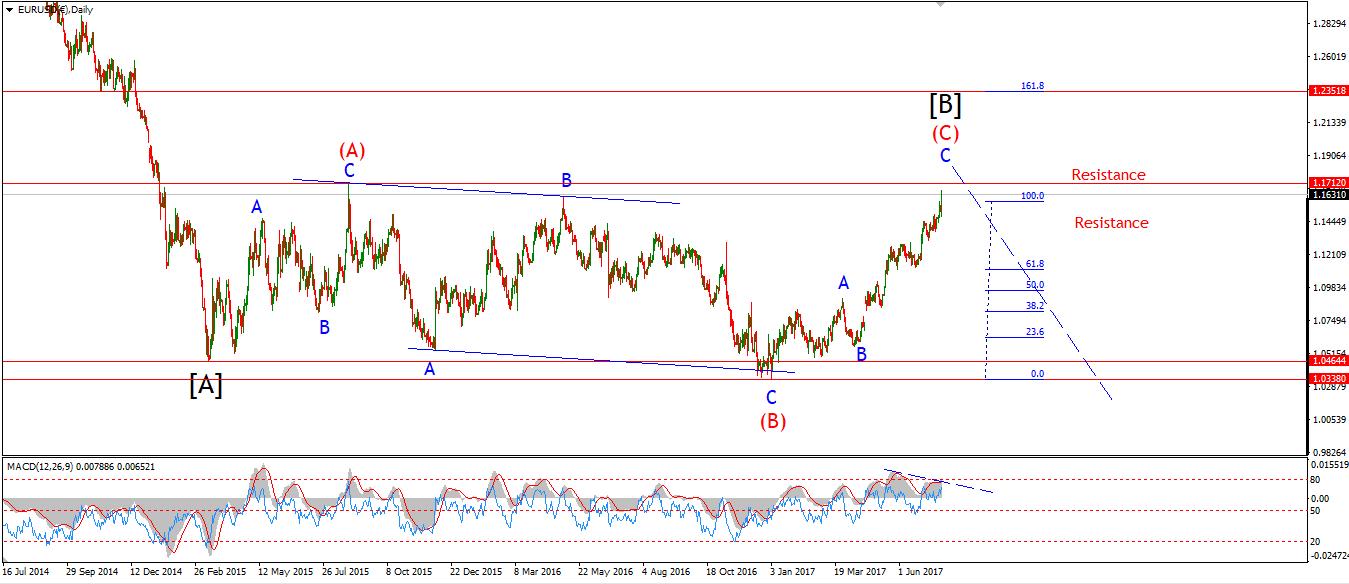 [/vc_column_text][/vc_column][/vc_row][vc_row][vc_column][vc_column_text]My Bias: long term bearish
Wave Structure: downward impulse wave
Long term wave count: lower in wave (3) red
Important risk events: EUR: Spanish Unemployment Rate, M3 Money Supply y/y. USD: Core Durable Goods Orders m/m, Unemployment Claims.
Hola mi amigos!
Heres how I read this evenings reaction to the FED statement.
Use any reason you can find to sell the dollar,
even a shift to normalization of policy,
which is actually a positive for the dollar, – but this time we will use it to justify selling!
‘Rational’ markets!
The short term wave count took another hit today.
this evenings spike now takes the wave ‘5’ label.
Wave ‘4’ grey seems to have taken the form of an expanded flat correction.
This evenings rally has not traced out five waves just yet.
Wave ‘5’ grey might reach 1.1782,
Where the price reaches the 161.8% extension of wave ‘1’ grey.
The 4hr RSI has risen to meet the downward trend line again.
If this trendline holds,
the divergence will be extreme.
And the top remains very much in sight.
The price topped 1.1712 today,
This is the high of wave (A) red on the daily chart.
This correction now qualifies as an expanded flat wave [B] black.
1.1611 remains the point of focus for a turn back down into trend.[/vc_column_text][/vc_column][/vc_row]
[/_s2If]
[_s2If current_user_can(access_s2member_ccap_gbpusd)]
[vc_row][vc_column][vc_separator border_width=”5″][/vc_column][/vc_row][vc_row][vc_column][vc_column_text]
GBPUSD
[/vc_column_text][/vc_column][/vc_row][vc_row][vc_column][vc_separator border_width=”5″][/vc_column][/vc_row][vc_row][vc_column width=”2/3″][vc_custom_heading text=”30 min” use_theme_fonts=”yes”][vc_column_text] [/vc_column_text][/vc_column][vc_column width=”1/3″][vc_custom_heading text=”4 Hours” use_theme_fonts=”yes”][vc_column_text]
 [/vc_column_text][vc_custom_heading text=”Daily” use_theme_fonts=”yes”][vc_column_text]
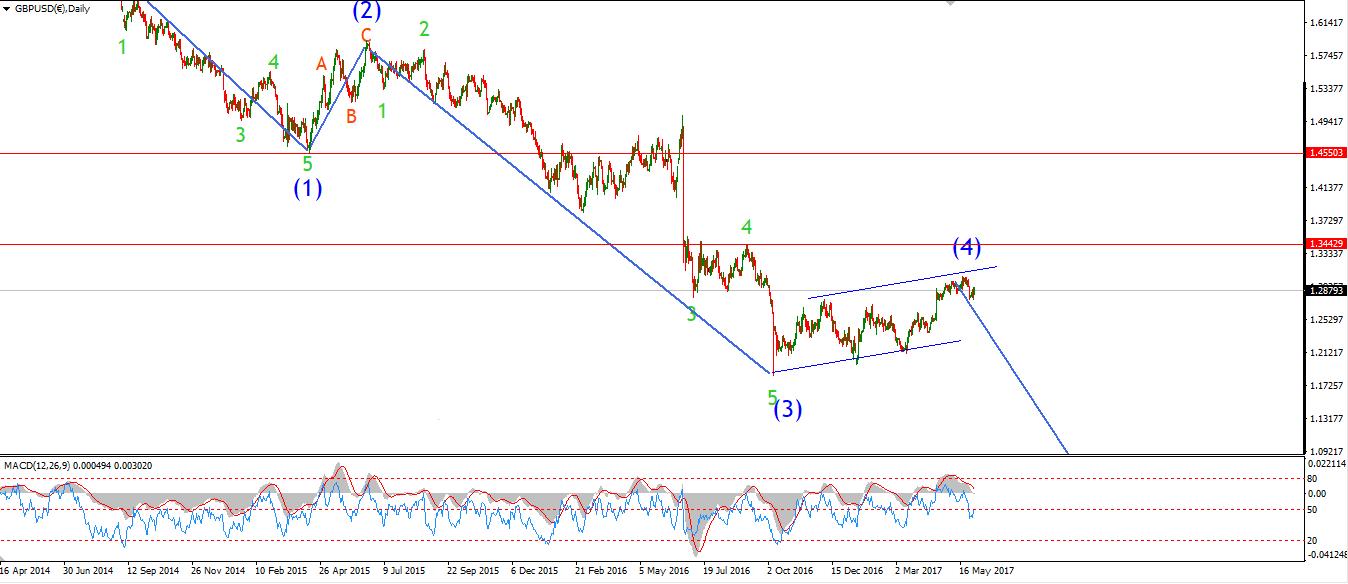 [/vc_column_text][/vc_column][/vc_row][vc_row][vc_column][vc_column_text]My Bias: short below parity in wave (5).
Wave Structure: continuing impulsive structure to the downside in wave (5)
Long term wave count: decline in wave (5) blue, below parity
Important risk events: GBP: N/A. USD: Core Durable Goods Orders m/m, Unemployment Claims.
Cable rallied also today in what could be wave ‘3’ grey.
So far the best way to count the rise is:
A leading diagonal wave ‘1’
expanded flat wave ‘2’
Wave ‘3’ should trace out a clear 5 wave pattern,
The initial target for wave ‘3’ grey lies at 1.3205.
Where wave ‘3’ reaches 161.8% of wave ‘1’ grey.
The price has not yet broken the high of wave ‘a’ pink at 1.3124.
a break of this level confirms the larger pattern of a three wave correction higher.
For tomorrow;
watch for the high at wave ‘1’ grey to hold at 1.3057.
And the rally to continue in wave ‘3’.[/vc_column_text][/vc_column][/vc_row]
[/_s2If]
[_s2If current_user_can(access_s2member_ccap_usdjpy)]
[vc_row][vc_column][vc_separator border_width=”5″][/vc_column][/vc_row][vc_row][vc_column][vc_column_text]
USDJPY
[/vc_column_text][/vc_column][/vc_row][vc_row][vc_column][vc_separator border_width=”5″][/vc_column][/vc_row][vc_row][vc_column width=”2/3″][vc_custom_heading text=”30 min” use_theme_fonts=”yes”][vc_column_text] [/vc_column_text][/vc_column][vc_column width=”1/3″][vc_custom_heading text=”4 Hours” use_theme_fonts=”yes”][vc_column_text]
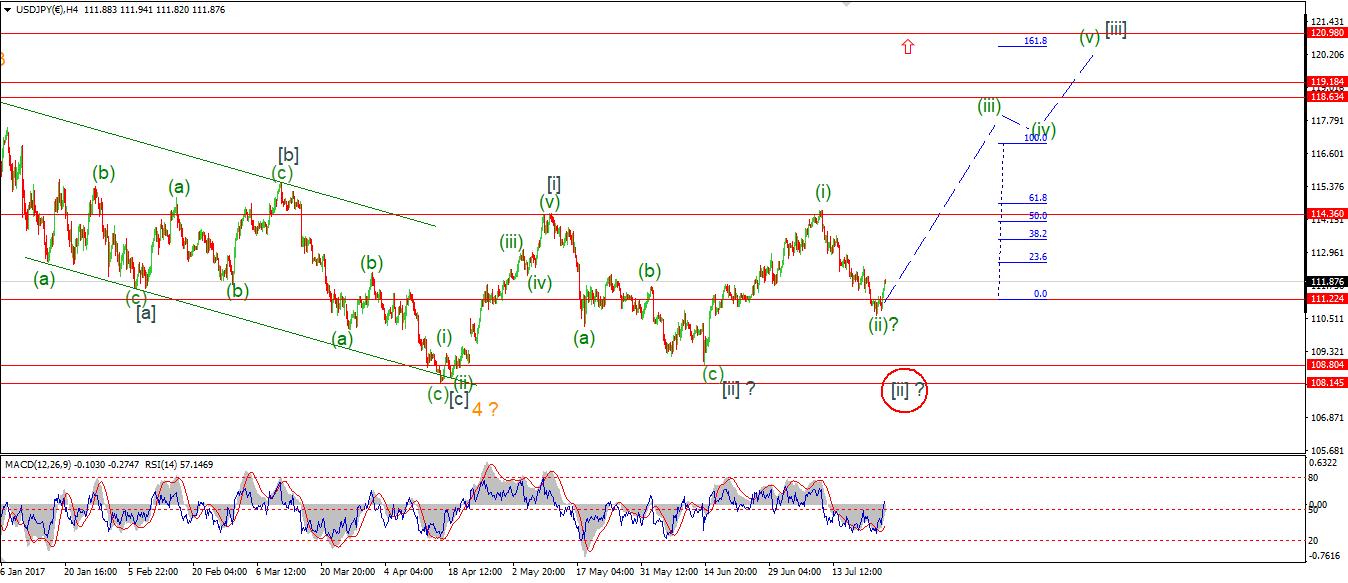 [/vc_column_text][vc_custom_heading text=”Daily” use_theme_fonts=”yes”][vc_column_text]
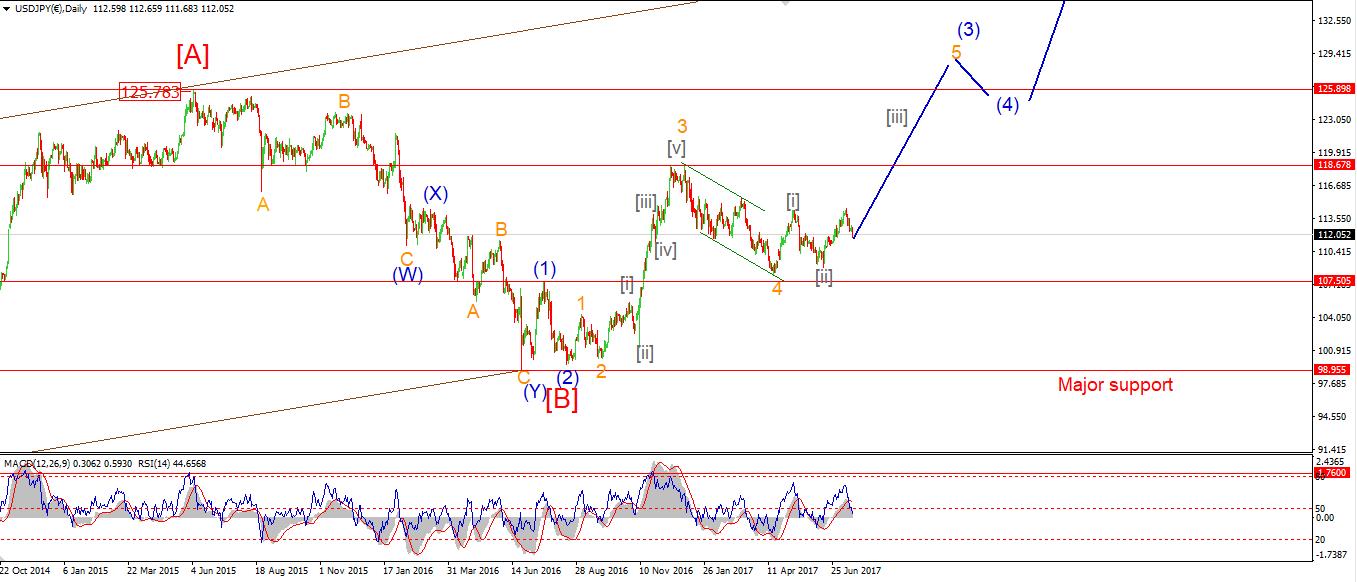 [/vc_column_text][/vc_column][/vc_row][vc_row][vc_column][vc_column_text]My Bias: LONG
Wave Structure: rally in wave [C]
Long term wave count: wave [C] is underway, upside to above 136.00
Important risk events: JPY: N/A. USD: Core Durable Goods Orders m/m, Unemployment Claims.
So far the decline in USDJPY is viewed as a corrective decline in wave ‘2’ pink.
The rise off the lows at 110.63 is best counted as a 5 wave structure.
So;
If the low at 110.63 holds and the price recovers overnight,
Then this evenings lows may have formed a complete elliott wave bullish signal.
For tomorrow;
Watch for the price to rise above 1.1164 and hold above that level.
If the price breaks the high at wave ‘1’ again,
It will confirm wave ‘3’ pink is underway.[/vc_column_text][/vc_column][/vc_row]
[/_s2If]
[_s2If current_user_can(access_s2member_ccap_dow_jones)]
[vc_row][vc_column][vc_separator][/vc_column][/vc_row][vc_row][vc_column][vc_column_text]
DOW JONES INDUSTRIALS
[/vc_column_text][/vc_column][/vc_row][vc_row][vc_column][vc_separator][/vc_column][/vc_row][vc_row][vc_column width=”2/3″][vc_custom_heading text=”30 min” use_theme_fonts=”yes”][vc_column_text] [/vc_column_text][/vc_column][vc_column width=”1/3″][vc_custom_heading text=”4 Hours” use_theme_fonts=”yes”][vc_column_text]
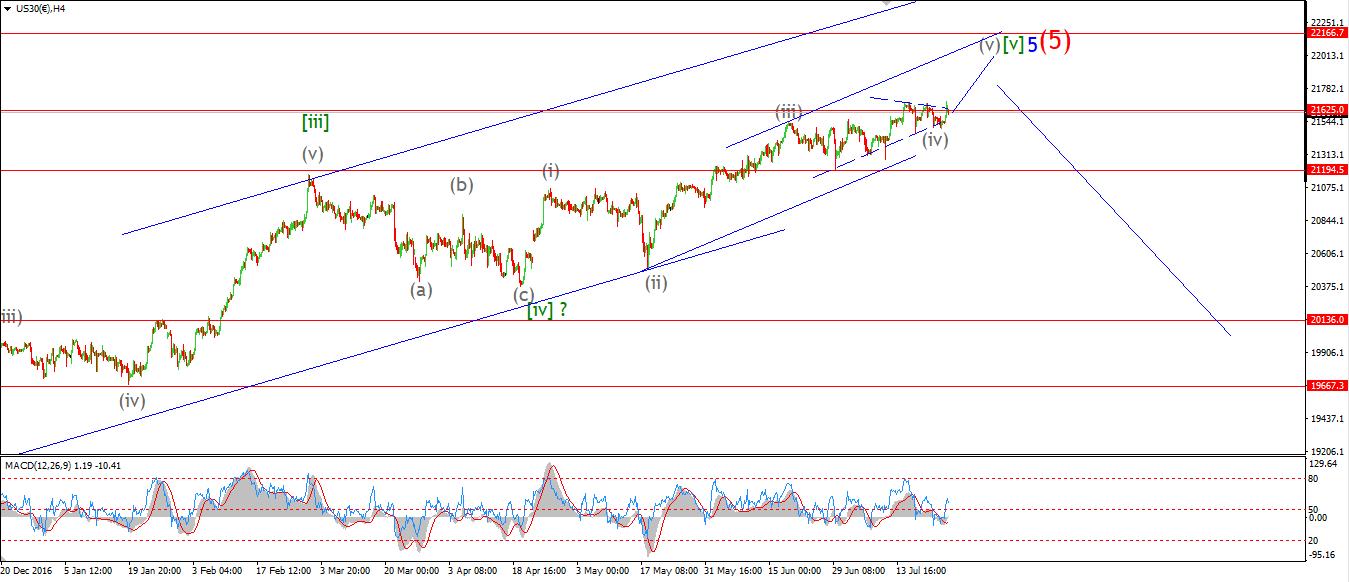 [/vc_column_text][vc_custom_heading text=”Daily” use_theme_fonts=”yes”][vc_column_text]
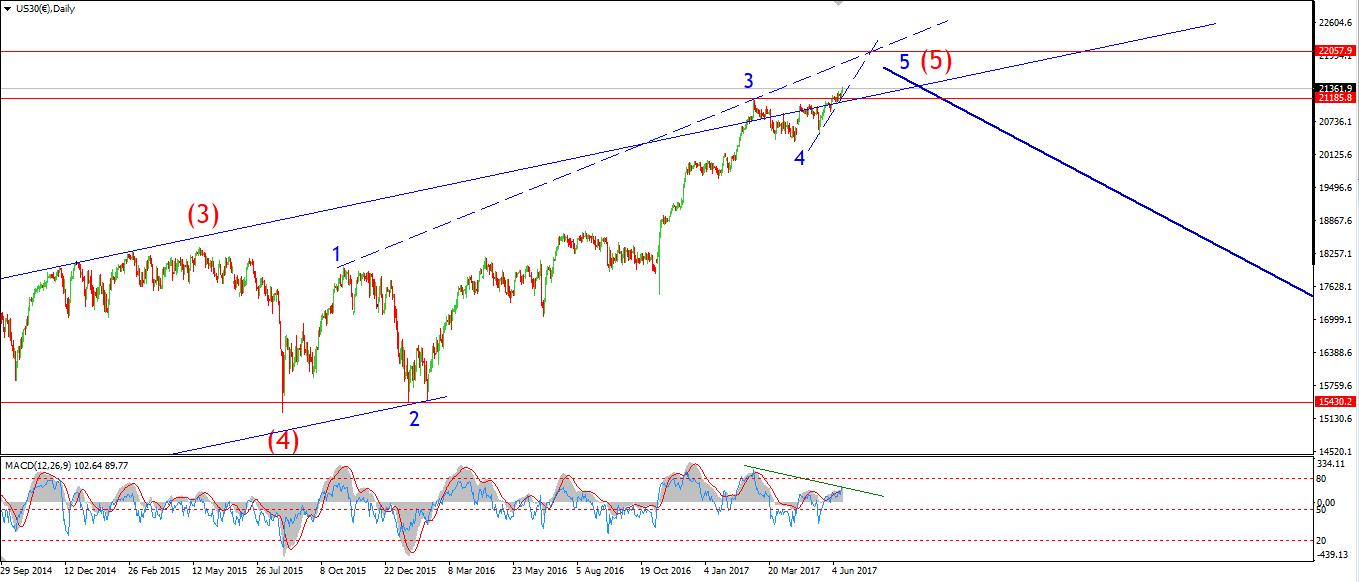 [/vc_column_text][/vc_column][/vc_row][vc_row][vc_column][vc_column_text]My Bias: market topping process ongoing
Wave Structure: Impulsive 5 wave structure, possibly topping in an all time high.
Long term wave count: Topping in wave (5)
Important risk events: USD: Core Durable Goods Orders m/m, Unemployment Claims.
The short term price structure developed further today, into a clear five wave rally,
Which I have labelled wave ‘i’ pink.
The internal structure is labelled in blue with a contracting triangle wave ‘4’ blue.
wave ‘4’ blue completed at 21597,
And wave ‘5’ blue broke out to new all time highs again this afternoon.
As the session closes,
It is likely that wave ‘ii’ pink has begun.
Initial support lies at 21597 again.
For tomorrow;
We can expect a decline into wave ‘ii’ pink.
it may be brief, given the overwhelming bullishness on display.
The revised target for wave ‘iii’ pink is at 21888, where the 161.8% extension of wave ‘i’ is reached.[/vc_column_text][/vc_column][/vc_row]
[/_s2If]
[_s2If current_user_can(access_s2member_ccap_gold)]
[vc_row][vc_column][vc_separator][/vc_column][/vc_row][vc_row][vc_column][vc_column_text]
GOLD
[/vc_column_text][/vc_column][/vc_row][vc_row][vc_column][vc_separator][/vc_column][/vc_row][vc_row][vc_column width=”2/3″][vc_custom_heading text=”30 min” use_theme_fonts=”yes”][vc_column_text] [/vc_column_text][/vc_column][vc_column width=”1/3″][vc_custom_heading text=”4 Hours” use_theme_fonts=”yes”][vc_column_text]
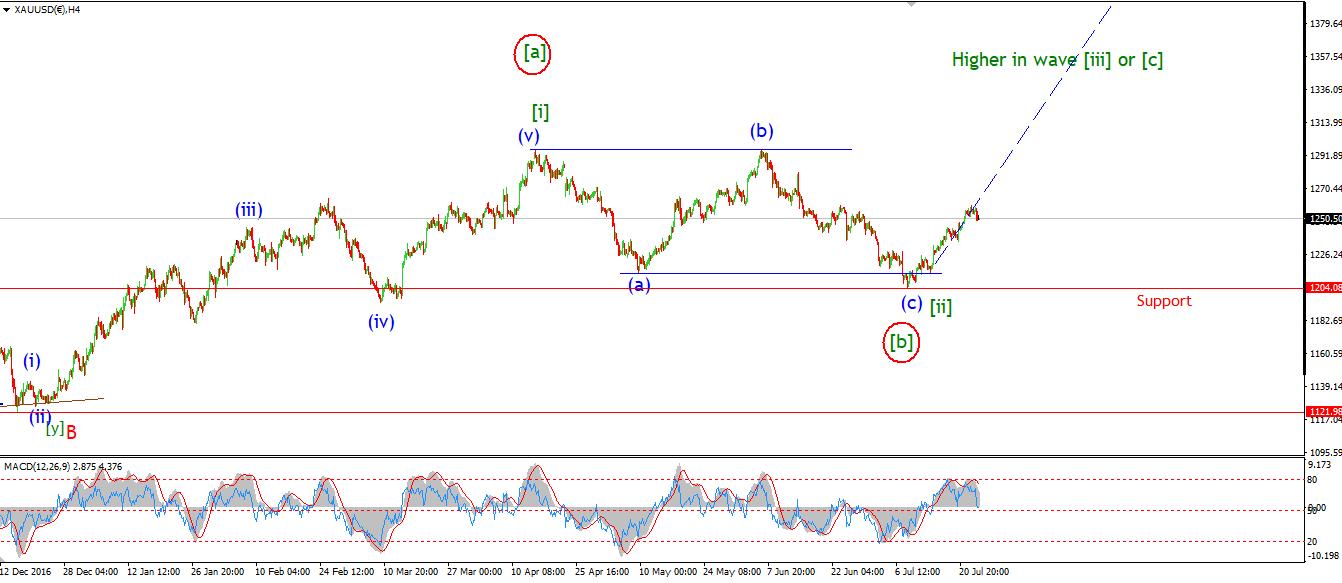 [/vc_column_text][vc_custom_heading text=”Daily” use_theme_fonts=”yes”][vc_column_text]
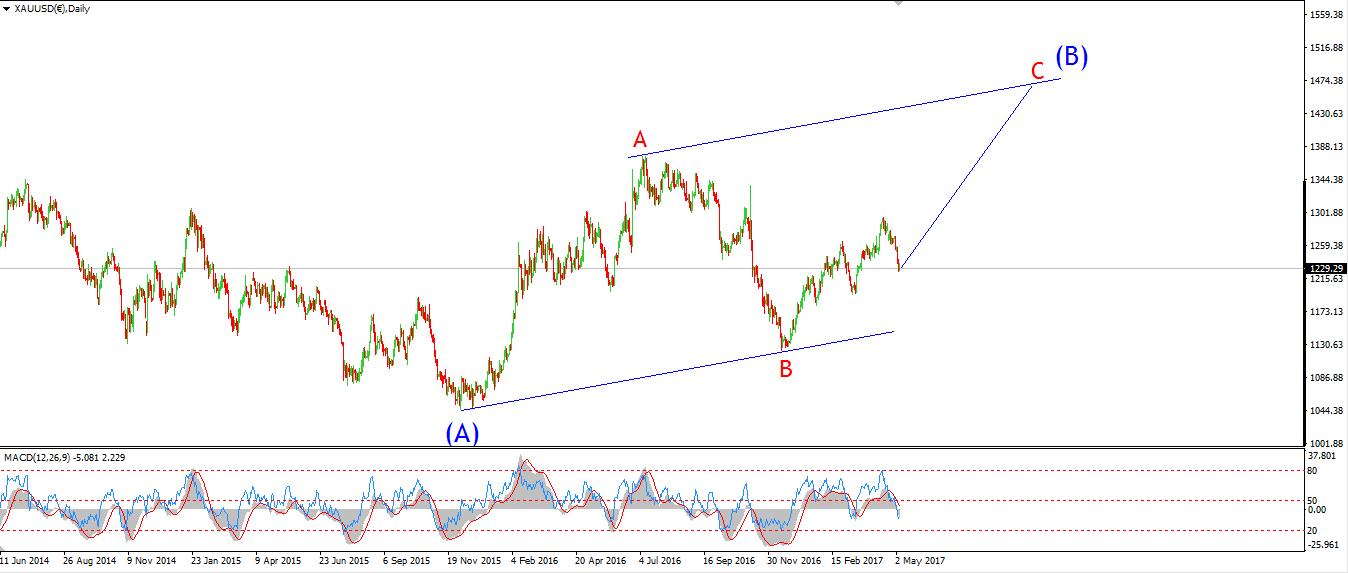 [/vc_column_text][/vc_column][/vc_row][vc_row][vc_column][vc_column_text]My Bias: Long towards 1550
Wave Structure: ZigZag correction to the upside.
Long term wave count: Topping in wave (B) at 1550
Important risk events: USD: Core Durable Goods Orders m/m, Unemployment Claims.
Wave ‘ii’ brown completed quickly today!
todays low reached 1243.70, and the price rocketed $20 higher off that point.
The alternate short term wave count is shown circled in red,
This views wave ‘ii’ brown as an expanded flat correction.
To rule out this idea,
The price must hold above todays low at 1243.70.
If wave ‘iii’ brown is in fact underway,
Then it shouldn’t be long before the price takes out the wave [i] high at 1295.
For tomorrow;
watch for the price to again meet the upper trendline before any correction in wave ‘2’ pink.[/vc_column_text][/vc_column][/vc_row]
[/_s2If]