
[vc_row][vc_column][vc_separator border_width=”5″][/vc_column][/vc_row][vc_row][vc_column][vc_column_text]Good evening everyone.
The week just flew by,
My eldest is back to school for the last couple of weeks, so its all go in my house these days.
this time of year is always a bit of a shock to the system.
And the same can be said for the markets,
The big players are back in town again after the summer break.
So the time is ripe for a big market turn to occur.
And that is exactly what I am gearing for over the next few weeks.
So lets begin, shall we.[/vc_column_text][/vc_column][/vc_row]
[_s2If current_user_can(access_s2member_ccap_eurusd)]
[vc_row][vc_column][vc_separator border_width=”5″][/vc_column][/vc_row][vc_row][vc_column][vc_column_text]
EURUSD
[/vc_column_text][/vc_column][/vc_row][vc_row][vc_column][vc_separator border_width=”5″][/vc_column][/vc_row][vc_row][vc_column width=”2/3″][vc_custom_heading text=”30 min” use_theme_fonts=”yes”][vc_column_text] [/vc_column_text][/vc_column][vc_column width=”1/3″][vc_custom_heading text=”4 Hours” use_theme_fonts=”yes”][vc_column_text]
 [/vc_column_text][vc_custom_heading text=”Daily” use_theme_fonts=”yes”][vc_column_text]
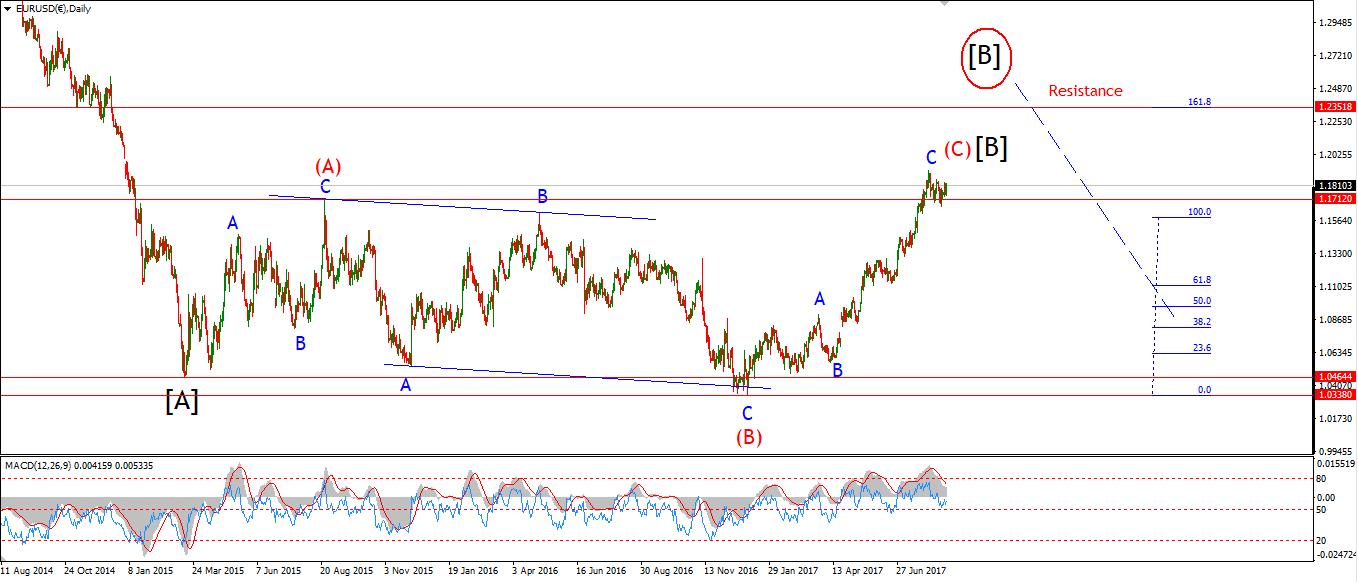 [/vc_column_text][/vc_column][/vc_row][vc_row][vc_column][vc_column_text]My Bias: long term bearish
Wave Structure: downward impulse wave
Long term wave count: lower in wave (3) red
Important risk events: EUR: Final CPI y/y. EUR: Final CPI y/y.
EURUSD continued its range contraction today,
this is in keeping with the possible contracting triangle wave ‘iv’ pink.
The price topped out in wave ‘d’ at 1.1986,
and the structure looks to be in three waves.
Wave ‘e’ has likely begun off that high.
The triangle calls for one more decline into the lower trendline at about 1.1850 to complete.
Wave ‘v’ will begin from there,
A break above 1.1986 will confirm wave ‘v’ has begun.
For Monday;
Watch for wave ‘iv’ pink to complete,
The target for wave ‘v’ is above 1.2200.[/vc_column_text][/vc_column][/vc_row]
[/_s2If]
[_s2If current_user_can(access_s2member_ccap_gbpusd)]
[vc_row][vc_column][vc_separator border_width=”5″][/vc_column][/vc_row][vc_row][vc_column][vc_column_text]
GBPUSD
[/vc_column_text][/vc_column][/vc_row][vc_row][vc_column][vc_separator border_width=”5″][/vc_column][/vc_row][vc_row][vc_column width=”2/3″][vc_custom_heading text=”30 min” use_theme_fonts=”yes”][vc_column_text] [/vc_column_text][/vc_column][vc_column width=”1/3″][vc_custom_heading text=”4 Hours” use_theme_fonts=”yes”][vc_column_text]
 [/vc_column_text][vc_custom_heading text=”Daily” use_theme_fonts=”yes”][vc_column_text]
 [/vc_column_text][/vc_column][/vc_row][vc_row][vc_column][vc_column_text]My Bias: short below parity in wave (5).
Wave Structure: continuing impulsive structure to the downside in wave (5)
Long term wave count: decline in wave (5) blue, below parity
Important risk events: GBP: N/A. EUR: Final CPI y/y.
Cable continued the impulsive rally in wave ‘v’ pink today.
This wave has subdivided and extended above target.
waves 1 through 4 in grey are possibly complete.
one more move higher in wave ‘5’ grey would complete the structure.
There is a higher Fibonacci target at 1.3864,
at this level wave (c) brown would reach 161.8% the length of wave (a)
On the 4hr chart you can see the price has reached the upper trend line of the channel
For Monday;
This rally looks well overbought at this stage,
A turn down should arrive quickly,
I will be on the lookout for a five wave decline of the high.[/vc_column_text][/vc_column][/vc_row]
[/_s2If]
[_s2If current_user_can(access_s2member_ccap_usdjpy)]
[vc_row][vc_column][vc_separator border_width=”5″][/vc_column][/vc_row][vc_row][vc_column][vc_column_text]
USDJPY
[/vc_column_text][/vc_column][/vc_row][vc_row][vc_column][vc_separator border_width=”5″][/vc_column][/vc_row][vc_row][vc_column width=”2/3″][vc_custom_heading text=”30 min” use_theme_fonts=”yes”][vc_column_text] [/vc_column_text][/vc_column][vc_column width=”1/3″][vc_custom_heading text=”4 Hours” use_theme_fonts=”yes”][vc_column_text]
 [/vc_column_text][vc_custom_heading text=”Daily” use_theme_fonts=”yes”][vc_column_text]
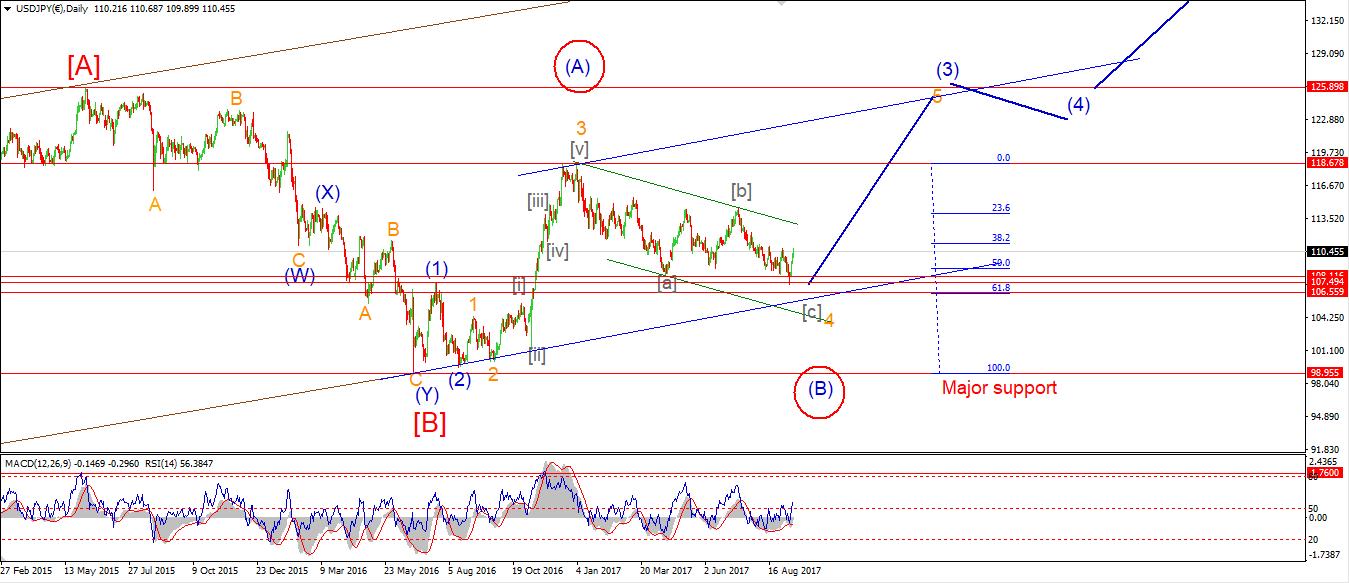 [/vc_column_text][/vc_column][/vc_row][vc_row][vc_column][vc_column_text]My Bias: LONG
Wave Structure: rally in wave [C]
Long term wave count: wave [C] is underway, upside to above 136.00
Important risk events: JPY: N/A. EUR: Final CPI y/y.
USDJPY rallied off the the overnight low to a new high this morning.
I have shown this as a possible expanded flat wave (ii) green.
This wave count calls for a decline in wave ‘c’ to complete.
I have shown an alternate count which shows the wave (ii) as complete at the overnight low.
Mondays action should decide which count is more fitting.
On the 4hr chart you will notice how the price found support and bounced higher off the 200MA
This is a good indicator of a trend change underway.
so, for Monday;
I will be watching the extent of the decline in wave ‘c’ brown.
Initial support is at 1.0953.
If the current ;wave count proves correct,
Then wave (iii) green will carry the price into 115.00 without mush hassle.[/vc_column_text][/vc_column][/vc_row]
[/_s2If]
[_s2If current_user_can(access_s2member_ccap_dow_jones)]
[vc_row][vc_column][vc_separator][/vc_column][/vc_row][vc_row][vc_column][vc_column_text]
DOW JONES INDUSTRIALS
[/vc_column_text][/vc_column][/vc_row][vc_row][vc_column][vc_separator][/vc_column][/vc_row][vc_row][vc_column width=”2/3″][vc_custom_heading text=”30 min” use_theme_fonts=”yes”][vc_column_text] [/vc_column_text][/vc_column][vc_column width=”1/3″][vc_custom_heading text=”4 Hours” use_theme_fonts=”yes”][vc_column_text]
 [/vc_column_text][vc_custom_heading text=”Daily” use_theme_fonts=”yes”][vc_column_text]
 [/vc_column_text][/vc_column][/vc_row][vc_row][vc_column][vc_column_text]My Bias: market topping process ongoing
Wave Structure: Impulsive 5 wave structure, possibly topping in an all time high.
Long term wave count: Possibly topped in wave (5)
Important risk events: USD: N/A. EUR: Final CPI y/y.
I mixed up the charts on last nights post,
That has been fixed now!
On to today,
Wave ‘iii’ pink has carried higher drawing closer to the initial upper target at 22419.
The short term momentum indicates a divergence from price
so I expect Monday will bring the arrival of wave ‘iv’
22086 is the level of the previous 4th wave of one lesser degree.
From that point I will look for a rally in wave ‘v’ pink,
Again we are approaching a significant turning point in the DOW.
That upper trendline is looking more likely at this point,
And a tag of that line will complete a large five wave pattern off the April lows.
For next week;
Momentum has topped out on the 4hr chart now,
in the short term the days are numbered for this rally,
Watch for wave ‘iv’ to complete and a final rise in wave ‘v’ to begin.[/vc_column_text][/vc_column][/vc_row]
[/_s2If]
[_s2If current_user_can(access_s2member_ccap_gold)]
[vc_row][vc_column][vc_separator][/vc_column][/vc_row][vc_row][vc_column][vc_column_text]
GOLD
[/vc_column_text][/vc_column][/vc_row][vc_row][vc_column][vc_separator][/vc_column][/vc_row][vc_row][vc_column width=”2/3″][vc_custom_heading text=”30 min” use_theme_fonts=”yes”][vc_column_text] [/vc_column_text][/vc_column][vc_column width=”1/3″][vc_custom_heading text=”4 Hours” use_theme_fonts=”yes”][vc_column_text]
 [/vc_column_text][vc_custom_heading text=”Daily” use_theme_fonts=”yes”][vc_column_text]
 [/vc_column_text][/vc_column][/vc_row][vc_row][vc_column][vc_column_text]My Bias: Long towards 1550
Wave Structure: ZigZag correction to the upside.
Long term wave count: Topping in wave (B) at 1550
Important risk events: USD: N/A. EUR: Final CPI y/y.
GOLD rallied into a double top at 1334 today and declined all day off that high.
the price is sitting very close to breaking the low of wave ‘iv brown at 1319.92 in the cash market.
It remains to be seen if wave (iv) blue is actually underway now, as shown in the alternate wave count.
Or, if we get another rally in wave ‘v’ into 1370.
I favor the idea of another run up to 1370
given the structure of the rise so far.
For next week;
1334 is key resistance in the short term,
Price must first stay above 1319.92 and break 1334 to confirm the higher wave (iii).[/vc_column_text][/vc_column][/vc_row]
[/_s2If]