
[vc_row][vc_column][vc_separator border_width=”5″][/vc_column][/vc_row][vc_row][vc_column][vc_column_text]
After some work on the crude oil wave counts over the last few days,
I think I will be ready to introduce the analysis early next week.
I will cover the charts in this weekends video also,
just to get you up to speed.[/vc_column_text][/vc_column][/vc_row]
[_s2If current_user_can(access_s2member_ccap_eurusd)]
[vc_row][vc_column][vc_separator border_width=”5″][/vc_column][/vc_row][vc_row][vc_column][vc_column_text]
EURUSD
[/vc_column_text][/vc_column][/vc_row][vc_row][vc_column][vc_separator border_width=”5″][/vc_column][/vc_row][vc_row][vc_column width=”2/3″][vc_custom_heading text=”30 min” use_theme_fonts=”yes”][vc_column_text] [/vc_column_text][/vc_column][vc_column width=”1/3″][vc_custom_heading text=”4 Hours” use_theme_fonts=”yes”][vc_column_text]
 [/vc_column_text][vc_custom_heading text=”Daily” use_theme_fonts=”yes”][vc_column_text]
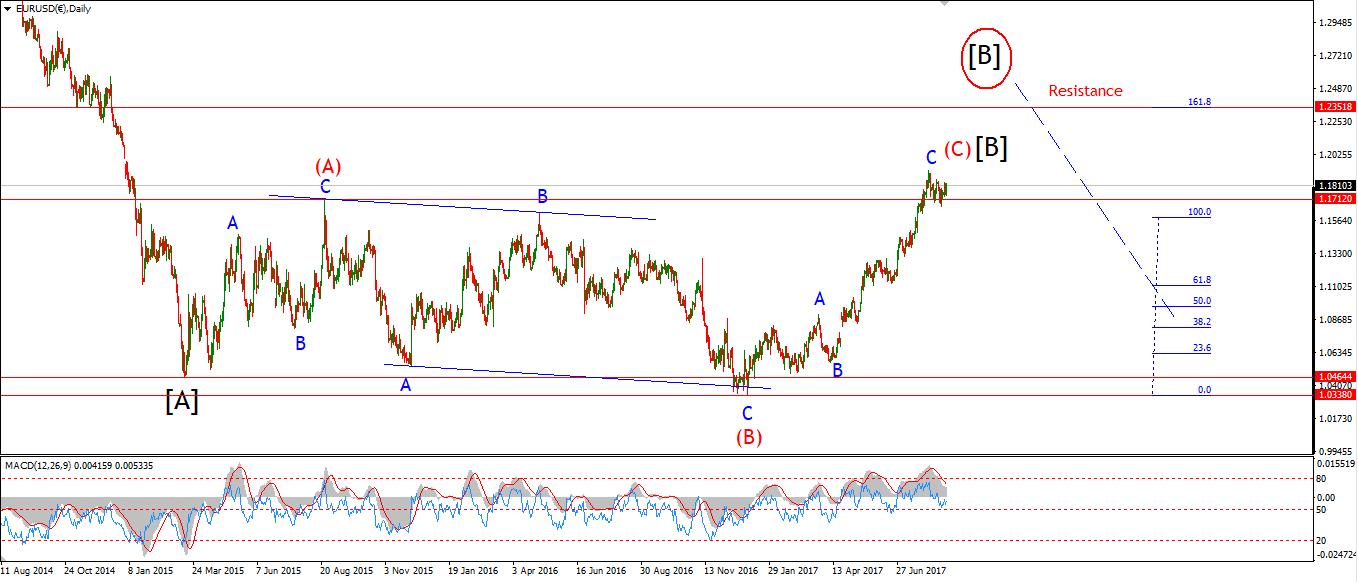 [/vc_column_text][/vc_column][/vc_row][vc_row][vc_column][vc_column_text]My Bias: long term bearish
Wave Structure: downward impulse wave
Long term wave count: lower in wave (3) red
Important risk events: EUR: German Buba President Weidmann Speaks. USD: CPI m/m, Unemployment Claims.
EURUSD continued its corrective decline in a possible wave ‘iv’ pink today,
The price structure is starting to resemble a simple flat correction after further declines.
As shown by the alternate wave count.
A break below 1.1823 will favor this interpretation,
At that point, I expect ;wave ‘v’ pink should begin with a possible target at 1.2200.
For tomorrow;
look for signs of a turn up off support at 1.1820.[/vc_column_text][/vc_column][/vc_row]
[/_s2If]
[_s2If current_user_can(access_s2member_ccap_gbpusd)]
[vc_row][vc_column][vc_separator border_width=”5″][/vc_column][/vc_row][vc_row][vc_column][vc_column_text]
GBPUSD
[/vc_column_text][/vc_column][/vc_row][vc_row][vc_column][vc_separator border_width=”5″][/vc_column][/vc_row][vc_row][vc_column width=”2/3″][vc_custom_heading text=”30 min” use_theme_fonts=”yes”][vc_column_text]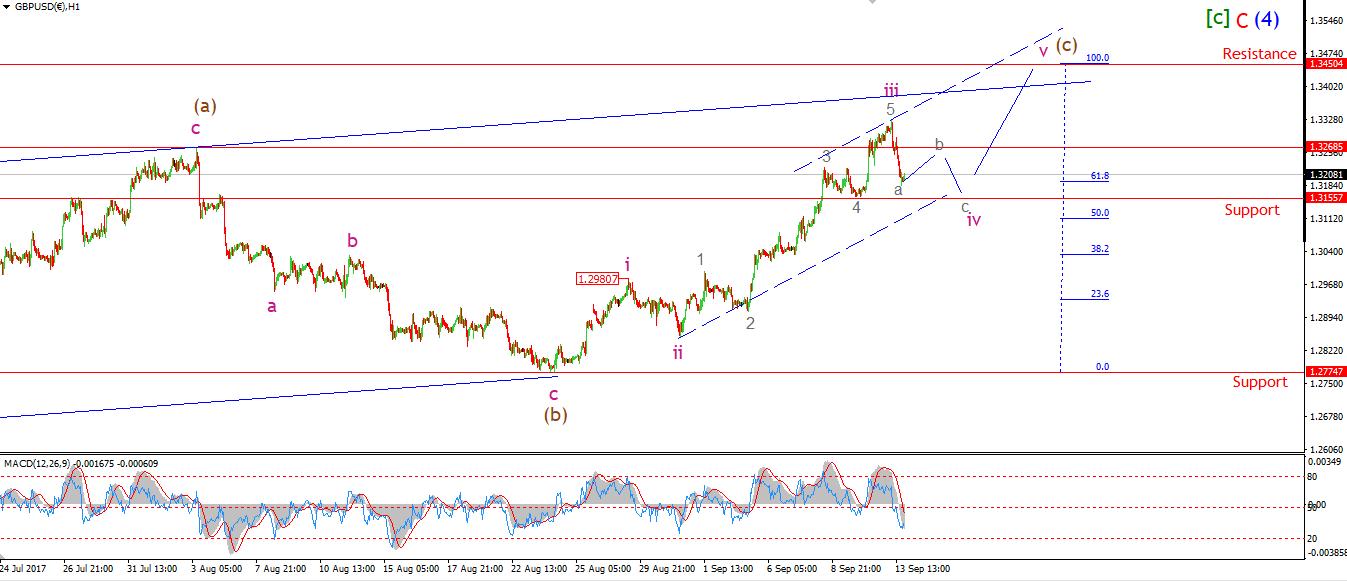 [/vc_column_text][/vc_column][vc_column width=”1/3″][vc_custom_heading text=”4 Hours” use_theme_fonts=”yes”][vc_column_text]
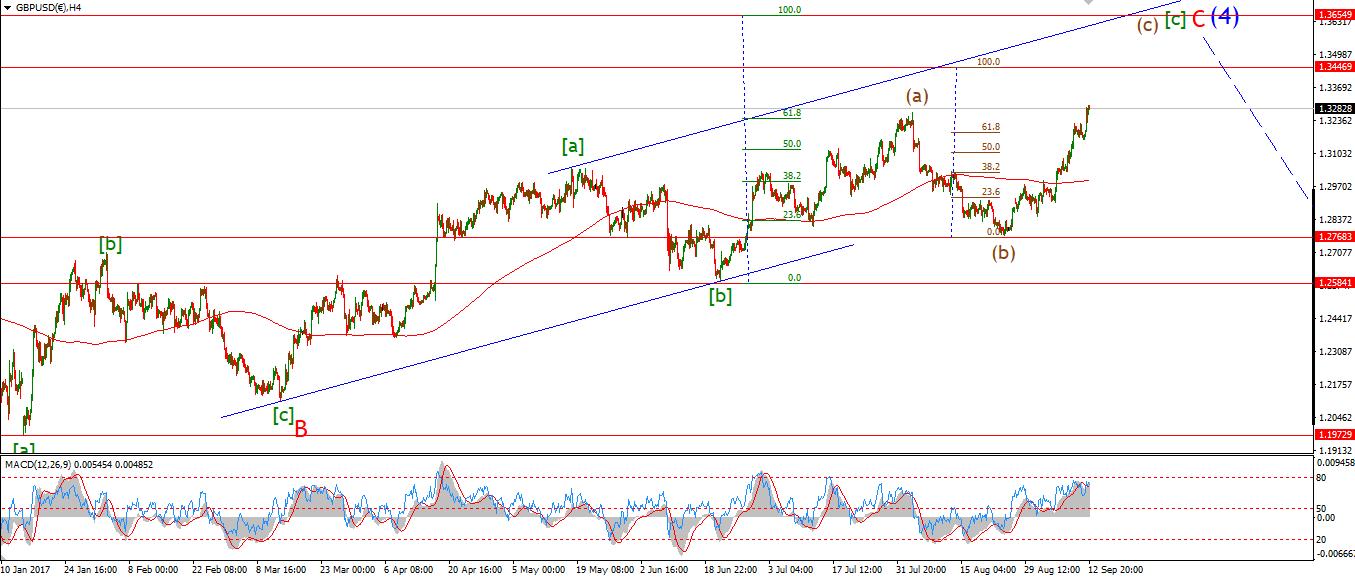 [/vc_column_text][vc_custom_heading text=”Daily” use_theme_fonts=”yes”][vc_column_text]
 [/vc_column_text][/vc_column][/vc_row][vc_row][vc_column][vc_column_text]My Bias: short below parity in wave (5).
Wave Structure: continuing impulsive structure to the downside in wave (5)
Long term wave count: decline in wave (5) blue, below parity
Important risk events: GBP: MPC Official Bank Rate Votes, Monetary Policy Summary, Official Bank Rate, Asset Purchase Facility. USD: CPI m/m, Unemployment Claims.
Cable began a correction in wave ‘iv’ today
with a sharp drop towards support at 1.3155.
this decline may only be wave ‘a’ of ‘iv’, so wave ‘b’ and ‘c’ are yet to come.
1.3155 is still the most likely target for wave ‘iv’ to complete
Price must not drop below 1.2980, as wave ‘iv’ would then break the high of wave ‘i’
For tomorrow;
watch for a short bounce in wave ‘b’ grey,
Followed by a decline in wave ‘c’ grey.
We may get the final rally in wave ‘v’ before the end of the week.[/vc_column_text][/vc_column][/vc_row]
[/_s2If]
[_s2If current_user_can(access_s2member_ccap_usdjpy)]
[vc_row][vc_column][vc_separator border_width=”5″][/vc_column][/vc_row][vc_row][vc_column][vc_column_text]
USDJPY
[/vc_column_text][/vc_column][/vc_row][vc_row][vc_column][vc_separator border_width=”5″][/vc_column][/vc_row][vc_row][vc_column width=”2/3″][vc_custom_heading text=”30 min” use_theme_fonts=”yes”][vc_column_text]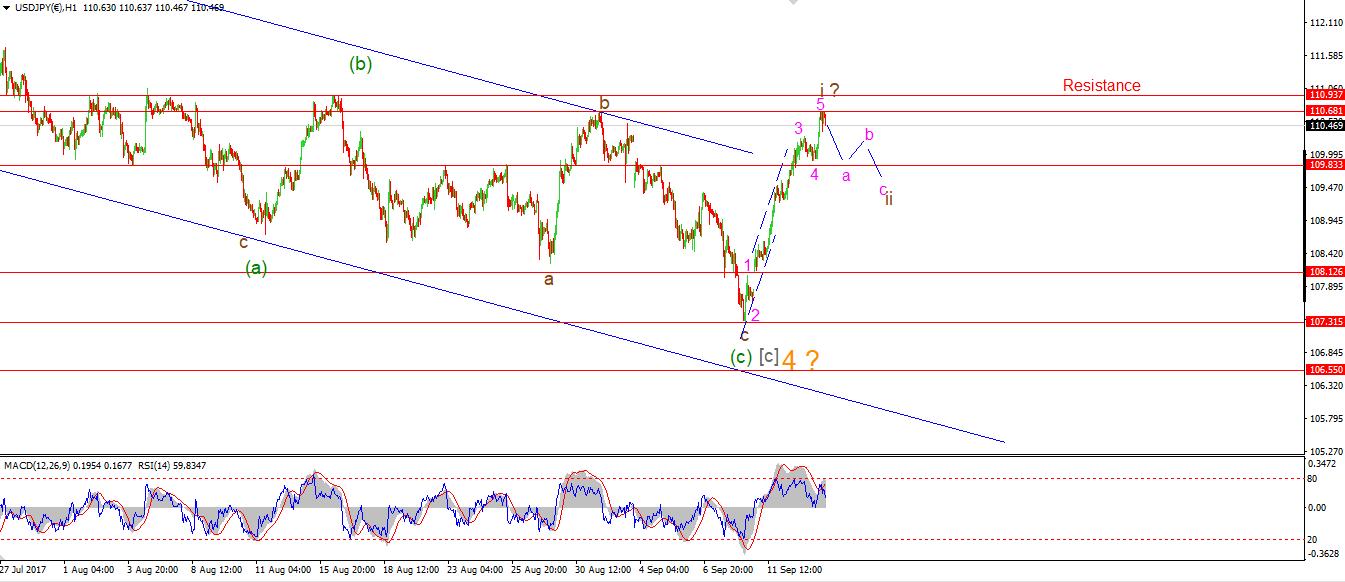 [/vc_column_text][/vc_column][vc_column width=”1/3″][vc_custom_heading text=”4 Hours” use_theme_fonts=”yes”][vc_column_text]
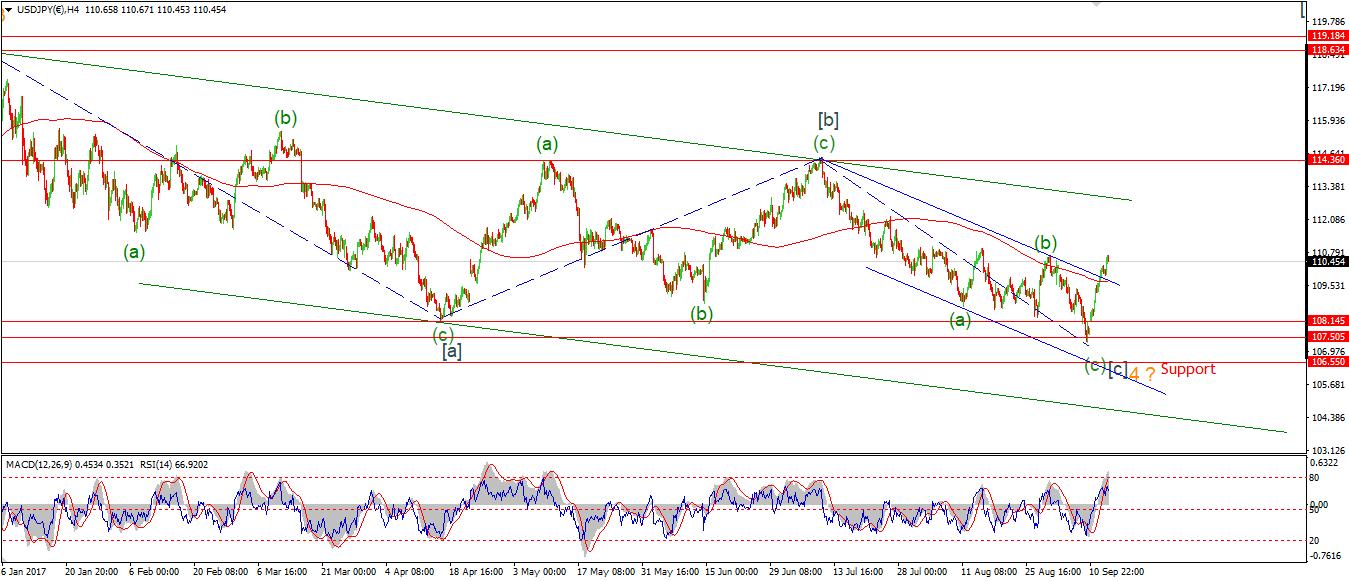 [/vc_column_text][vc_custom_heading text=”Daily” use_theme_fonts=”yes”][vc_column_text]
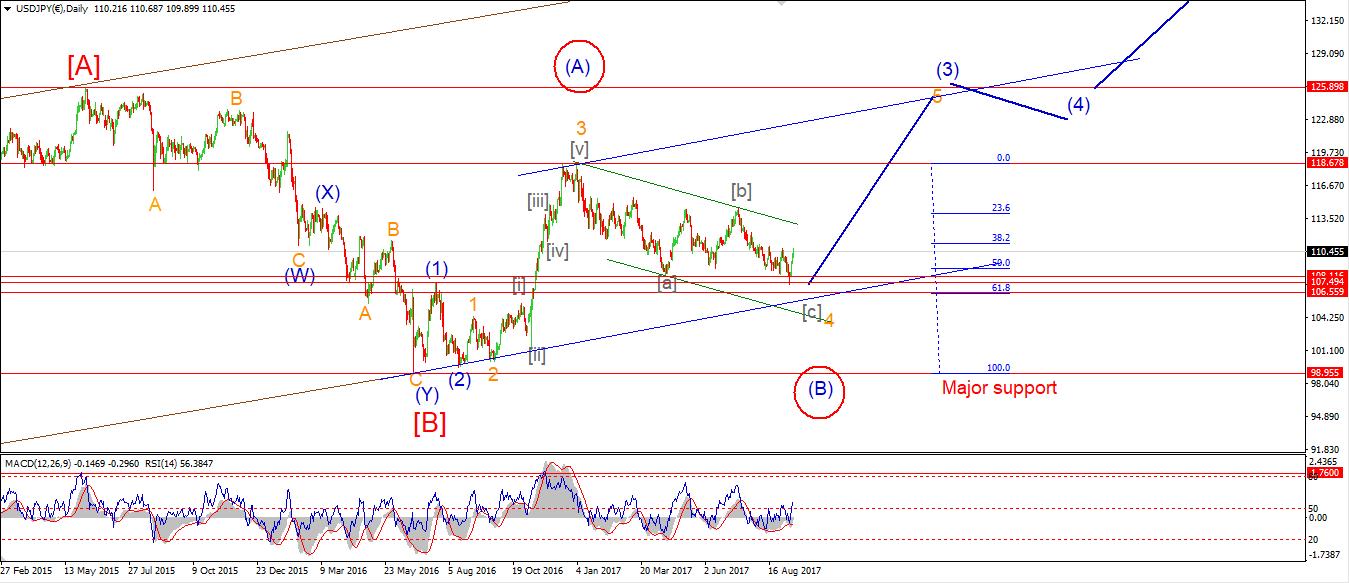 [/vc_column_text][/vc_column][/vc_row][vc_row][vc_column][vc_column_text]My Bias: LONG
Wave Structure: rally in wave [C]
Long term wave count: wave [C] is underway, upside to above 136.00
Important risk events: JPY: N/A. USD: CPI m/m, Unemployment Claims.
USDJPY has had its best week since mid July, rallying 330 points since last Friday.
The price is now sitting at the first major resistance level of 110.68.
The price has faltered at these levels three times in the last 6 weeks.
So the action over the next couple of days will be critical to break this mold.
We now have a momentum buy signal on the 4hr and on the daily chart.
And a nice break above the 200MA on the 4hr chart.
All that is left is a bullish elliott wave signal to complete the trio!
This will involve a three wave decline to a lower high in wave ‘ii’ brown.
for tomorrow;
I am awaiting that corrective decline to begin in wave ‘ii’.
Once complete it will be time to prepare for a size-able rally in wave ‘iii'[/vc_column_text][/vc_column][/vc_row]
[/_s2If]
[_s2If current_user_can(access_s2member_ccap_dow_jones)]
[vc_row][vc_column][vc_separator][/vc_column][/vc_row][vc_row][vc_column][vc_column_text]
DOW JONES INDUSTRIALS
[/vc_column_text][/vc_column][/vc_row][vc_row][vc_column][vc_separator][/vc_column][/vc_row][vc_row][vc_column width=”2/3″][vc_custom_heading text=”30 min” use_theme_fonts=”yes”][vc_column_text]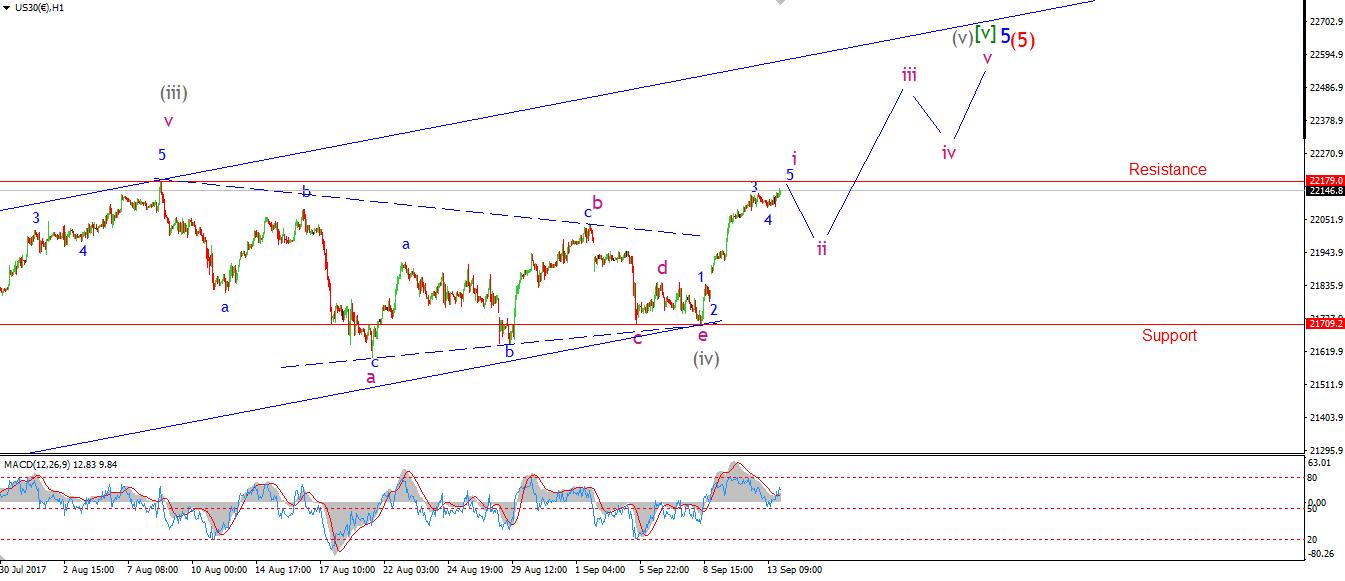 [/vc_column_text][/vc_column][vc_column width=”1/3″][vc_custom_heading text=”4 Hours” use_theme_fonts=”yes”][vc_column_text]
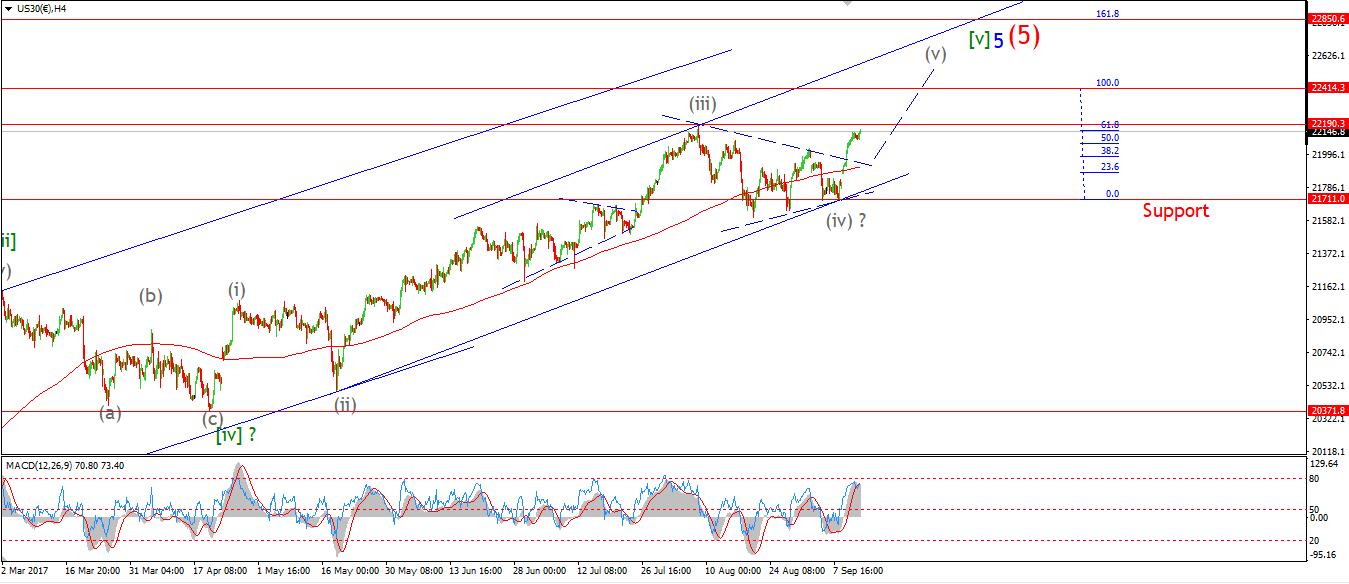 [/vc_column_text][vc_custom_heading text=”Daily” use_theme_fonts=”yes”][vc_column_text]
 [/vc_column_text][/vc_column][/vc_row][vc_row][vc_column][vc_column_text]My Bias: market topping process ongoing
Wave Structure: Impulsive 5 wave structure, possibly topping in an all time high.
Long term wave count: Possibly topped in wave (5)
Important risk events: USD: CPI m/m, Unemployment Claims.
The DOW hung on to its gains today, remaining flat just below the all time high.
The decline in wave ‘ii’ pink should begin tomorrow, given the short term momentum divergence to the downside.
A new all time high will be established in wave ‘iii’ pink.
On the 4hr chart the momentum situation has again reached an extreme high.
wave ‘ii’ pink will dampen those readings.
For tomorrow;
Unemployment claims and cpi data is released tomorrow,
so watch for any whipsaw action around those releases.
The wave count remains on course for higher highs to meet the larger rising trendline[/vc_column_text][/vc_column][/vc_row]
[/_s2If]
[_s2If current_user_can(access_s2member_ccap_gold)]
[vc_row][vc_column][vc_separator][/vc_column][/vc_row][vc_row][vc_column][vc_column_text]
GOLD
[/vc_column_text][/vc_column][/vc_row][vc_row][vc_column][vc_separator][/vc_column][/vc_row][vc_row][vc_column width=”2/3″][vc_custom_heading text=”30 min” use_theme_fonts=”yes”][vc_column_text]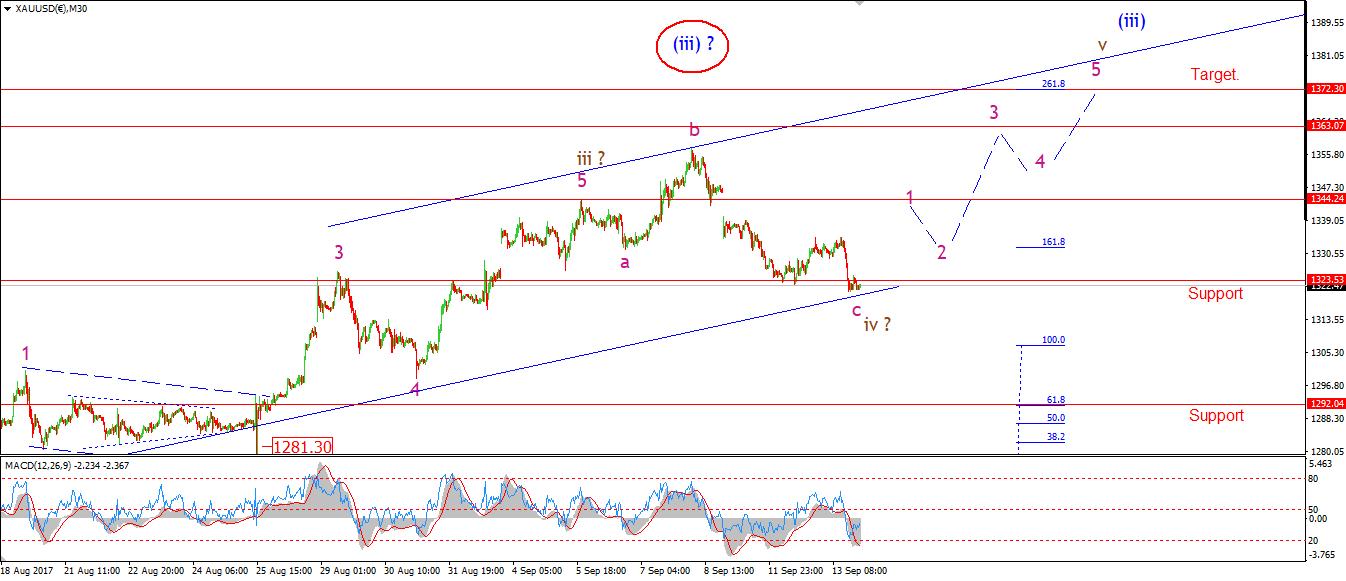 [/vc_column_text][/vc_column][vc_column width=”1/3″][vc_custom_heading text=”4 Hours” use_theme_fonts=”yes”][vc_column_text]
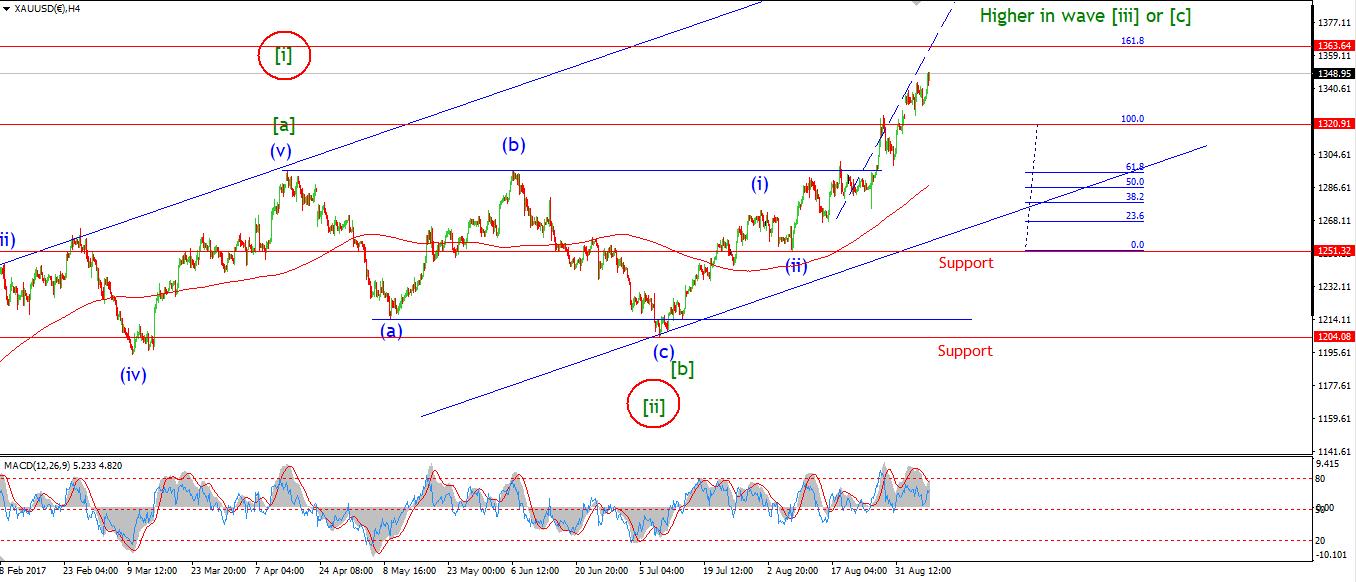 [/vc_column_text][vc_custom_heading text=”Daily” use_theme_fonts=”yes”][vc_column_text]
 [/vc_column_text][/vc_column][/vc_row][vc_row][vc_column][vc_column_text]My Bias: Long towards 1550
Wave Structure: ZigZag correction to the upside.
Long term wave count: Topping in wave (B) at 1550
Important risk events: USD: CPI m/m, Unemployment Claims.
GOLD dropped back into support at 1323 this evening after a short lived rise yesterday
The wave structure still suggests an expanded flat correction in wave ‘iv’ brown
Which is completing as I write.
It is worth keeping an eye on the alternate wave count
which suggests that a decline in wave (iv) blue at one higher degree is underway.
This would allow for a larger decline,
Possibly back to 1300 again before completing.
For tomorrow;
The preferred wave count calls for this decline to halt at nearby levels,
A rally in wave ‘v’ should begin with a higher low at around 1330.[/vc_column_text][/vc_column][/vc_row]
[/_s2If]