
[vc_row][vc_column][vc_separator border_width=”5″][/vc_column][/vc_row][vc_row][vc_column][vc_column_text]Hello everybody,
Welcome to the end of a week full of damn strange action!
In time, confusion and strange patterns all get resolved.
it is simply a matter of cycling through the relevant short term wave counts
until the larger pattern completes and then you are off to the races again, as they say!
This week saw a break of support in USDJPY,
and today a break of resistance in EURUSD.
As the dollar markets complete large scale corrections which have taken years to play out.
The end result will be the same as the new bear market takes hold.
The USD is going to rally accross the board.
The GBP will weaken significantly.
As for the the EURO,
well it may just dissappear altogether!
The long term patterns remain clear.
The tricky part is always the interpretation of the short term action within the framework of the larger wave pattern.
And that is what I try to do every day on these pages.
On that note![/vc_column_text][/vc_column][/vc_row]
[_s2If current_user_can(access_s2member_ccap_eurusd)]
[vc_row][vc_column][vc_separator border_width=”5″][/vc_column][/vc_row][vc_row][vc_column][vc_column_text]
EURUSD
[/vc_column_text][/vc_column][/vc_row][vc_row][vc_column][vc_separator border_width=”5″][/vc_column][/vc_row][vc_row][vc_column width=”2/3″][vc_custom_heading text=”30 min” use_theme_fonts=”yes”][vc_column_text] [/vc_column_text][/vc_column][vc_column width=”1/3″][vc_custom_heading text=”4 Hours” use_theme_fonts=”yes”][vc_column_text]
 [/vc_column_text][vc_custom_heading text=”Daily” use_theme_fonts=”yes”][vc_column_text]
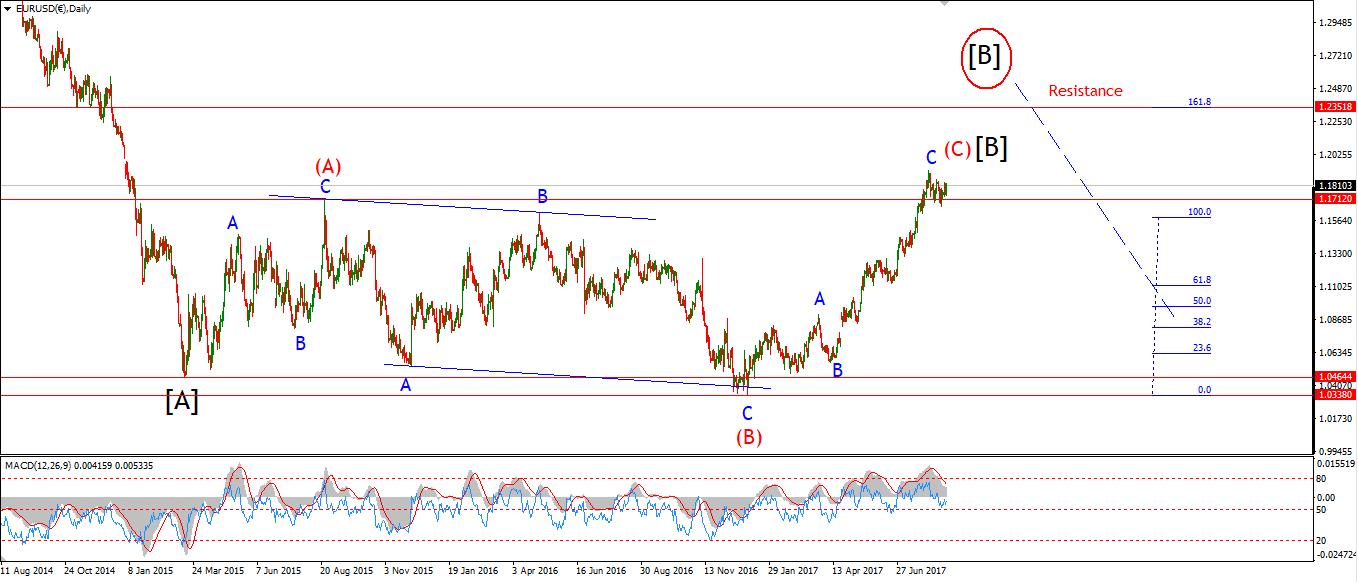 [/vc_column_text][/vc_column][/vc_row][vc_row][vc_column][vc_column_text]My Bias: long term bearish
Wave Structure: downward impulse wave
Long term wave count: lower in wave (3) red
Important risk events: EUR: N/A. USD: N/A.
The EURUSD did break above the resistance at 1.2070.
The target now moves to the higher fibonacci level on the 4hr chart.
This is the 161.8% extention of wave (A) red,
And that projects a high for wave (C) red at 1.2200.
The short term action is quite hard to interpret.
The recent rise off 1.1822 remains very corrective looking,
with overlapping and undecided price moves.
The best fit wave pattern in this case is a large contracting triangle in a possible wave ‘iv’ pink.
Wave ‘v’ pink will follow with the initial target at 1.2200.
The upper trendline will be met at 1.2300.
If the price continue to contract in the triangle over the next few days,
There will be a nice short term opportunity in wave ‘v’ to the upside.
For Monday;
I will be watching the development of this triangle along the lines shown.
The initial target for wave ‘iv’ pink to complete is at 1.1940.[/vc_column_text][/vc_column][/vc_row]
[/_s2If]
[_s2If current_user_can(access_s2member_ccap_gbpusd)]
[vc_row][vc_column][vc_separator border_width=”5″][/vc_column][/vc_row][vc_row][vc_column][vc_column_text]
GBPUSD
[/vc_column_text][/vc_column][/vc_row][vc_row][vc_column][vc_separator border_width=”5″][/vc_column][/vc_row][vc_row][vc_column width=”2/3″][vc_custom_heading text=”30 min” use_theme_fonts=”yes”][vc_column_text] [/vc_column_text][/vc_column][vc_column width=”1/3″][vc_custom_heading text=”4 Hours” use_theme_fonts=”yes”][vc_column_text]
 [/vc_column_text][vc_custom_heading text=”Daily” use_theme_fonts=”yes”][vc_column_text]
 [/vc_column_text][/vc_column][/vc_row][vc_row][vc_column][vc_column_text]My Bias: short below parity in wave (5).
Wave Structure: continuing impulsive structure to the downside in wave (5)
Long term wave count: decline in wave (5) blue, below parity
Important risk events: GBP: N/A. USD: N/A.
Cable continued its extended rally in a possible wave (c) of [ii].
the price is again nearing the upper resistance at 1.3268.
A break of this line will invalidate the short term bearish view.
The 4hr momentum indicators show a sever overbought scenario again.
RSI registered a 76 today at peak momentum.
This correction has surpassed expectations at this point and must turn down immediately to save current wave count.
For Monday;
1.3268 is the level to watch.
The 4hr chart shows the higher target for wave (4) at 1.3450.
Where the price would meet the upper trendline again.[/vc_column_text][/vc_column][/vc_row]
[/_s2If]
[_s2If current_user_can(access_s2member_ccap_usdjpy)]
[vc_row][vc_column][vc_separator border_width=”5″][/vc_column][/vc_row][vc_row][vc_column][vc_column_text]
USDJPY
[/vc_column_text][/vc_column][/vc_row][vc_row][vc_column][vc_separator border_width=”5″][/vc_column][/vc_row][vc_row][vc_column width=”2/3″][vc_custom_heading text=”30 min” use_theme_fonts=”yes”][vc_column_text] [/vc_column_text][/vc_column][vc_column width=”1/3″][vc_custom_heading text=”4 Hours” use_theme_fonts=”yes”][vc_column_text]
 [/vc_column_text][vc_custom_heading text=”Daily” use_theme_fonts=”yes”][vc_column_text]
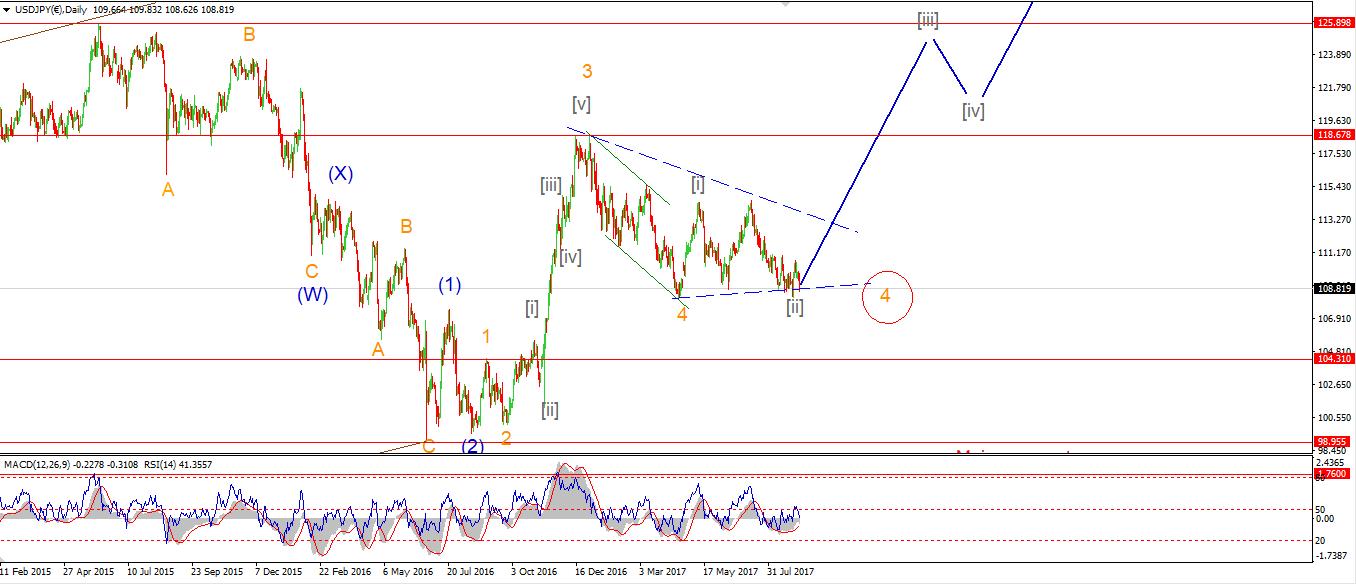 [/vc_column_text][/vc_column][/vc_row][vc_row][vc_column][vc_column_text]My Bias: LONG
Wave Structure: rally in wave [C]
Long term wave count: wave [C] is underway, upside to above 136.00
Important risk events: JPY: N/A. USD: N/A.
USDJPY is now approaching the lower trendline.
And we have reached an extreme oversold level again.
An end is in sight for wave ‘c’ pink after todays decline
as wave ‘c’ has now almost reached equality with wave ‘a’ pink.
The lower target still remains at 106.55 for now,
Unless an impulsive move to the upside occurs before then.
For Monday;
108.44 forms the initial resistance line,
And move above that point will again bring the possibility of a turn higher.[/vc_column_text][/vc_column][/vc_row]
[/_s2If]
[_s2If current_user_can(access_s2member_ccap_dow_jones)]
[vc_row][vc_column][vc_separator][/vc_column][/vc_row][vc_row][vc_column][vc_column_text]
DOW JONES INDUSTRIALS
[/vc_column_text][/vc_column][/vc_row][vc_row][vc_column][vc_separator][/vc_column][/vc_row][vc_row][vc_column width=”2/3″][vc_custom_heading text=”30 min” use_theme_fonts=”yes”][vc_column_text] [/vc_column_text][/vc_column][vc_column width=”1/3″][vc_custom_heading text=”4 Hours” use_theme_fonts=”yes”][vc_column_text]
 [/vc_column_text][vc_custom_heading text=”Daily” use_theme_fonts=”yes”][vc_column_text]
 [/vc_column_text][/vc_column][/vc_row][vc_row][vc_column][vc_column_text]My Bias: market topping process ongoing
Wave Structure: Impulsive 5 wave structure, possibly topping in an all time high.
Long term wave count: Possibly topped in wave (5)
Important risk events: USD: N/A.
The short term action in the DOW has raised another possibility for this unfolding top formation.
The price structure off the high at wave (ii) grey can be read as a completed five waves down in blue
This forms wave ‘i’ pink.
If todays rally develops into a three wave correction,
That will form wave ‘ii’ pink.
And with that comes three degrees of bearish lower highs!
On the 4hr chart I have noted that the price has now dropped below the 200MA
If the price finds resistance at that line,
This will add to the bearish setup.
For Monday;
I am looking for the completion of another three wave rise off the todays low.
wave ‘a’ looks complete, wave ‘b’ and ‘c’ should follow.[/vc_column_text][/vc_column][/vc_row]
[/_s2If]
[_s2If current_user_can(access_s2member_ccap_gold)]
[vc_row][vc_column][vc_separator][/vc_column][/vc_row][vc_row][vc_column][vc_column_text]
GOLD
[/vc_column_text][/vc_column][/vc_row][vc_row][vc_column][vc_separator][/vc_column][/vc_row][vc_row][vc_column width=”2/3″][vc_custom_heading text=”30 min” use_theme_fonts=”yes”][vc_column_text] [/vc_column_text][/vc_column][vc_column width=”1/3″][vc_custom_heading text=”4 Hours” use_theme_fonts=”yes”][vc_column_text]
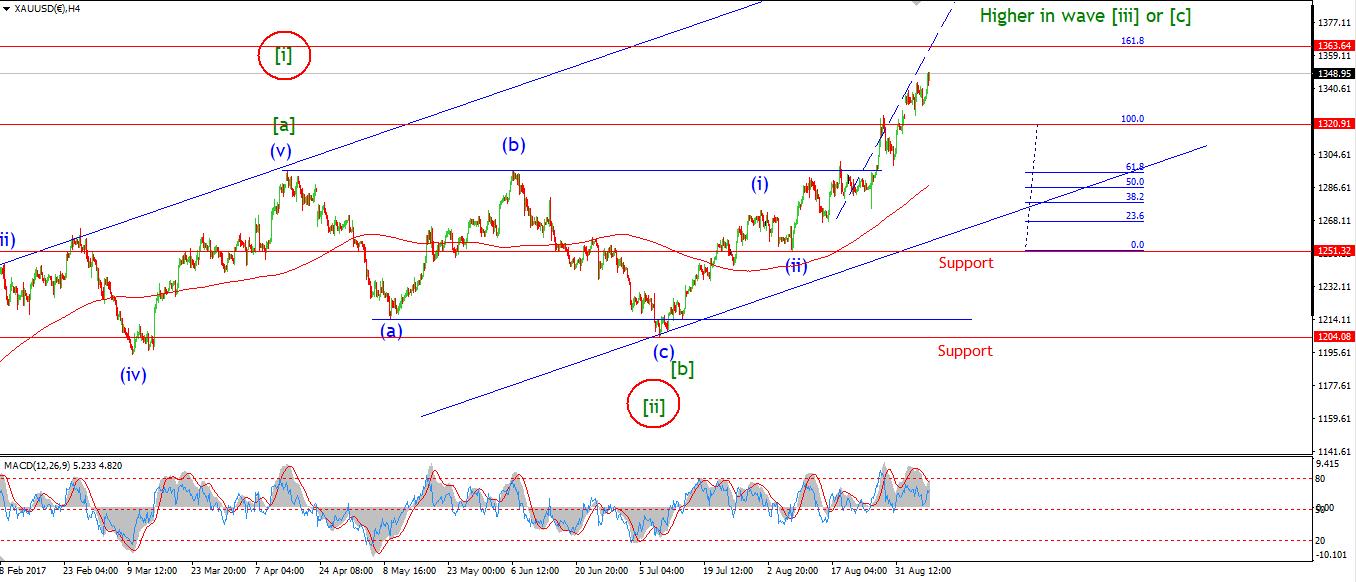 [/vc_column_text][vc_custom_heading text=”Daily” use_theme_fonts=”yes”][vc_column_text]
 [/vc_column_text][/vc_column][/vc_row][vc_row][vc_column][vc_column_text]My Bias: Long towards 1550
Wave Structure: ZigZag correction to the upside.
Long term wave count: Topping in wave (B) at 1550
Important risk events: USD: N/A.
GOLD Looks to have complete wave ‘2’ pink today.
The decline so far looks to be in three waves with a slight bounce into todays close.
Wave ‘3’ should follow on Monday if the current short term count holds up.
on that note,
The alternate wave ‘iv’ idea shown circled in red is still a possibility,
If 1333.42 in the cash market breaks.
Then the alternate wave count takes the lead.
In both scenarios, 1372 is the likely target for wave (iii) blue to complete.
So next week still looks positive for GOLD.
For Monday;
support at 1333.42 should hold the price as wave ‘3’ pink gets underway.
That is it for the week,
I will upload the video review tomorrow morning.
Wishing you all a happy and safe weekend![/vc_column_text][/vc_column][/vc_row]
[/_s2If]