
[_s2If current_user_can(access_s2member_ccap_eurusd)]
[vc_row][vc_column][vc_separator border_width=”5″][/vc_column][/vc_row][vc_row][vc_column][vc_column_text]
EURUSD
[/vc_column_text][/vc_column][/vc_row][vc_row][vc_column][vc_separator border_width=”5″][/vc_column][/vc_row][vc_row][vc_column width=”2/3″][vc_custom_heading text=”30 min” use_theme_fonts=”yes”][vc_column_text] [/vc_column_text][/vc_column][vc_column width=”1/3″][vc_custom_heading text=”4 Hours” use_theme_fonts=”yes”][vc_column_text]
 [/vc_column_text][vc_custom_heading text=”Daily” use_theme_fonts=”yes”][vc_column_text]
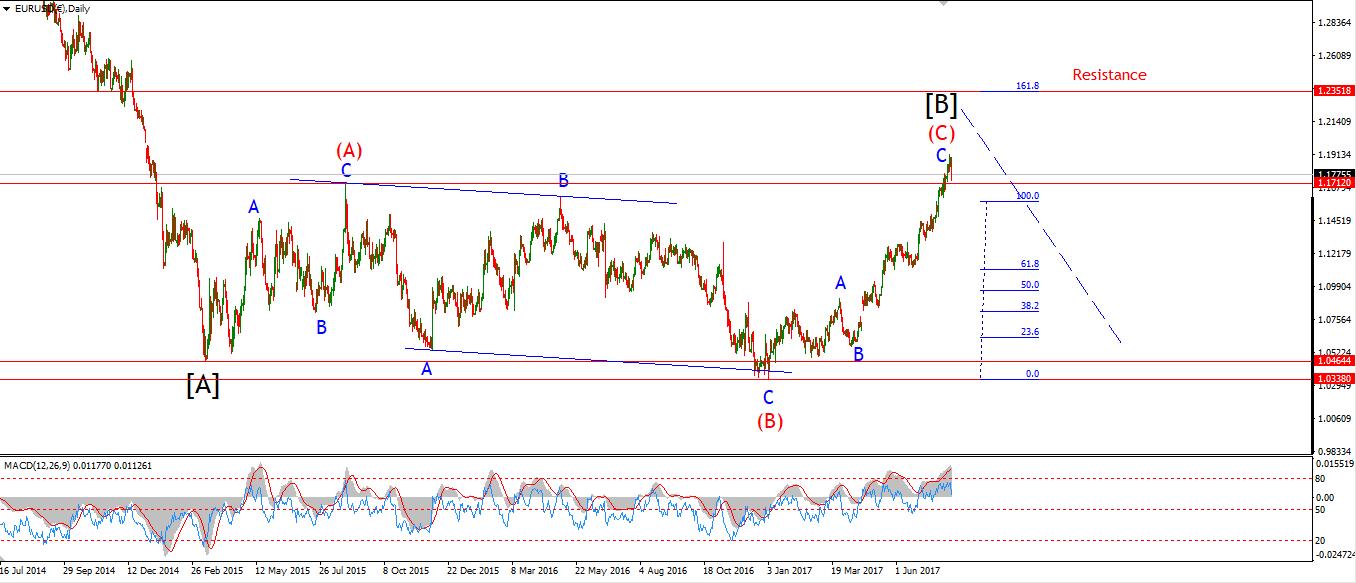 [/vc_column_text][/vc_column][/vc_row][vc_row][vc_column][vc_column_text]My Bias: long term bearish
Wave Structure: downward impulse wave
Long term wave count: lower in wave (3) red
Important risk events: EUR: N/A. USD: Prelim UoM Consumer Sentiment, FOMC Member Kaplan Speaks.
Good night to you all!
EURUSD has again moved impulsively to the downside.
After an expanded flat wave ‘2’ grey complete at last nights highs,
It is now possible that wave ‘3’ grey is underway,
The structure will likely extend into a clear five wave pattern within wave ‘3’ itself.
Wave ‘2’ lies at 1.1789, so that level must hold for the impulsive structure to remain valid.
For tomorrow;
wave ‘3’ grey should take the price below the lower trendline
1.1487 remains the target for wave ‘iii’ pink.[/vc_column_text][/vc_column][/vc_row]
[/_s2If]
[_s2If current_user_can(access_s2member_ccap_gbpusd)]
[vc_row][vc_column][vc_separator border_width=”5″][/vc_column][/vc_row][vc_row][vc_column][vc_column_text]
GBPUSD
[/vc_column_text][/vc_column][/vc_row][vc_row][vc_column][vc_separator border_width=”5″][/vc_column][/vc_row][vc_row][vc_column width=”2/3″][vc_custom_heading text=”30 min” use_theme_fonts=”yes”][vc_column_text] [/vc_column_text][/vc_column][vc_column width=”1/3″][vc_custom_heading text=”4 Hours” use_theme_fonts=”yes”][vc_column_text]
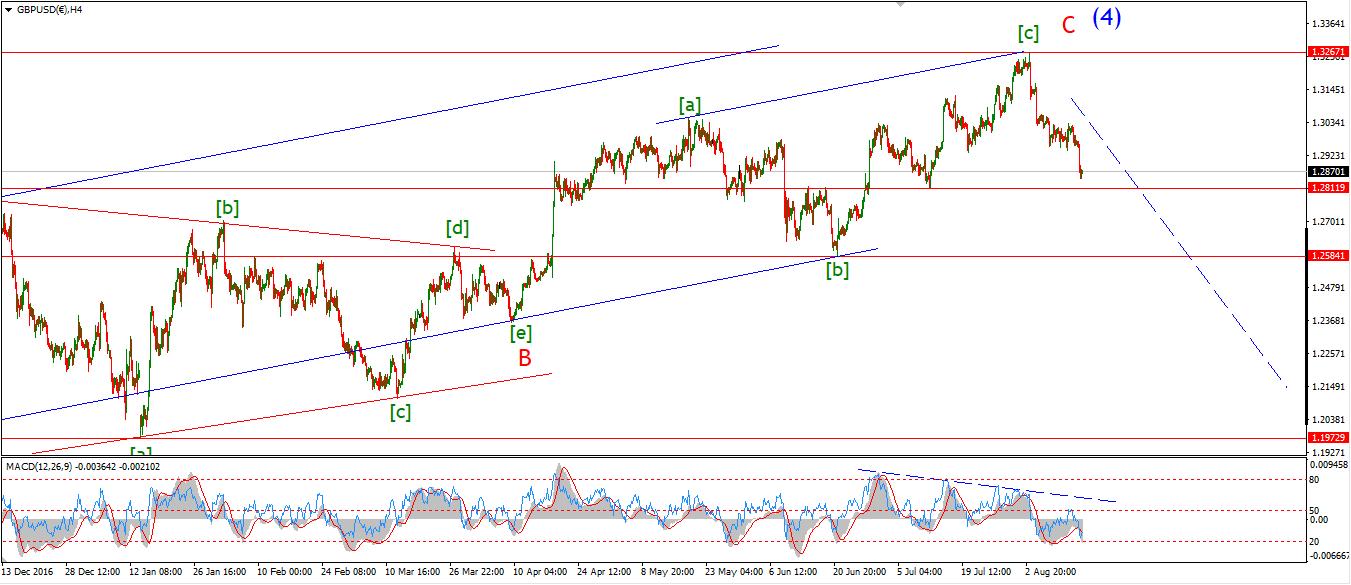 [/vc_column_text][vc_custom_heading text=”Daily” use_theme_fonts=”yes”][vc_column_text]
 [/vc_column_text][/vc_column][/vc_row][vc_row][vc_column][vc_column_text]My Bias: short below parity in wave (5).
Wave Structure: continuing impulsive structure to the downside in wave (5)
Long term wave count: decline in wave (5) blue, below parity
Important risk events: GBP: N/A. USD: Prelim UoM Consumer Sentiment, FOMC Member Kaplan Speaks.
Cable continued sideways today in a possible wave ‘4’ grey,
Wave ‘4’ does not seem to be complete yet with a further rise into the upper trendline underway.
It is possible that a double combination wave is unfolding here.
This is a complex additive structure where two 3 wave patterns come together to create a larger structure.
The price will meet the upper trendline at about 1.2920,
If that occurs the combination wave will be complete and wave ‘5’ will to the downside will follow.
Also keep an eye on the alternate wave count,
This wave count also fits the price action quite well and should not be ruled out.
For tomorrow;
watch for a reaction off the minor trendline in wave ‘4’ grey at 1.2920.[/vc_column_text][/vc_column][/vc_row]
[/_s2If]
[_s2If current_user_can(access_s2member_ccap_usdjpy)]
[vc_row][vc_column][vc_separator border_width=”5″][/vc_column][/vc_row][vc_row][vc_column][vc_column_text]
USDJPY
[/vc_column_text][/vc_column][/vc_row][vc_row][vc_column][vc_separator border_width=”5″][/vc_column][/vc_row][vc_row][vc_column width=”2/3″][vc_custom_heading text=”30 min” use_theme_fonts=”yes”][vc_column_text] [/vc_column_text][/vc_column][vc_column width=”1/3″][vc_custom_heading text=”4 Hours” use_theme_fonts=”yes”][vc_column_text]
 [/vc_column_text][vc_custom_heading text=”Daily” use_theme_fonts=”yes”][vc_column_text]
 [/vc_column_text][/vc_column][/vc_row][vc_row][vc_column][vc_column_text]My Bias: LONG
Wave Structure: rally in wave [C]
Long term wave count: wave [C] is underway, upside to above 136.00
Important risk events: JPY: N/A. USD: Prelim UoM Consumer Sentiment, FOMC Member Kaplan Speaks.
Despite a short surge in the price this morning,
USDJPY sold off to a very slight new low by 5 points this evening.
Wave ‘ii’ is correcting deeply and approaching the 61.8% retracement level.
That level lies at 109.53.
We should see the beginning of wave ‘iii’ brown soon,
But the low at 108.72 must hold or the bullish interpretation will be invalidated.
For tomorrow;
Watch for another minor higher low to form ablve 109.53.
A break of 110.84 will confirm wave ‘iii’ has begun.[/vc_column_text][/vc_column][/vc_row]
[/_s2If]
[_s2If current_user_can(access_s2member_ccap_dow_jones)]
[vc_row][vc_column][vc_separator][/vc_column][/vc_row][vc_row][vc_column][vc_column_text]
DOW JONES INDUSTRIALS
[/vc_column_text][/vc_column][/vc_row][vc_row][vc_column][vc_separator][/vc_column][/vc_row][vc_row][vc_column width=”2/3″][vc_custom_heading text=”30 min” use_theme_fonts=”yes”][vc_column_text] [/vc_column_text][/vc_column][vc_column width=”1/3″][vc_custom_heading text=”4 Hours” use_theme_fonts=”yes”][vc_column_text]
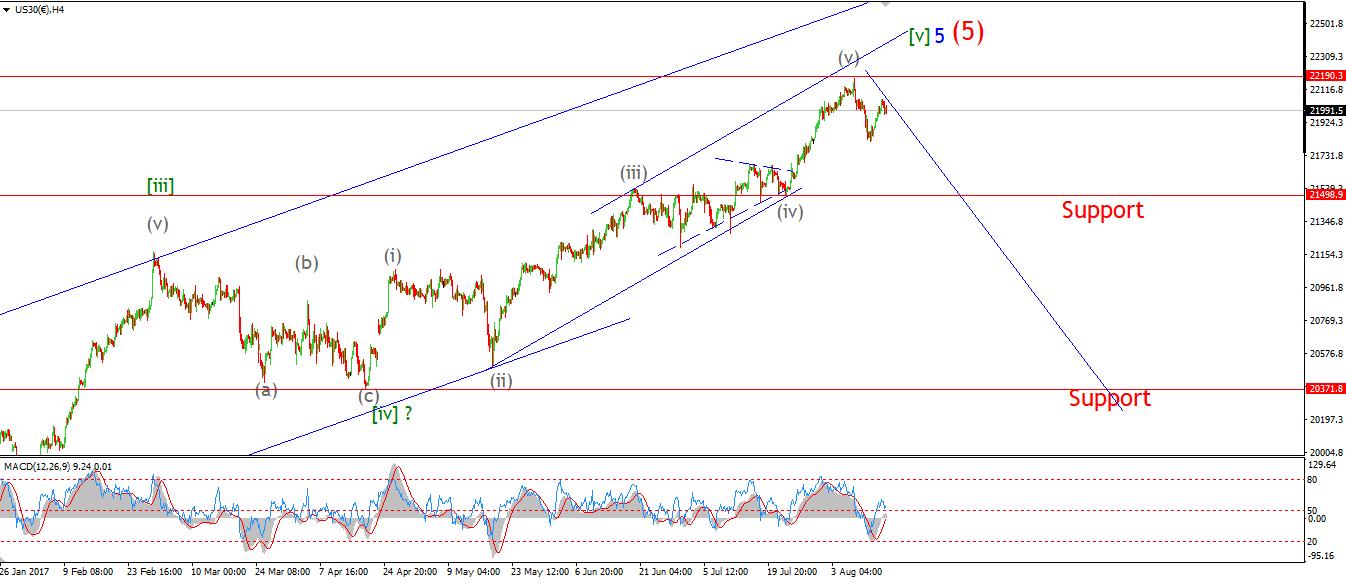 [/vc_column_text][vc_custom_heading text=”Daily” use_theme_fonts=”yes”][vc_column_text]
 [/vc_column_text][/vc_column][/vc_row][vc_row][vc_column][vc_column_text]My Bias: market topping process ongoing
Wave Structure: Impulsive 5 wave structure, possibly topping in an all time high.
Long term wave count: Topping in wave (5)
Important risk events: USD: Prelim UoM Consumer Sentiment, FOMC Member Kaplan Speaks.
The DOW sold off powerfully today as expected, dropping 200 points without an answer.
The severity of the decline raises the probability that the more bearish alternate wave count is in fact correct.
This views the recent declines as a series of 1,2 waves to the downside.
The idea of a zigzag correction in wave (ii) grey was ruled out moments ago with a break of the wave (i) low as shown on the short term chart.
The only option left for wave (ii) grey is an expanding flat.
SO,
It is a 50/50 split between the operating wave count and the alternate wave count.
as to which one is correct.
For tomorrow;
If the decline continues,
and traces out a five wave pattern off the resistance line.
It will favor the alternate wave count.
Both wave counts predict larger declines ahead,
The pattern off any recovery in price will indicate which count is more fitting.[/vc_column_text][/vc_column][/vc_row]
[/_s2If]
[_s2If current_user_can(access_s2member_ccap_gold)]
[vc_row][vc_column][vc_separator][/vc_column][/vc_row][vc_row][vc_column][vc_column_text]
GOLD
[/vc_column_text][/vc_column][/vc_row][vc_row][vc_column][vc_separator][/vc_column][/vc_row][vc_row][vc_column width=”2/3″][vc_custom_heading text=”30 min” use_theme_fonts=”yes”][vc_column_text] [/vc_column_text][/vc_column][vc_column width=”1/3″][vc_custom_heading text=”4 Hours” use_theme_fonts=”yes”][vc_column_text]
 [/vc_column_text][vc_custom_heading text=”Daily” use_theme_fonts=”yes”][vc_column_text]
 [/vc_column_text][/vc_column][/vc_row][vc_row][vc_column][vc_column_text]My Bias: Long towards 1550
Wave Structure: ZigZag correction to the upside.
Long term wave count: Topping in wave (B) at 1550
Important risk events: USD: Prelim UoM Consumer Sentiment, FOMC Member Kaplan Speaks.
Gold continued the upside bias today possibly completing wave ‘2’ pink with a minor correction off the high.
This remains to be seen,
But a further break of resistance at 1291 will confirm that wave ‘3’ pink is underway.
The price now needs to rally solidly in wave ‘3’ and carry the price out of the 1200’s ,
And finally back into the upper line of the rising trendchannel.
The 4hr RSI broke up through the centreline again in another bullish momentum signal.
So the wave count is looking in good health right now.
for tomorrow;
Watch for an impulsive break of the resistance at 1291,
Wave ‘3’ pink would meet the trend channel at about 1313,
So that is the initial target for wave ‘3’ pink.[/vc_column_text][/vc_column][/vc_row]
[/_s2If]