
[_s2If current_user_can(access_s2member_ccap_eurusd)]
[vc_row][vc_column][vc_separator border_width=”5″][/vc_column][/vc_row][vc_row][vc_column][vc_column_text]
EURUSD
[/vc_column_text][/vc_column][/vc_row][vc_row][vc_column][vc_separator border_width=”5″][/vc_column][/vc_row][vc_row][vc_column width=”2/3″][vc_custom_heading text=”30 min” use_theme_fonts=”yes”][vc_column_text] [/vc_column_text][/vc_column][vc_column width=”1/3″][vc_custom_heading text=”4 Hours” use_theme_fonts=”yes”][vc_column_text]
 [/vc_column_text][vc_custom_heading text=”Daily” use_theme_fonts=”yes”][vc_column_text]
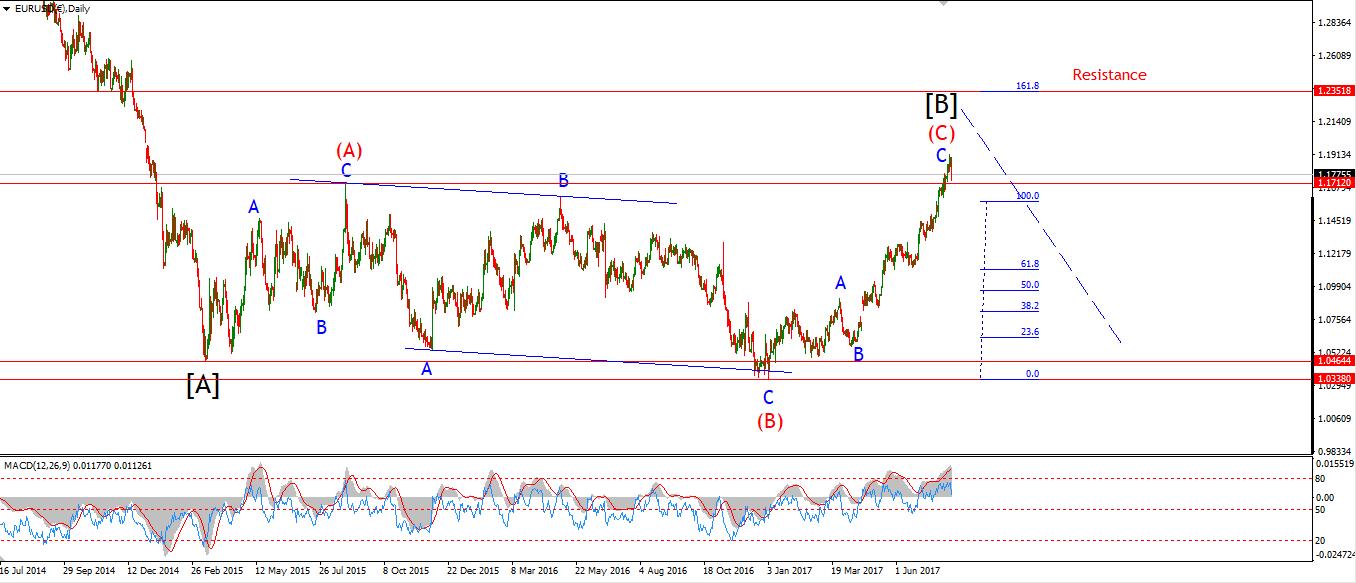 [/vc_column_text][/vc_column][/vc_row][vc_row][vc_column][vc_column_text]My Bias: long term bearish
Wave Structure: downward impulse wave
Long term wave count: lower in wave (3) red
Important risk events: EUR: Final CPI y/y, ECB Monetary Policy Meeting Accounts. USD: Unemployment Claims, Capacity Utilization Rate, Industrial Production m/m.
Evenin Y’all!
Conflicting action in EURUSD today.
The best way to label the declines off the high is as a developing series of 1,2 waves to the downside.
However,
The rally this evening is very impulsive looking.
It is possible that the rally is part of an expanded flat correction off the wave ‘1’ low.
And that is what is shown on the chart.
I am still awaiting a clear indication that this market is turning over to the downside.
If we get another decline below the lower trendline that will do it!
But that decline must start soon.
The wave count is pretty solid.
Upside momentum has died lately,
Also, the price is approaching a break of the 200 period MA on the 4hr chart.
That will happen at about 1.1600, it is a long way down from that point.
That could be the straw to break the back of this rally.
For tomorrow;
The correction in wave ‘2’ looks complete.
So,
Wave ‘3’ grey to the downside must begin soon.
A break of the wave ‘ii’ high at 1.1847 will invalidate this wave count.
Watch for signs of a decline into wave ‘3’ grey.[/vc_column_text][/vc_column][/vc_row]
[/_s2If]
[_s2If current_user_can(access_s2member_ccap_gbpusd)]
[vc_row][vc_column][vc_separator border_width=”5″][/vc_column][/vc_row][vc_row][vc_column][vc_column_text]
GBPUSD
[/vc_column_text][/vc_column][/vc_row][vc_row][vc_column][vc_separator border_width=”5″][/vc_column][/vc_row][vc_row][vc_column width=”2/3″][vc_custom_heading text=”30 min” use_theme_fonts=”yes”][vc_column_text] [/vc_column_text][/vc_column][vc_column width=”1/3″][vc_custom_heading text=”4 Hours” use_theme_fonts=”yes”][vc_column_text]
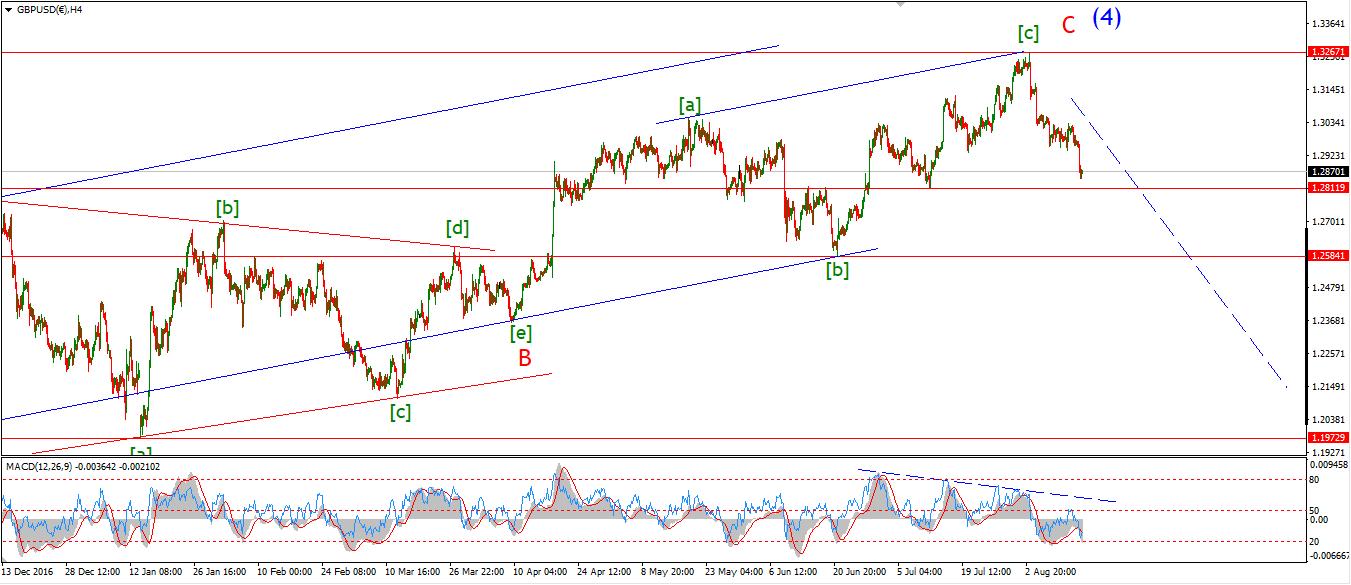 [/vc_column_text][vc_custom_heading text=”Daily” use_theme_fonts=”yes”][vc_column_text]
 [/vc_column_text][/vc_column][/vc_row][vc_row][vc_column][vc_column_text]My Bias: short below parity in wave (5).
Wave Structure: continuing impulsive structure to the downside in wave (5)
Long term wave count: decline in wave (5) blue, below parity
Important risk events: GBP: Retail Sales m/m. USD: Unemployment Claims, Capacity Utilization Rate, Industrial Production m/m.
Cable hardly reacted at all to the FED minutes,
This indicates to me that the the market is more willing to sell GBPUSD into this trend change.
Todays price action is likely a sideways flat correction in wave ‘4’ grey.
Wave ‘5’ grey should follow and take the price below support at 1.2810.
I have shown an alternate wave count circled in red.
The wave structure off the high can also be interpreted as a series of 1,2 waves.
This also predicts a large decline phase dead ahead.
For tomorrow;
Watch for wave ‘4’ to complete below the larger declining trend channel,
Wave ‘v’ will be confirmed with a break of support at 1.2810.[/vc_column_text][/vc_column][/vc_row]
[/_s2If]
[_s2If current_user_can(access_s2member_ccap_usdjpy)]
[vc_row][vc_column][vc_separator border_width=”5″][/vc_column][/vc_row][vc_row][vc_column][vc_column_text]
USDJPY
[/vc_column_text][/vc_column][/vc_row][vc_row][vc_column][vc_separator border_width=”5″][/vc_column][/vc_row][vc_row][vc_column width=”2/3″][vc_custom_heading text=”30 min” use_theme_fonts=”yes”][vc_column_text] [/vc_column_text][/vc_column][vc_column width=”1/3″][vc_custom_heading text=”4 Hours” use_theme_fonts=”yes”][vc_column_text]
 [/vc_column_text][vc_custom_heading text=”Daily” use_theme_fonts=”yes”][vc_column_text]
 [/vc_column_text][/vc_column][/vc_row][vc_row][vc_column][vc_column_text]My Bias: LONG
Wave Structure: rally in wave [C]
Long term wave count: wave [C] is underway, upside to above 136.00
Important risk events: JPY: N/A. USD: Unemployment Claims, Capacity Utilization Rate, Industrial Production m/m.
USDJPY is now on the verge of completing another bullish elliott wave signal off the lows at 1.0872.
The price structure now shows a clear five wave pattern to the upside,
labelled wave ‘i’ brown.
And a clear three wave pattern to the downside with an expanded flat wave ‘ii’ brown.
The probability is now high that wave ‘iii’ will begin off nearby levels.
The 50% retracement level of wave ‘ii’ lies at 109.78.
And the price is approaching that level now.
The 161.8% Fibonnacci extension of wave ‘i’ gives a target for wave ‘iii’ at about 113.20.
For tomorrow;
Watch for the completion of wave ‘ii’,
An impulsive looking higher low will signal a turn higher in wave ‘iii’.[/vc_column_text][/vc_column][/vc_row]
[/_s2If]
[_s2If current_user_can(access_s2member_ccap_dow_jones)]
[vc_row][vc_column][vc_separator][/vc_column][/vc_row][vc_row][vc_column][vc_column_text]
DOW JONES INDUSTRIALS
[/vc_column_text][/vc_column][/vc_row][vc_row][vc_column][vc_separator][/vc_column][/vc_row][vc_row][vc_column width=”2/3″][vc_custom_heading text=”30 min” use_theme_fonts=”yes”][vc_column_text] [/vc_column_text][/vc_column][vc_column width=”1/3″][vc_custom_heading text=”4 Hours” use_theme_fonts=”yes”][vc_column_text]
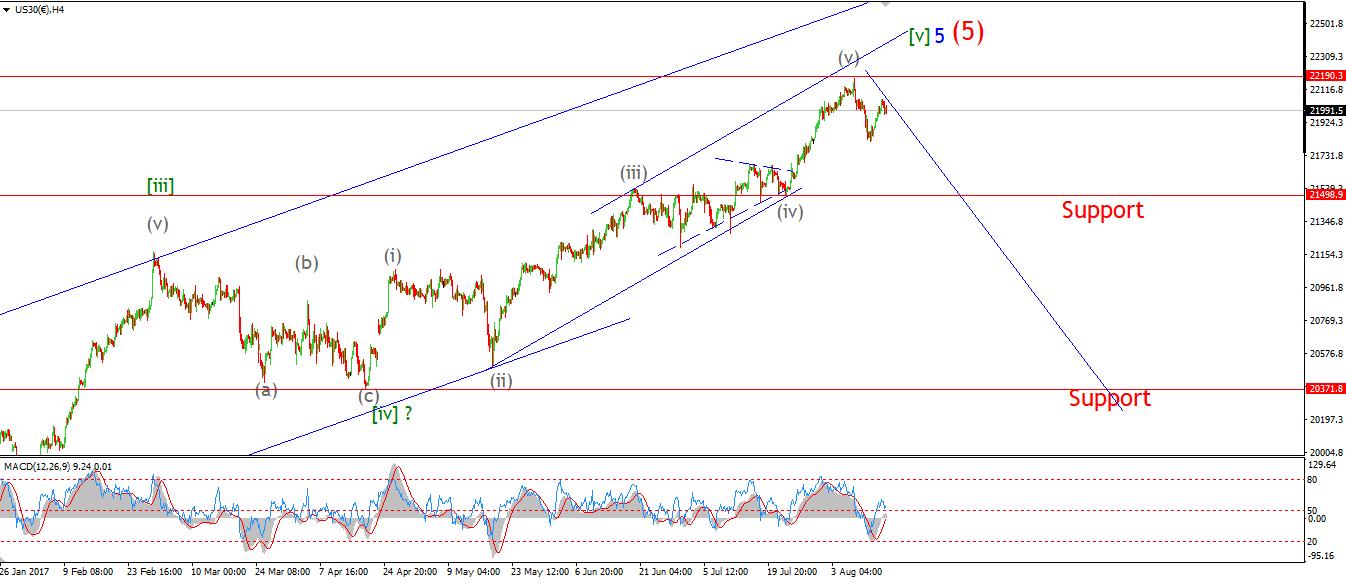 [/vc_column_text][vc_custom_heading text=”Daily” use_theme_fonts=”yes”][vc_column_text]
 [/vc_column_text][/vc_column][/vc_row][vc_row][vc_column][vc_column_text]My Bias: market topping process ongoing
Wave Structure: Impulsive 5 wave structure, possibly topping in an all time high.
Long term wave count: Topping in wave (5)
Important risk events: USD: Unemployment Claims, Capacity Utilization Rate, Industrial Production m/m.
The alternate wave count in the DOW is now looking more likely after todays new intraday high.
I have relabeled the price action as a developing zigzag correction in wave (ii) grey.
Wave ‘a’ is complete,
Wave ‘b’ has possibly started with the sharp decline this evening,
This should trace out three waves as shown on the chart.
And then wave ‘c’ pink will take the price back up to resistance above wave ‘a’.
This topping process will take time to complete,
The extremes in bullishness in the market have a levitating effect on the price that is difficult to break!
But when it inevitably does break.
Overbullish market players will switch to a fully bearish position on a dime!
And they will have no problem crushing your pension fund asset values while chasing the next big trend trade!
And those pension funds have never been more vulnerable than they are right now,
The rush to high yield risk assets over the last few years,
will be remembered in history,
as the biggest single mistake the pension industry has ever made!
But, that is life, even the pro’s get caught on the wrong side of the trade.
For tomorrow;
Watch for a possible decline in wave ‘b’ pink in three waves.[/vc_column_text][/vc_column][/vc_row]
[/_s2If]
[_s2If current_user_can(access_s2member_ccap_gold)]
[vc_row][vc_column][vc_separator][/vc_column][/vc_row][vc_row][vc_column][vc_column_text]
GOLD
[/vc_column_text][/vc_column][/vc_row][vc_row][vc_column][vc_separator][/vc_column][/vc_row][vc_row][vc_column width=”2/3″][vc_custom_heading text=”30 min” use_theme_fonts=”yes”][vc_column_text] [/vc_column_text][/vc_column][vc_column width=”1/3″][vc_custom_heading text=”4 Hours” use_theme_fonts=”yes”][vc_column_text]
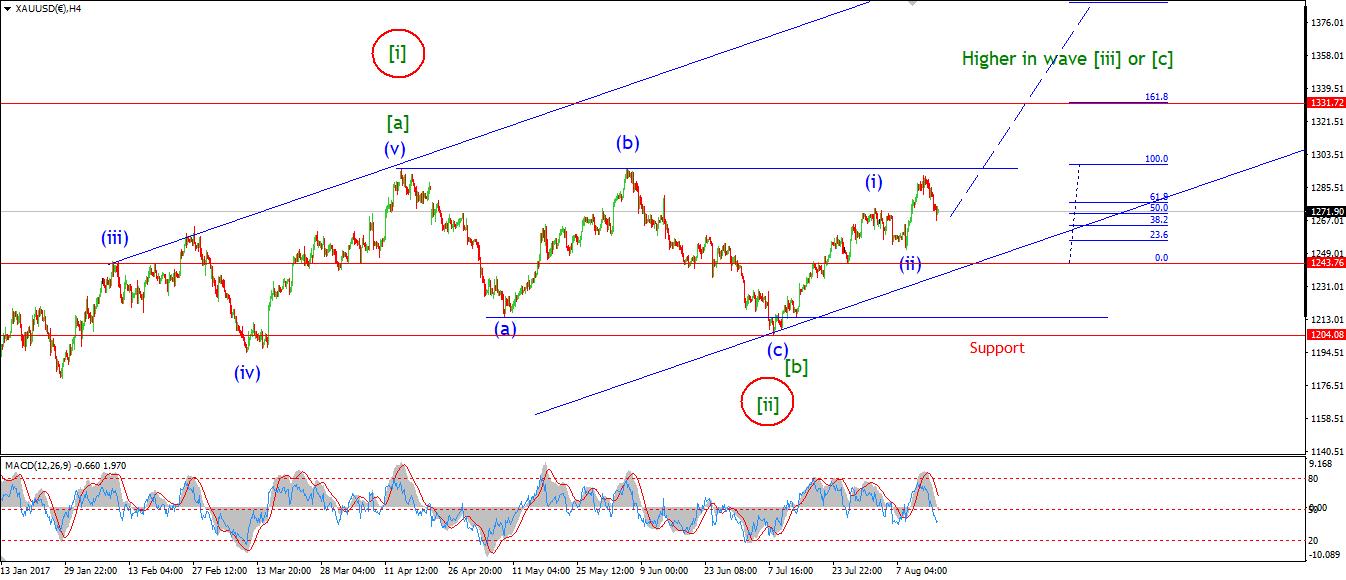 [/vc_column_text][vc_custom_heading text=”Daily” use_theme_fonts=”yes”][vc_column_text]
 [/vc_column_text][/vc_column][/vc_row][vc_row][vc_column][vc_column_text]My Bias: Long towards 1550
Wave Structure: ZigZag correction to the upside.
Long term wave count: Topping in wave (B) at 1550
Important risk events: USD: Unemployment Claims, Capacity Utilization Rate, Industrial Production m/m.
The low labelled wave ‘ii’ brown held today as suggested by last nights wave count.
And the rally off that low, so far looks pretty impulsive.
This price action is again looking very strong, and strengthening the bullish interpretation.
Wave ‘iii’ is possibly underway as of today, and should trace out five internal waves and take the price up into the initial target at 1332.
the rise off tuesdays low is shown as a developing wave ‘1’.
A break of the recent high will confirm this wave count.
For tomorrow;
support should continue to hold at 1267,
watch for a complete five wave form in wave ‘1’ of ‘iii’ to confirm that wave ‘iii’ has begun.[/vc_column_text][/vc_column][/vc_row]
[/_s2If]