
[_s2If current_user_can(access_s2member_ccap_eurusd)]
[vc_row][vc_column][vc_separator border_width=”5″][/vc_column][/vc_row][vc_row][vc_column][vc_column_text]
EURUSD
[/vc_column_text][/vc_column][/vc_row][vc_row][vc_column][vc_separator border_width=”5″][/vc_column][/vc_row][vc_row][vc_column width=”2/3″][vc_custom_heading text=”30 min” use_theme_fonts=”yes”][vc_column_text] [/vc_column_text][/vc_column][vc_column width=”1/3″][vc_custom_heading text=”4 Hours” use_theme_fonts=”yes”][vc_column_text]
 [/vc_column_text][vc_custom_heading text=”Daily” use_theme_fonts=”yes”][vc_column_text]
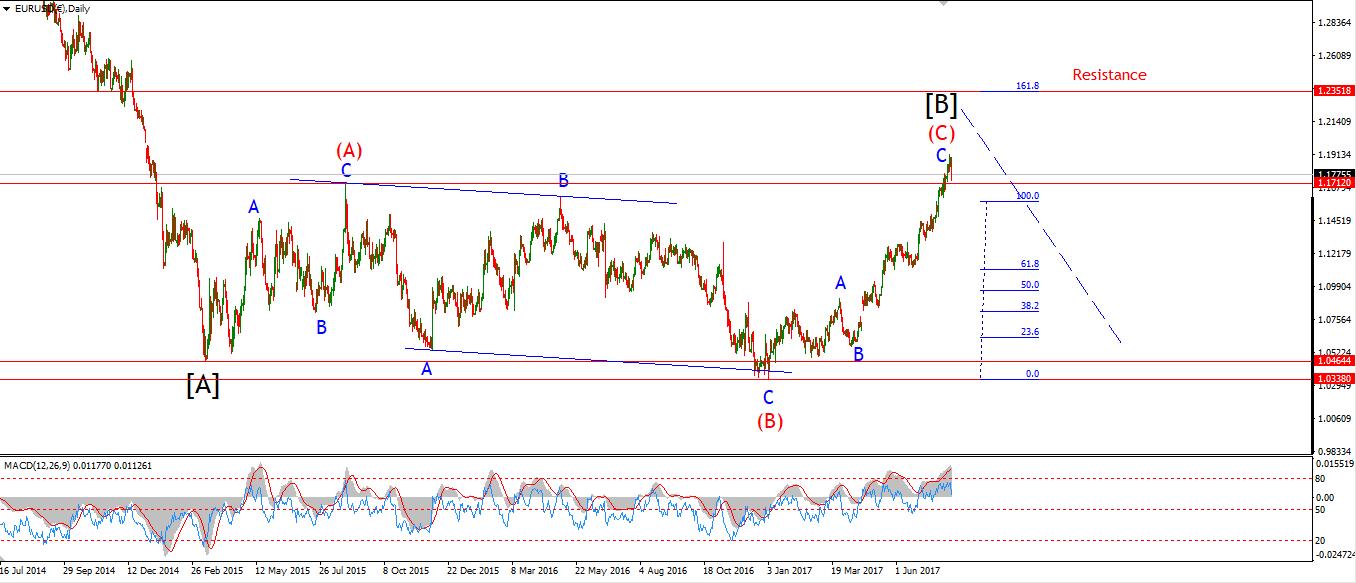 [/vc_column_text][/vc_column][/vc_row][vc_row][vc_column][vc_column_text]My Bias: long term bearish
Wave Structure: downward impulse wave
Long term wave count: lower in wave (3) red
Important risk events: EUR: German Prelim GDP q/q. USD: Retail Sales m/m, Empire State Manufacturing Index, Import Prices m/m.
Good evening one and all!
It has been the week where history could be made!
If the short term wave counts hold up, we may now be watching the final collapse of an extreme bull market.
And along with that,
A resurgent USD, lets get into it!
EURUSD continued a possible correction higher in wave ‘ii’ pink today.
The wave count was calling for a rise into about 1.1800,
and todays high has reached 1.1847.
This correction is stretched now, and should decline again quite quickly.
I have adjusted the labeling in wave ‘ii’ slightly,
It now counts best as a flat correction 3,3,5 structure.
Wave ‘b’ lies at 1.1748,
A decline below this level will signal a turn has begun in wave ‘iii’.
A decline beow the wave ‘i’ low will confirm wave ‘iii’.
For Monday;
Watch for this bearish signal to be confirmed with a break of those levels.[/vc_column_text][/vc_column][/vc_row]
[/_s2If]
[_s2If current_user_can(access_s2member_ccap_gbpusd)]
[vc_row][vc_column][vc_separator border_width=”5″][/vc_column][/vc_row][vc_row][vc_column][vc_column_text]
GBPUSD
[/vc_column_text][/vc_column][/vc_row][vc_row][vc_column][vc_separator border_width=”5″][/vc_column][/vc_row][vc_row][vc_column width=”2/3″][vc_custom_heading text=”30 min” use_theme_fonts=”yes”][vc_column_text] [/vc_column_text][/vc_column][vc_column width=”1/3″][vc_custom_heading text=”4 Hours” use_theme_fonts=”yes”][vc_column_text]
 [/vc_column_text][vc_custom_heading text=”Daily” use_theme_fonts=”yes”][vc_column_text]
 [/vc_column_text][/vc_column][/vc_row][vc_row][vc_column][vc_column_text]My Bias: short below parity in wave (5).
Wave Structure: continuing impulsive structure to the downside in wave (5)
Long term wave count: decline in wave (5) blue, below parity
Important risk events: GBP: CPI y/y. USD: Retail Sales m/m, Empire State Manufacturing Index, Import Prices m/m.
Cable is now on the verge of completing an expanded flat correction in wave ‘ii’ pink.
Wave ‘c’ grey is tracing out a five wave pattern off the lows of the day at 1.2938.
The minimum target for wave ‘c’ grey is at 1.3053
Which is the previous 4th wave.
The 50% retracement level lies at 1.3110.
This market is getting very close to completing a bearish signal also.
An impulsive decline off these resistance levels will be a signal that wave ‘iii’ down is underway.
On the 4hr chart you can see the RSI has given another sell signal with a cross down through the centreline.
The RSI will cross up again as wave ‘ii’ completes,
But the declining trendline will hold momentum down.
For Monday,
Watch for wave ‘ii’ to reach the minimum target,
and be aware that wave ‘iii’ could start soon.[/vc_column_text][/vc_column][/vc_row]
[/_s2If]
[_s2If current_user_can(access_s2member_ccap_usdjpy)]
[vc_row][vc_column][vc_separator border_width=”5″][/vc_column][/vc_row][vc_row][vc_column][vc_column_text]
USDJPY
[/vc_column_text][/vc_column][/vc_row][vc_row][vc_column][vc_separator border_width=”5″][/vc_column][/vc_row][vc_row][vc_column width=”2/3″][vc_custom_heading text=”30 min” use_theme_fonts=”yes”][vc_column_text] [/vc_column_text][/vc_column][vc_column width=”1/3″][vc_custom_heading text=”4 Hours” use_theme_fonts=”yes”][vc_column_text]
 [/vc_column_text][vc_custom_heading text=”Daily” use_theme_fonts=”yes”][vc_column_text]
 [/vc_column_text][/vc_column][/vc_row][vc_row][vc_column][vc_column_text]My Bias: LONG
Wave Structure: rally in wave [C]
Long term wave count: wave [C] is underway, upside to above 136.00
Important risk events: JPY: N/A. USD: Retail Sales m/m, Empire State Manufacturing Index, Import Prices m/m.
USDJPY triggered the alternate wave count today by dropping below support at 108.80.
I have not changed my mind as the the longer term direction of this market.
It will be upwards,
But we must complete this corrective phase first.
The new wave count shows a large complex flat correction in wave [ii] grey.
The price must stay above 107.50 for this wave count to remain valid.
This correction has gone on long enough now and it is time for the rally to take hold in wave [iii] grey.
For next week it is a wait and see situation.
Any impulsive move from here will be viewed as the beginning of wave [iii].[/vc_column_text][/vc_column][/vc_row]
[/_s2If]
[_s2If current_user_can(access_s2member_ccap_dow_jones)]
[vc_row][vc_column][vc_separator][/vc_column][/vc_row][vc_row][vc_column][vc_column_text]
DOW JONES INDUSTRIALS
[/vc_column_text][/vc_column][/vc_row][vc_row][vc_column][vc_separator][/vc_column][/vc_row][vc_row][vc_column width=”2/3″][vc_custom_heading text=”30 min” use_theme_fonts=”yes”][vc_column_text] [/vc_column_text][/vc_column][vc_column width=”1/3″][vc_custom_heading text=”4 Hours” use_theme_fonts=”yes”][vc_column_text]
 [/vc_column_text][vc_custom_heading text=”Daily” use_theme_fonts=”yes”][vc_column_text]
 [/vc_column_text][/vc_column][/vc_row][vc_row][vc_column][vc_column_text]My Bias: market topping process ongoing
Wave Structure: Impulsive 5 wave structure, possibly topping in an all time high.
Long term wave count: Topping in wave (5)
Important risk events: USD: Retail Sales m/m, Empire State Manufacturing Index, Import Prices m/m.
The DOW corrected higher this morning, in a possible wave ‘iv’ pink.
Wave ‘iv’ looks to have traced out an expanded flat.
The declines off todays high again look impulsive, and could be the beginning of wave ‘v’ pink.
should the price continue down to meet the lower trendline again on Monday,
It will complete wave ‘v’ and wave (i) grey.
That action would trace out a clear five wave pattern down off the all time high,
And a three wave correction will be on the cards in wave (ii) grey from that point.
The current action must remain below wave ‘i’ pink at 21999 while the structure completes.
For Monday;
Watch for a decline into the lower trendline in wave ‘v’ pink.
a break of 21750 is the initial target for wave ‘v’.[/vc_column_text][/vc_column][/vc_row]
[/_s2If]
[_s2If current_user_can(access_s2member_ccap_gold)]
[vc_row][vc_column][vc_separator][/vc_column][/vc_row][vc_row][vc_column][vc_column_text]
GOLD
[/vc_column_text][/vc_column][/vc_row][vc_row][vc_column][vc_separator][/vc_column][/vc_row][vc_row][vc_column width=”2/3″][vc_custom_heading text=”30 min” use_theme_fonts=”yes”][vc_column_text] [/vc_column_text][/vc_column][vc_column width=”1/3″][vc_custom_heading text=”4 Hours” use_theme_fonts=”yes”][vc_column_text]
 [/vc_column_text][vc_custom_heading text=”Daily” use_theme_fonts=”yes”][vc_column_text]
 [/vc_column_text][/vc_column][/vc_row][vc_row][vc_column][vc_column_text]My Bias: Long towards 1550
Wave Structure: ZigZag correction to the upside.
Long term wave count: Topping in wave (B) at 1550
Important risk events: USD: Retail Sales m/m, Empire State Manufacturing Index, Import Prices m/m.
GOLD has reached a possible top in wave ‘i’ brown.
Wave ‘ii’ looks to be developing into a flat correction shown in the trend channel.
Todays rise is in three waves so far in wave ‘b’,
And wave ‘c’ shold meet the lower trend line again at about 1280.
The 50% retracement level lies at 1271,
So those two levels give us a nice target zone for wave ‘ii’ brown.
1251.45 is the invalidation line for the very short term count.
So this level should provide significant support as this bullish phase takes hold.
For Monday;
Wathc for wave ‘ii’ to complete with a decline into about 1280.
A further rally above 1291 will indicate that wave ‘iii’ has started.
I hope you all have a relaxing weekend!
Enjoy,
Enda out!
[/vc_column_text][/vc_column][/vc_row]
[/_s2If]