
[_s2If current_user_can(access_s2member_ccap_eurusd)]
[vc_row][vc_column][vc_separator border_width=”5″][/vc_column][/vc_row][vc_row][vc_column][vc_column_text]
EURUSD
[/vc_column_text][/vc_column][/vc_row][vc_row][vc_column][vc_separator border_width=”5″][/vc_column][/vc_row][vc_row][vc_column width=”2/3″][vc_custom_heading text=”30 min” use_theme_fonts=”yes”][vc_column_text] [/vc_column_text][/vc_column][vc_column width=”1/3″][vc_custom_heading text=”4 Hours” use_theme_fonts=”yes”][vc_column_text]
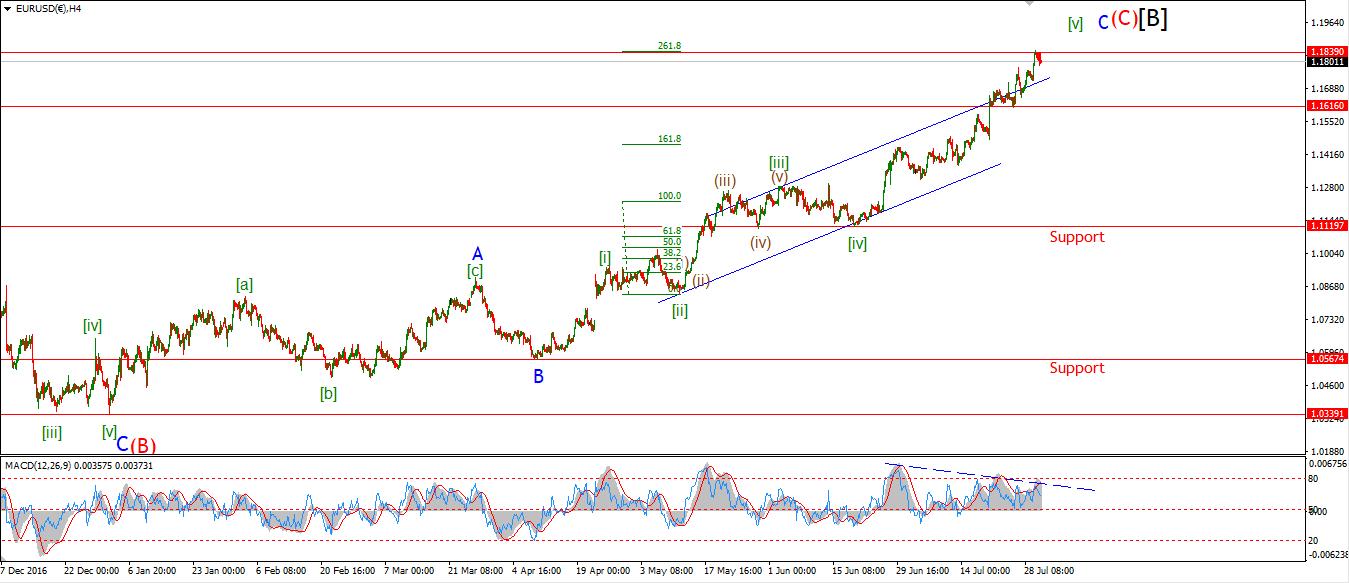 [/vc_column_text][vc_custom_heading text=”Daily” use_theme_fonts=”yes”][vc_column_text]
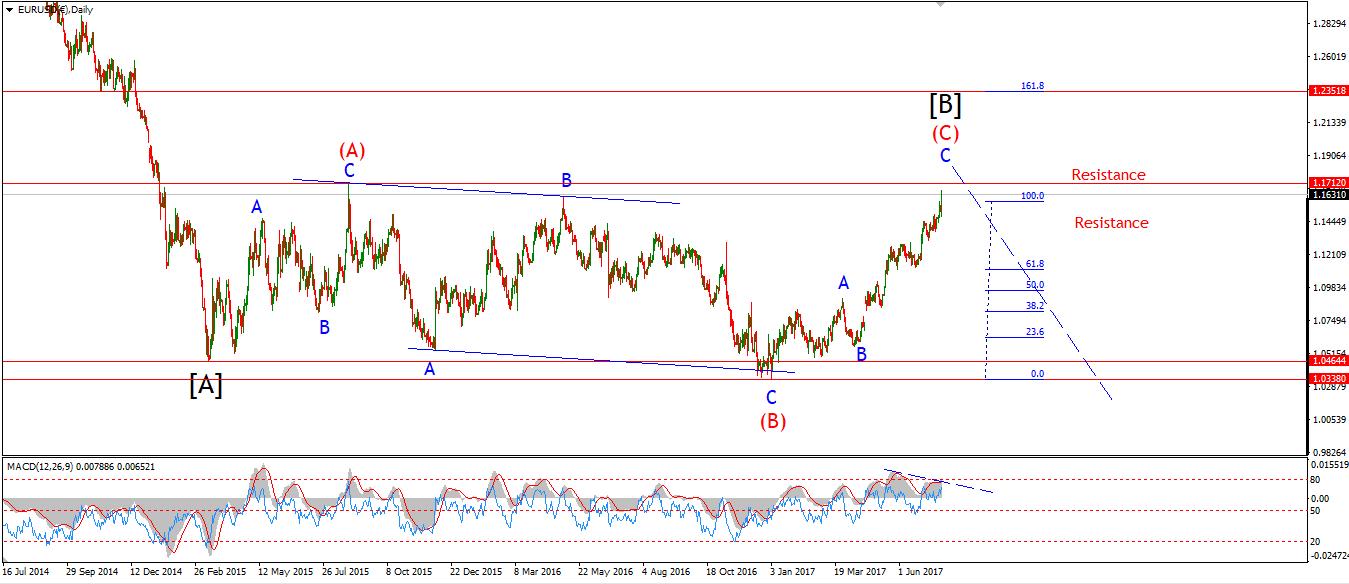 [/vc_column_text][/vc_column][/vc_row][vc_row][vc_column][vc_column_text]My Bias: long term bearish
Wave Structure: downward impulse wave
Long term wave count: lower in wave (3) red
Important risk events: EUR: N/A. USD: Average Hourly Earnings m/m, Non-Farm Employment Change, Unemployment Rate, Trade Balance.
Hi everyone!
It was an interesting day for the dollar today with early signs of strength appearing across the markets.
EURUSD had a very slight decline today off the resistance which sits at 1.1915.
It is very early days,
but the larger picture in EURUSD is of a topping market.
The high sits at 1.1910, lets see if this level holds tomorrow.
The previous wave ‘1’ grey sits at 1.1776,
This is the first level of interest as the market shifts to the downside.
So from now on I will be looking for a bearish Elliott wave signal to form.
With five waves to the downside and a corrective three wave recovery to a lower high.[/vc_column_text][/vc_column][/vc_row]
[/_s2If]
[_s2If current_user_can(access_s2member_ccap_gbpusd)]
[vc_row][vc_column][vc_separator border_width=”5″][/vc_column][/vc_row][vc_row][vc_column][vc_column_text]
GBPUSD
[/vc_column_text][/vc_column][/vc_row][vc_row][vc_column][vc_separator border_width=”5″][/vc_column][/vc_row][vc_row][vc_column width=”2/3″][vc_custom_heading text=”30 min” use_theme_fonts=”yes”][vc_column_text]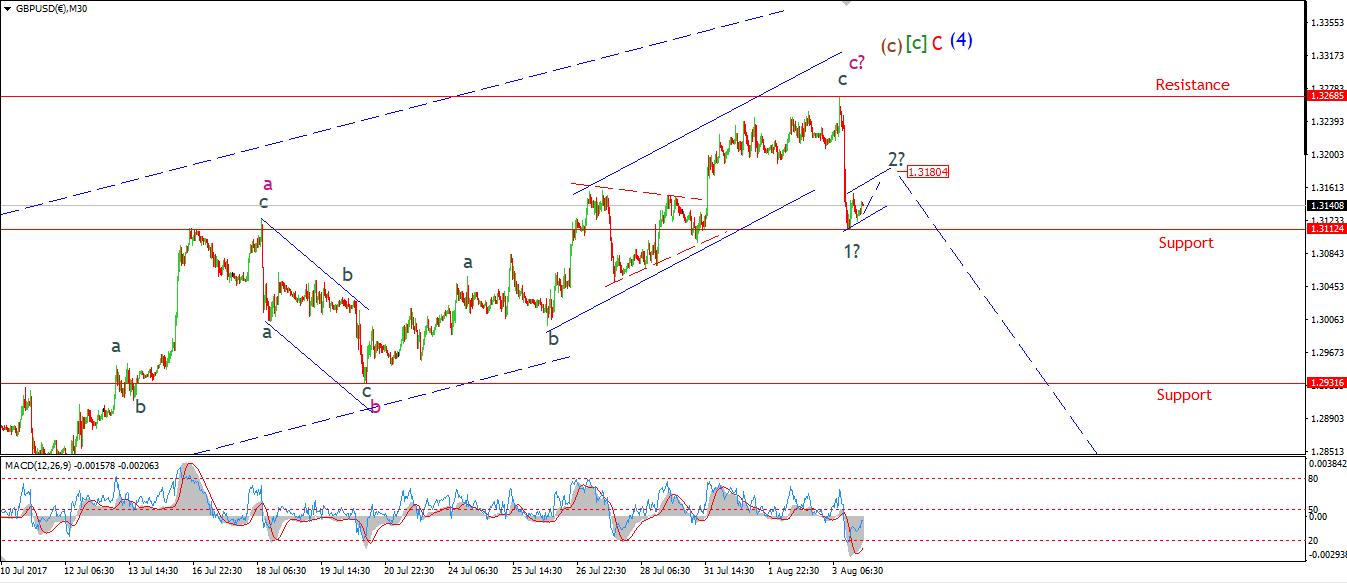 [/vc_column_text][/vc_column][vc_column width=”1/3″][vc_custom_heading text=”4 Hours” use_theme_fonts=”yes”][vc_column_text]
 [/vc_column_text][vc_custom_heading text=”Daily” use_theme_fonts=”yes”][vc_column_text]
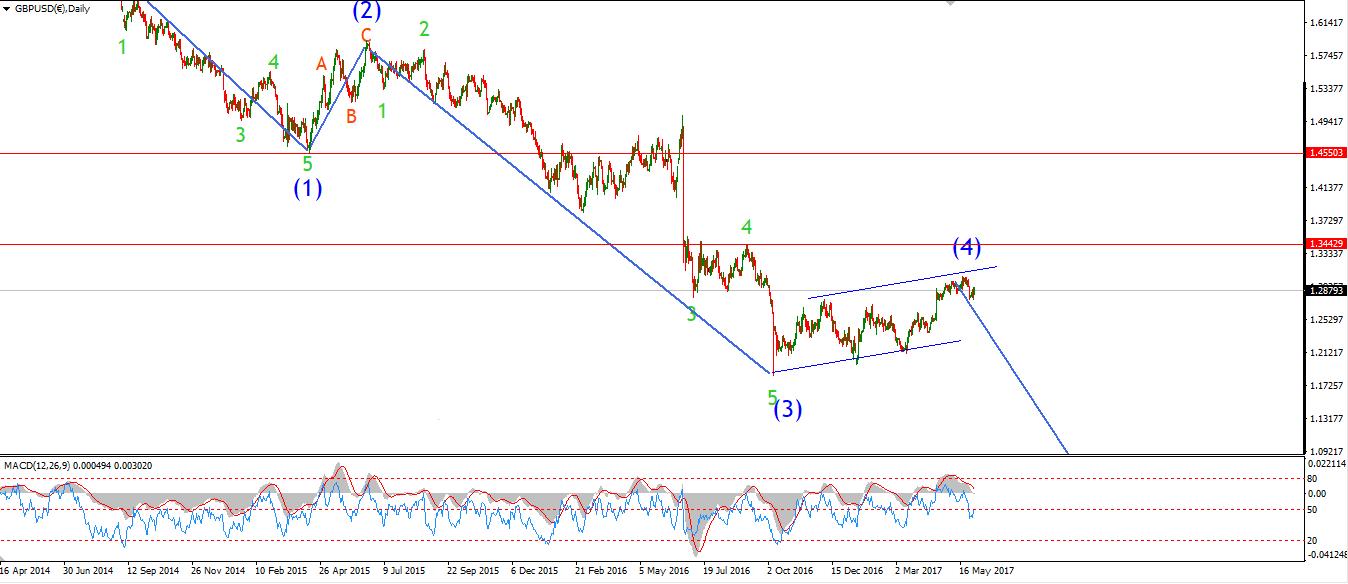 [/vc_column_text][/vc_column][/vc_row][vc_row][vc_column][vc_column_text]My Bias: short below parity in wave (5).
Wave Structure: continuing impulsive structure to the downside in wave (5)
Long term wave count: decline in wave (5) blue, below parity
Important risk events: GBP: N/A. USD: Average Hourly Earnings m/m, Non-Farm Employment Change, Unemployment Rate, Trade Balance.
Cable took a beating today with the first bearish action in two weeks.
We got a slight new high overnight as expected,
And then a very impulsive looking decline this morning.
The wave count is looking for a top to form, and it is getting off to a good start.
I have labelled the decline as a 1,2 formation,
with another push expected into about 1.3180 to complete a three wave form.
The price must then turn down into a possible third wave decline.
The high at 1.3268 is now key resistance for the larger price structure.
The 4hr RSI gave a momentum sell signal also today,
With a downside centreline cross.
The signals are lining up for a possible large degree top formation in progress.
For tomorrow;
Watch for a three wave recovery to complete inside the trend channel.
And a further decline into support.[/vc_column_text][/vc_column][/vc_row]
[/_s2If]
[_s2If current_user_can(access_s2member_ccap_usdjpy)]
[vc_row][vc_column][vc_separator border_width=”5″][/vc_column][/vc_row][vc_row][vc_column][vc_column_text]
USDJPY
[/vc_column_text][/vc_column][/vc_row][vc_row][vc_column][vc_separator border_width=”5″][/vc_column][/vc_row][vc_row][vc_column width=”2/3″][vc_custom_heading text=”30 min” use_theme_fonts=”yes”][vc_column_text]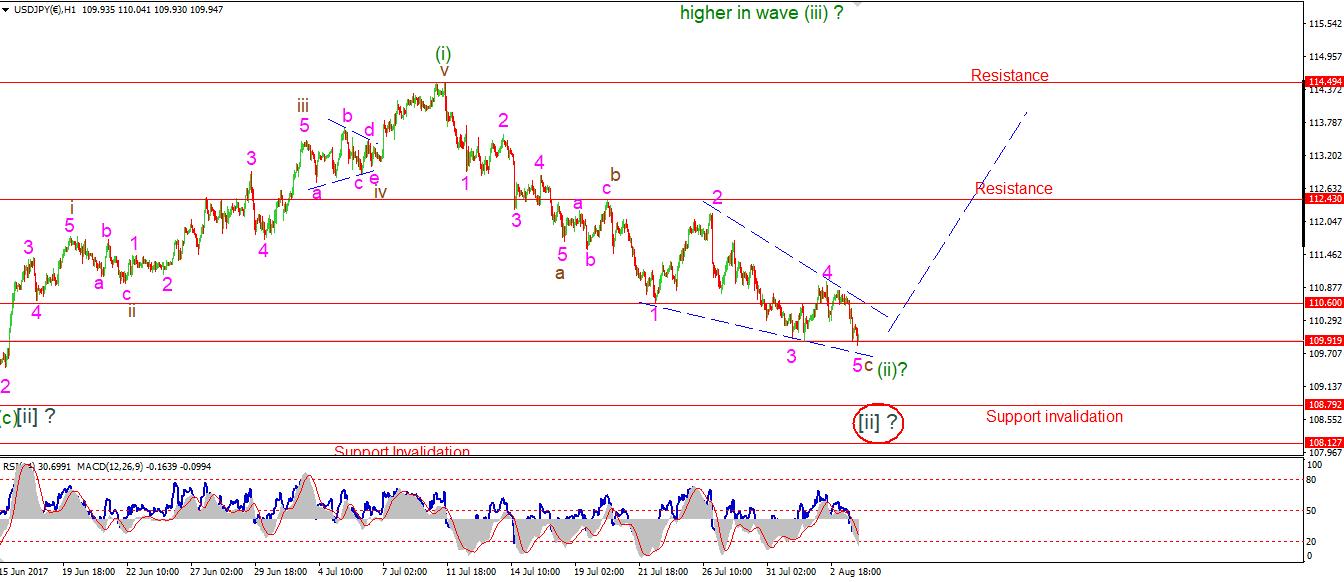 [/vc_column_text][/vc_column][vc_column width=”1/3″][vc_custom_heading text=”4 Hours” use_theme_fonts=”yes”][vc_column_text]
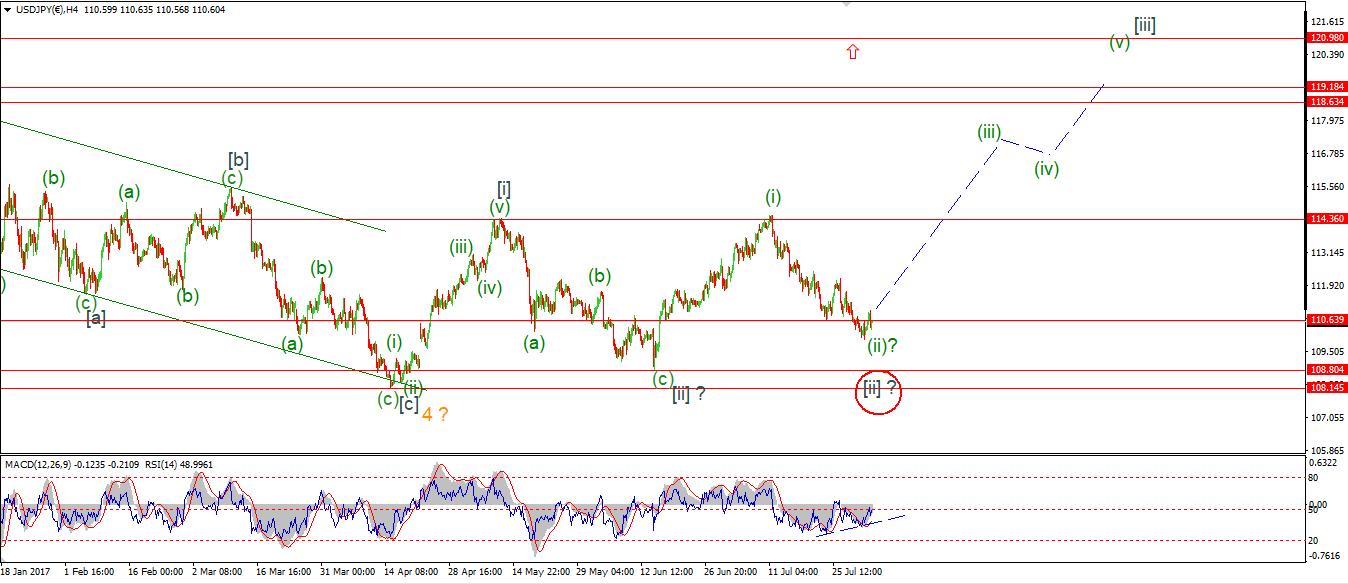 [/vc_column_text][vc_custom_heading text=”Daily” use_theme_fonts=”yes”][vc_column_text]
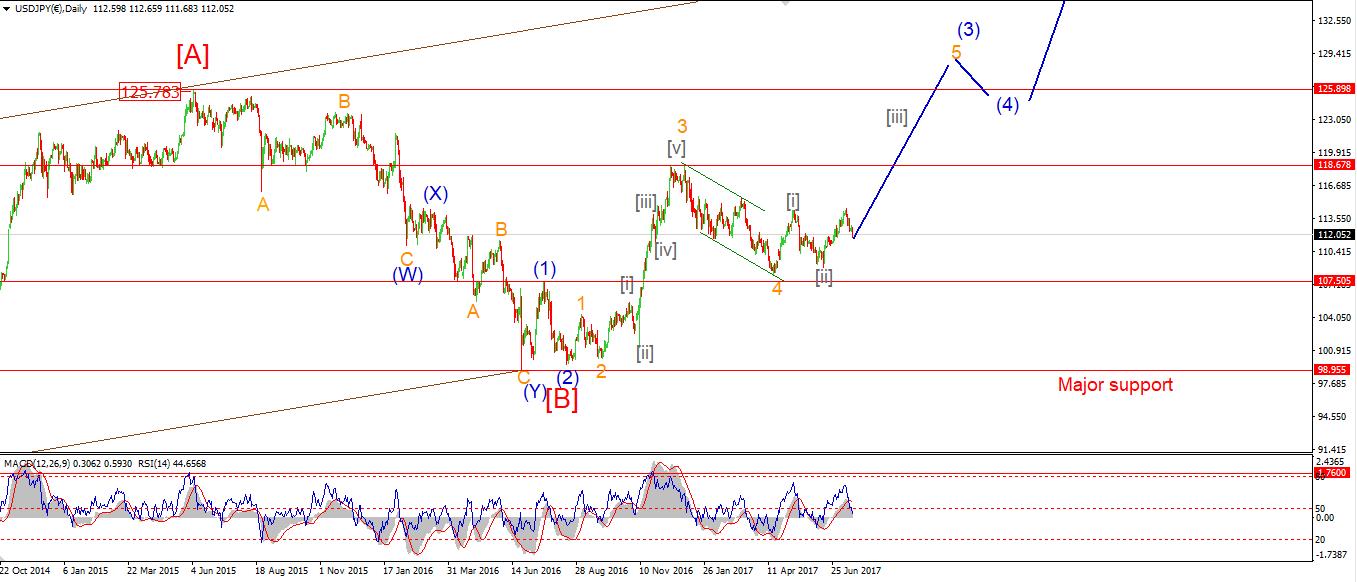 [/vc_column_text][/vc_column][/vc_row][vc_row][vc_column][vc_column_text]My Bias: LONG
Wave Structure: rally in wave [C]
Long term wave count: wave [C] is underway, upside to above 136.00
Important risk events: JPY: N/A. USD: Average Hourly Earnings m/m, Non-Farm Employment Change, Unemployment Rate, Trade Balance.
USDJPY broke short term support at 109.91 this evening.
So the early signs of a reversal are postponed for now.
No matter what way I slice the recent declines,
It still counts best as a corrective structure
rather than a new impulsive decline.
I have altered the labelling of the corrective structure.
It now shows a zigzag decline in wave (ii) green
With an ending diagonal decline in wave ‘c’.
Wave ‘5’ pink will meet the lower trendline again at 109.70.
So for tomorrow;
Watch how the price reacts off that lower trendline at 109.70
A higher low above 110.60 will signal an end to this decline.[/vc_column_text][/vc_column][/vc_row]
[/_s2If]
[_s2If current_user_can(access_s2member_ccap_dow_jones)]
[vc_row][vc_column][vc_separator][/vc_column][/vc_row][vc_row][vc_column][vc_column_text]
DOW JONES INDUSTRIALS
[/vc_column_text][/vc_column][/vc_row][vc_row][vc_column][vc_separator][/vc_column][/vc_row][vc_row][vc_column width=”2/3″][vc_custom_heading text=”30 min” use_theme_fonts=”yes”][vc_column_text] [/vc_column_text][/vc_column][vc_column width=”1/3″][vc_custom_heading text=”4 Hours” use_theme_fonts=”yes”][vc_column_text]
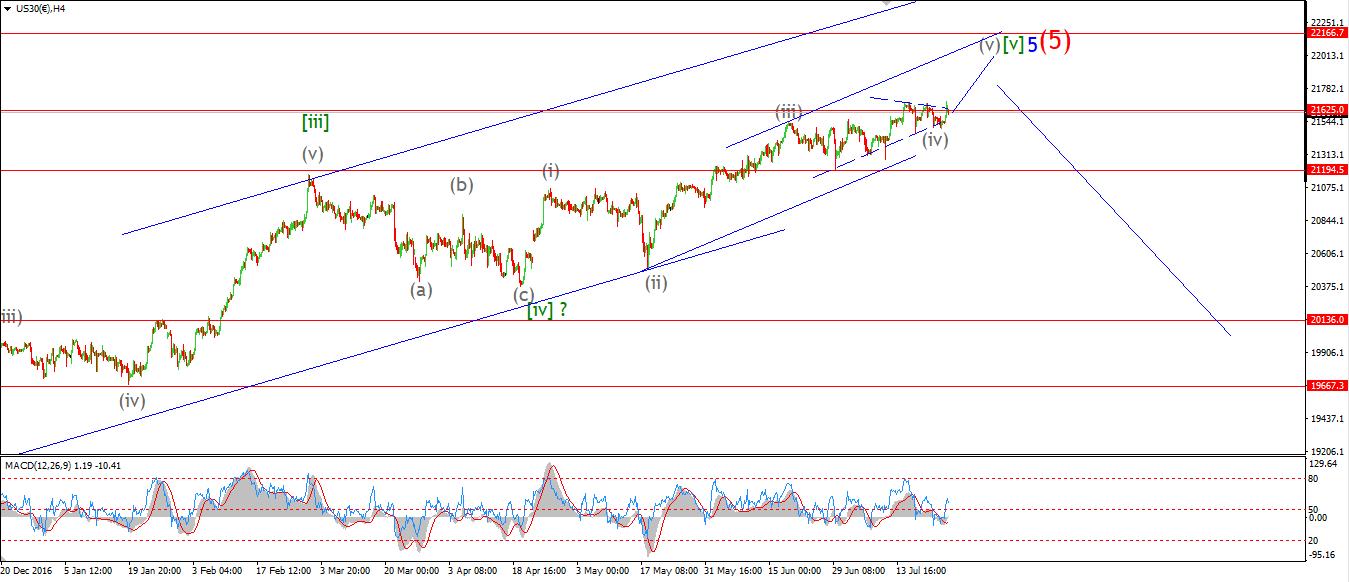 [/vc_column_text][vc_custom_heading text=”Daily” use_theme_fonts=”yes”][vc_column_text]
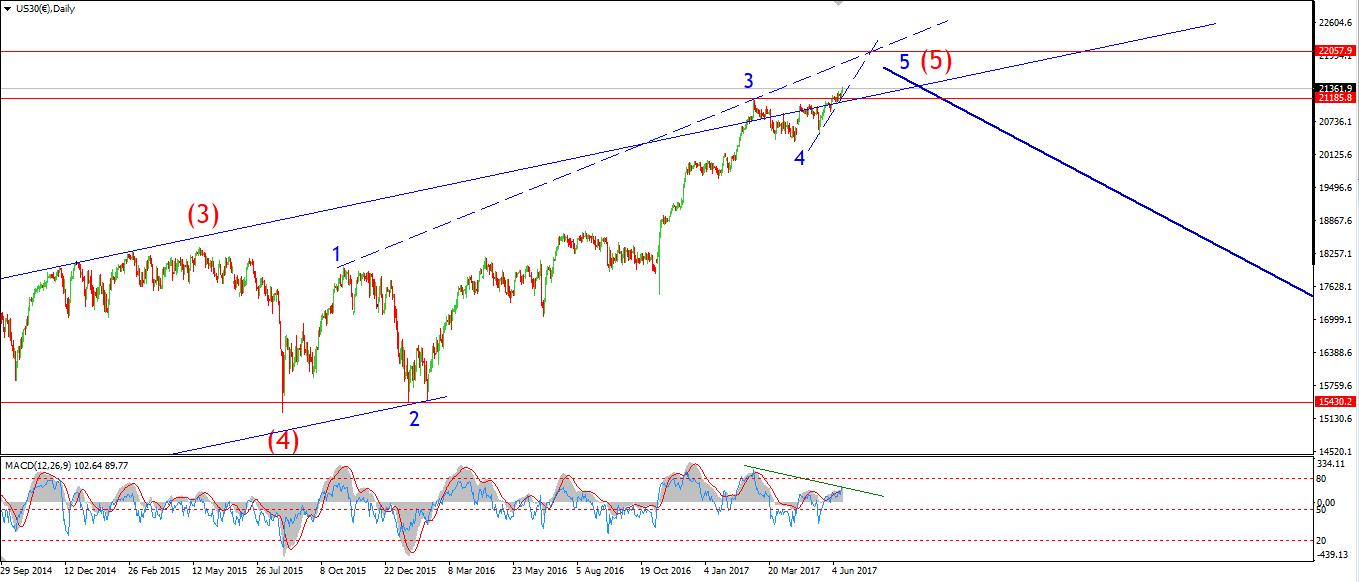 [/vc_column_text][/vc_column][/vc_row][vc_row][vc_column][vc_column_text]My Bias: market topping process ongoing
Wave Structure: Impulsive 5 wave structure, possibly topping in an all time high.
Long term wave count: Topping in wave (5)
Important risk events: USD: Average Hourly Earnings m/m, Non-Farm Employment Change, Unemployment Rate, Trade Balance.
Have you noticed the full scale joy on display across the media for higher priced stocks?
It seems, a more expensive thing is always a better thing!
I do not agree.
The Dow looks to have traced out a contracting triangle over the last few days.
Triangles occur in either wave B or wave 4 as a general rule.
They act as a consolidation move,
before a final wave to complete the larger structure.
Three triangles have formed at various degrees of trend over the last three weeks
This is a signal in itself, of a market running out of steam,
And a price structure which is completing at many degrees of trend.
Both are very true in this case.
Caution is advised for anyone who is still long this market.
Wave ‘iv’ pink may have completed at the low of the day of 21980.
If the price breaks through the all time high again,
This will signal the final run up in wave ‘v’ pink has begun.
The target for wave ‘v’ pink remains at 22200.[/vc_column_text][/vc_column][/vc_row]
[/_s2If]
[_s2If current_user_can(access_s2member_ccap_gold)]
[vc_row][vc_column][vc_separator][/vc_column][/vc_row][vc_row][vc_column][vc_column_text]
GOLD
[/vc_column_text][/vc_column][/vc_row][vc_row][vc_column][vc_separator][/vc_column][/vc_row][vc_row][vc_column width=”2/3″][vc_custom_heading text=”30 min” use_theme_fonts=”yes”][vc_column_text] [/vc_column_text][/vc_column][vc_column width=”1/3″][vc_custom_heading text=”4 Hours” use_theme_fonts=”yes”][vc_column_text]
 [/vc_column_text][vc_custom_heading text=”Daily” use_theme_fonts=”yes”][vc_column_text]
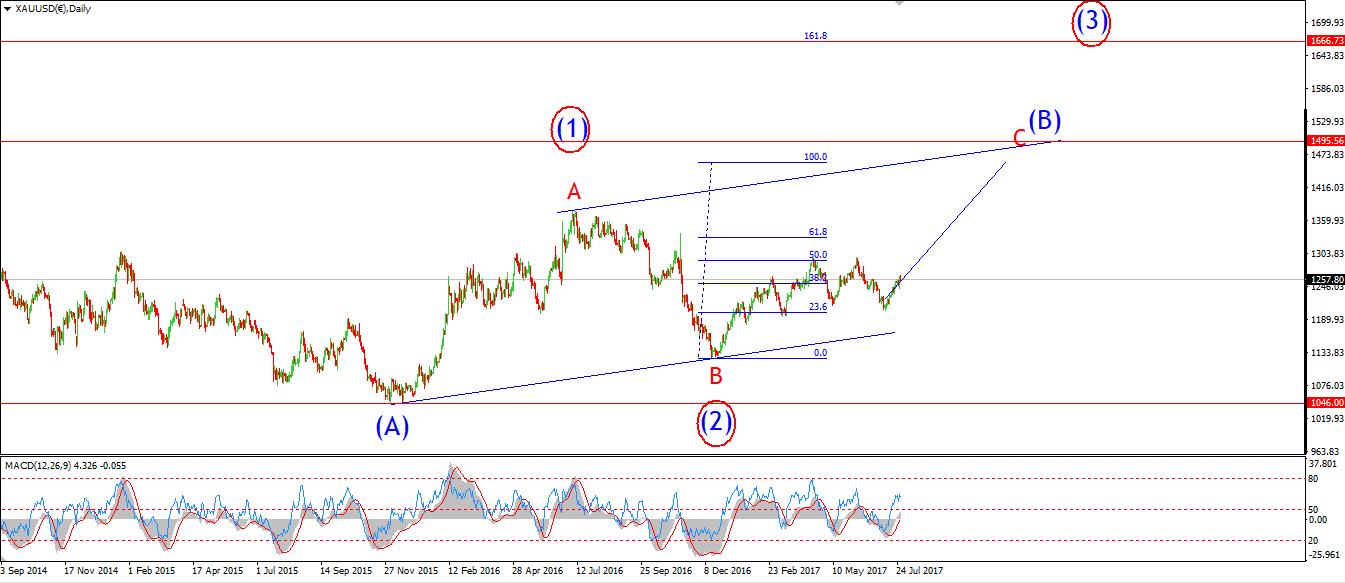 [/vc_column_text][/vc_column][/vc_row][vc_row][vc_column][vc_column_text]My Bias: Long towards 1550
Wave Structure: ZigZag correction to the upside.
Long term wave count: Topping in wave (B) at 1550
Important risk events: USD: Average Hourly Earnings m/m, Non-Farm Employment Change, Unemployment Rate, Trade Balance.
I have altered the short term count after a further decline today,
The decline off the recent high at 1274 is best counted in three waves.
So,
the recent high has taken the wave ‘1’ label,
And GOLD looks to have completed wave ‘2’ pink at todays low of 1256.79.
The price has retraced most of that decline this evening.
Which sets up the possibility for a rally in wave ‘3’ pink over the coming week.
Wave ‘3’ pink should push the price into the 1300 region again,
Ant the price should begin to tag that upper trendline
as is typical for a third wave.
For tomorrow;
A rise above 1274 will likely be within wave ‘3’ pink.[/vc_column_text][/vc_column][/vc_row]
[/_s2If]