
[_s2If current_user_can(access_s2member_ccap_eurusd)]
[vc_row][vc_column][vc_separator border_width=”5″][/vc_column][/vc_row][vc_row][vc_column][vc_column_text]
EURUSD
[/vc_column_text][/vc_column][/vc_row][vc_row][vc_column][vc_separator border_width=”5″][/vc_column][/vc_row][vc_row][vc_column width=”2/3″][vc_custom_heading text=”30 min” use_theme_fonts=”yes”][vc_column_text] [/vc_column_text][/vc_column][vc_column width=”1/3″][vc_custom_heading text=”4 Hours” use_theme_fonts=”yes”][vc_column_text]
 [/vc_column_text][vc_custom_heading text=”Daily” use_theme_fonts=”yes”][vc_column_text]
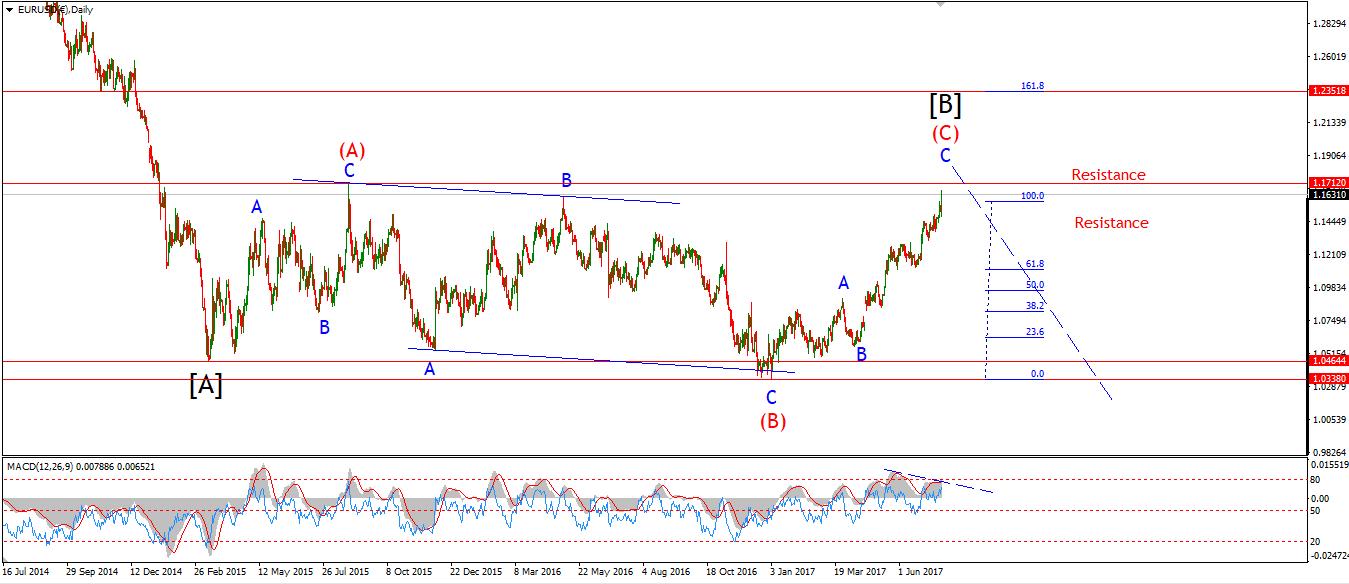 [/vc_column_text][/vc_column][/vc_row][vc_row][vc_column][vc_column_text]My Bias: long term bearish
Wave Structure: downward impulse wave
Long term wave count: lower in wave (3) red
Important risk events: EUR: Prelim Flash GDP q/q. USD: Core PCE Price Index m/m, Personal Spending m/m, ISM Manufacturing PMI.
Hello everyone,
Firstly, I will be away on holidays from 28-08 to 01-09, during that time, I will try to update when I see something important developing.
Before I go on my little holiday;
I will post the first weekly video review,
the video review will then be a weekly feature for full members only.
The cautious stance on EURUSD proved correct today.
The price rallied up to the trendline in a further extension of wave (C) red.
It now looks like wave ‘v’ pink is extending as shown on the short term chart.
On the 4hr chart I have shown the Fibonacci extension of wave [i] green,
projected form the wave [ii] low.
This method projects a high at the 261.8% level of 1.1840.
Todays high reached 1.1844 just a few moments ago.
While the fib extension on the short term chart projects a high at 1.1915.
lets see how the price reacts tomorrow to the upper trendline touch.
EURUSD seems to be moving in lockstep with the stock market now.
both markets have the same long term outcome in-store.[/vc_column_text][/vc_column][/vc_row]
[/_s2If]
[_s2If current_user_can(access_s2member_ccap_gbpusd)]
[vc_row][vc_column][vc_separator border_width=”5″][/vc_column][/vc_row][vc_row][vc_column][vc_column_text]
GBPUSD
[/vc_column_text][/vc_column][/vc_row][vc_row][vc_column][vc_separator border_width=”5″][/vc_column][/vc_row][vc_row][vc_column width=”2/3″][vc_custom_heading text=”30 min” use_theme_fonts=”yes”][vc_column_text] [/vc_column_text][/vc_column][vc_column width=”1/3″][vc_custom_heading text=”4 Hours” use_theme_fonts=”yes”][vc_column_text]
 [/vc_column_text][vc_custom_heading text=”Daily” use_theme_fonts=”yes”][vc_column_text]
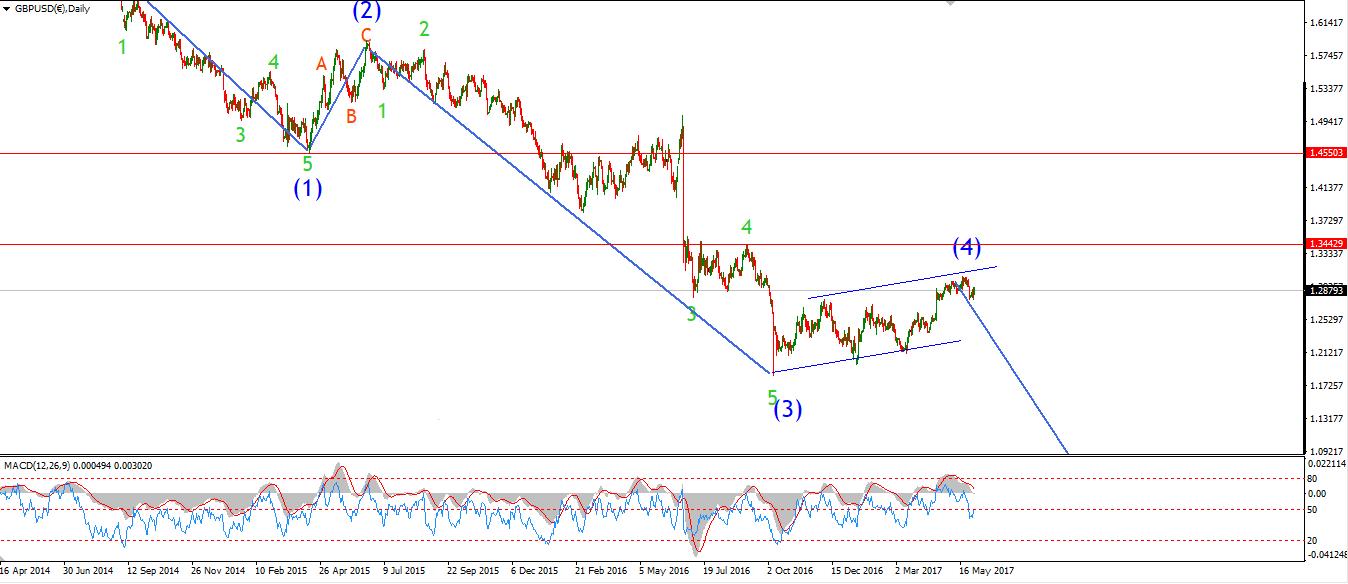 [/vc_column_text][/vc_column][/vc_row][vc_row][vc_column][vc_column_text]My Bias: short below parity in wave (5).
Wave Structure: continuing impulsive structure to the downside in wave (5)
Long term wave count: decline in wave (5) blue, below parity
Important risk events: GBP: Manufacturing PMI. USD: Core PCE Price Index m/m, Personal Spending m/m, ISM Manufacturing PMI.
The upper target in cable is coming into focus now
after a further rally today in wave ‘c’ grey.
The upper trendline will be met at 1.3250, todays high reached 1.3204.
1.3250 is where wave ‘c’ pink reaches equality with wave ‘a’ pink.
On the 4hr chart,
The rising trend channel in wave ‘C’ red will be met at 1.3290.
So, for tomorrow;
Watch the reaction to a break into the price range of 1.3250 – 1.3290.[/vc_column_text][/vc_column][/vc_row]
[/_s2If]
[_s2If current_user_can(access_s2member_ccap_usdjpy)]
[vc_row][vc_column][vc_separator border_width=”5″][/vc_column][/vc_row][vc_row][vc_column][vc_column_text]
USDJPY
[/vc_column_text][/vc_column][/vc_row][vc_row][vc_column][vc_separator border_width=”5″][/vc_column][/vc_row][vc_row][vc_column width=”2/3″][vc_custom_heading text=”30 min” use_theme_fonts=”yes”][vc_column_text] [/vc_column_text][/vc_column][vc_column width=”1/3″][vc_custom_heading text=”4 Hours” use_theme_fonts=”yes”][vc_column_text]
 [/vc_column_text][vc_custom_heading text=”Daily” use_theme_fonts=”yes”][vc_column_text]
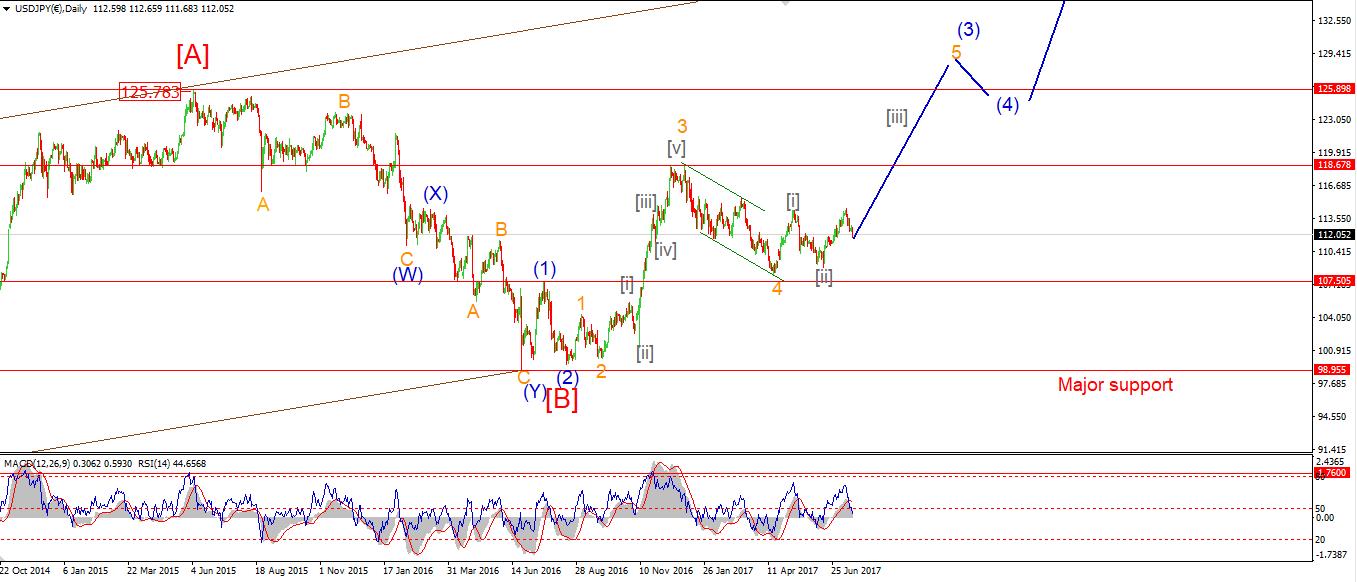 [/vc_column_text][/vc_column][/vc_row][vc_row][vc_column][vc_column_text]My Bias: LONG
Wave Structure: rally in wave [C]
Long term wave count: wave [C] is underway, upside to above 136.00
Important risk events: JPY: N/A. USD: Core PCE Price Index m/m, Personal Spending m/m, ISM Manufacturing PMI.
Momentum to the downside has declined noticeably today.
The 4hr RSI and MACD are showing a higher low above last weeks peak downside momentum.
So there is an increasing chance that the price has reached its lows now.
After a bit of soul searching today,
I have now altered the short term wave count to show a flat correction in wave ‘c’ brown.
The price has reached the lower trendline twice today.
So, there is signs of support at these levels.
1.1243 is the first significant resistance level,
A break above that level will shift the focus firmly higher again.[/vc_column_text][/vc_column][/vc_row]
[/_s2If]
[_s2If current_user_can(access_s2member_ccap_dow_jones)]
[vc_row][vc_column][vc_separator][/vc_column][/vc_row][vc_row][vc_column][vc_column_text]
DOW JONES INDUSTRIALS
[/vc_column_text][/vc_column][/vc_row][vc_row][vc_column][vc_separator][/vc_column][/vc_row][vc_row][vc_column width=”2/3″][vc_custom_heading text=”30 min” use_theme_fonts=”yes”][vc_column_text] [/vc_column_text][/vc_column][vc_column width=”1/3″][vc_custom_heading text=”4 Hours” use_theme_fonts=”yes”][vc_column_text]
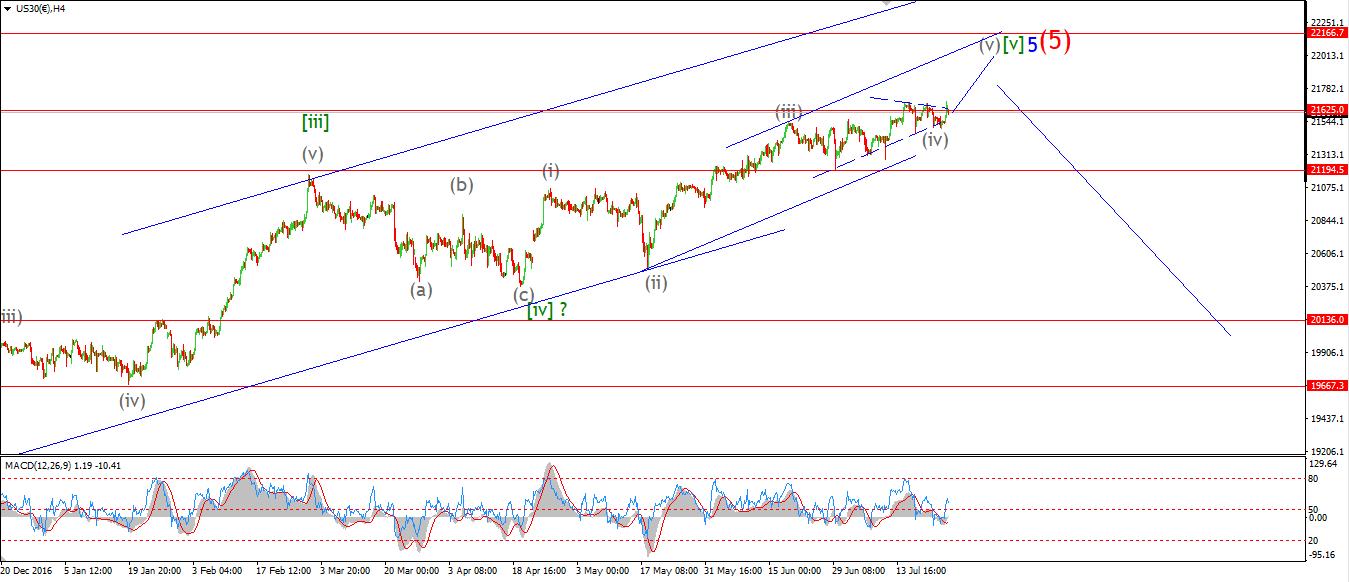 [/vc_column_text][vc_custom_heading text=”Daily” use_theme_fonts=”yes”][vc_column_text]
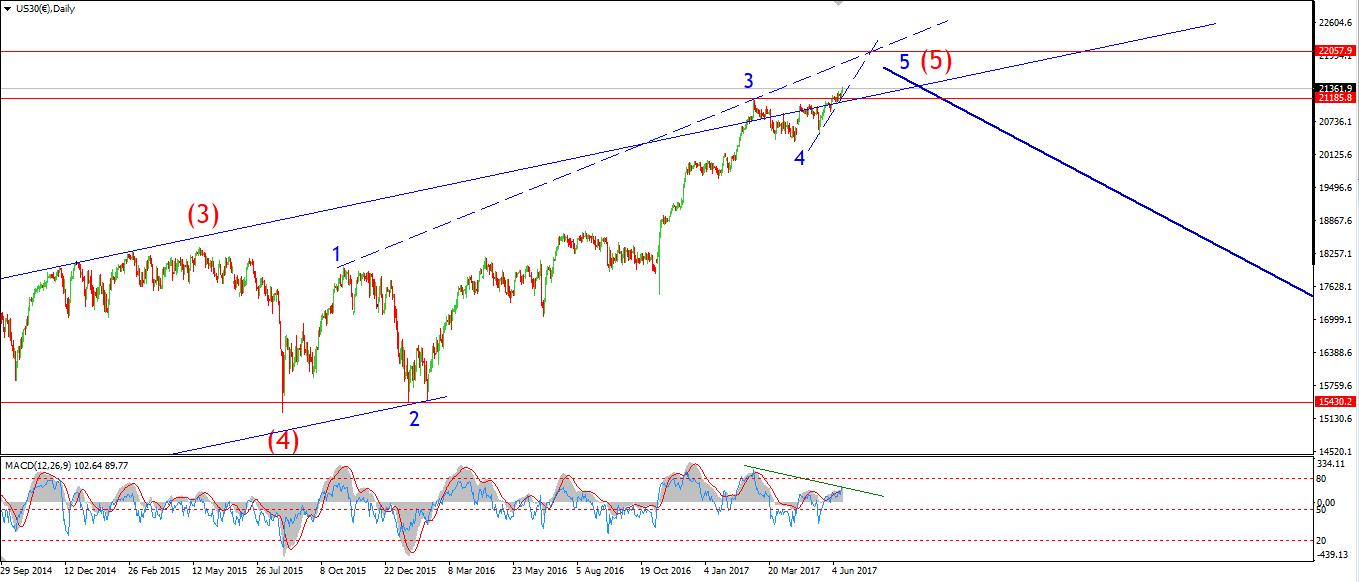 [/vc_column_text][/vc_column][/vc_row][vc_row][vc_column][vc_column_text]My Bias: market topping process ongoing
Wave Structure: Impulsive 5 wave structure, possibly topping in an all time high.
Long term wave count: Topping in wave (5)
Important risk events: USD: Core PCE Price Index m/m, Personal Spending m/m, ISM Manufacturing PMI.
Despite my doubts about Friday’s corrective looking gains,
The price managed to push higher into the wave ‘iii’ target level today.
I have altered the labelling to account for this rally.
21934 was the suggested minimum target for wave ‘iii’ pink,
So the price is approaching these levels now.
Given the price structure will be entering a series of fourth wave corrections soon.
The price action should begin to flatten out over the next few days.
For tomorrow;
Keep in mind that wave ‘iv’ pink should not cross down into the price territory of wave ‘i’ pink before completing.
The high of wave ‘i’ pink lies at 21736
So this is the first major support level to watch.
The upper target remains above 22000 to complete.[/vc_column_text][/vc_column][/vc_row]
[/_s2If]
[_s2If current_user_can(access_s2member_ccap_gold)]
[vc_row][vc_column][vc_separator][/vc_column][/vc_row][vc_row][vc_column][vc_column_text]
GOLD
[/vc_column_text][/vc_column][/vc_row][vc_row][vc_column][vc_separator][/vc_column][/vc_row][vc_row][vc_column width=”2/3″][vc_custom_heading text=”30 min” use_theme_fonts=”yes”][vc_column_text] [/vc_column_text][/vc_column][vc_column width=”1/3″][vc_custom_heading text=”4 Hours” use_theme_fonts=”yes”][vc_column_text]
 [/vc_column_text][vc_custom_heading text=”Daily” use_theme_fonts=”yes”][vc_column_text]
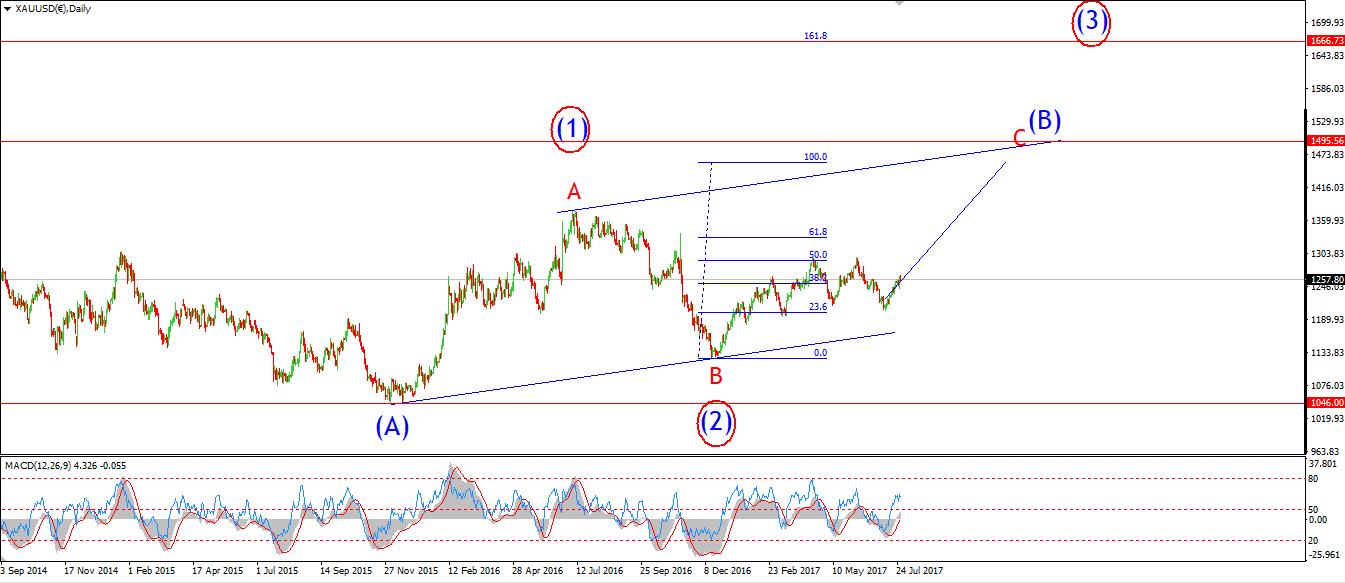 [/vc_column_text][/vc_column][/vc_row][vc_row][vc_column][vc_column_text]My Bias: Long towards 1550
Wave Structure: ZigZag correction to the upside.
Long term wave count: Topping in wave (B) at 1550
Important risk events: USD: Core PCE Price Index m/m, Personal Spending m/m, ISM Manufacturing PMI.
GOLD has now rallied for three weeks off the severe oversold levels of early July.
the short term labeling indicates that the price may be rising in wave ‘iii’ brown.
With the first leg up in wave ‘iii’ now complete,
It is time to look for a minor correction in wave ‘2’ pink,
possibly into the lower trendline at about 1258.
Wave ‘3’ pink should bring a large rally
Which should carry the price into the 1300 bracket again.
The alternate wave count has not yet been ruled out.
This count proposes a larger wave ‘ii’ brown which is yet to complete.
The low of wave ‘ii’ in that scenario would reach below 1243.58, in an expanded flat correction.
For tomorrow;
Watch for wave ‘2’ pink to begin.
A break of 1243.58 will confirm the alternate wave count.[/vc_column_text][/vc_column][/vc_row]
[/_s2If]