
[_s2If current_user_can(access_s2member_ccap_eurusd)]
[vc_row][vc_column][vc_separator border_width=”5″][/vc_column][/vc_row][vc_row][vc_column][vc_column_text]
EURUSD
[/vc_column_text][/vc_column][/vc_row][vc_row][vc_column][vc_separator border_width=”5″][/vc_column][/vc_row][vc_row][vc_column width=”2/3″][vc_custom_heading text=”30 min” use_theme_fonts=”yes”][vc_column_text] [/vc_column_text][/vc_column][vc_column width=”1/3″][vc_custom_heading text=”4 Hours” use_theme_fonts=”yes”][vc_column_text]
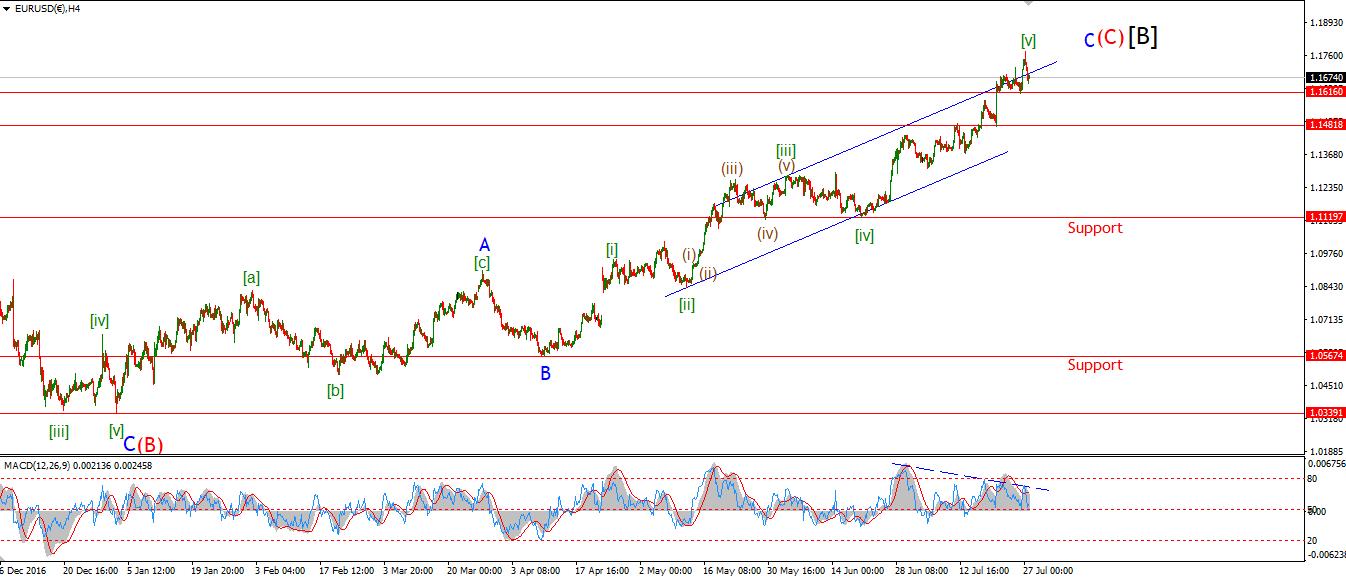 [/vc_column_text][vc_custom_heading text=”Daily” use_theme_fonts=”yes”][vc_column_text]
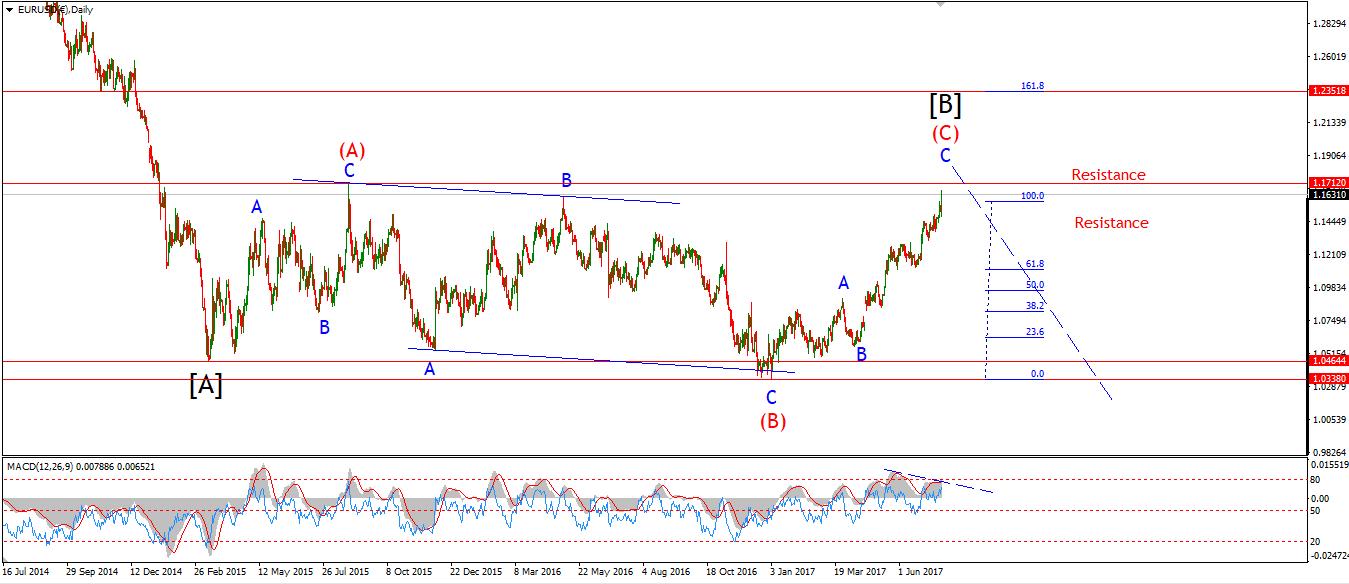 [/vc_column_text][/vc_column][/vc_row][vc_row][vc_column][vc_column_text]My Bias: long term bearish
Wave Structure: downward impulse wave
Long term wave count: lower in wave (3) red
Important risk events: EUR: German Retail Sales m/m, CPI Flash Estimate y/y. USD: Chicago PMI, Pending Home Sales m/m.
Good night and welcome to the weekend.
We have reached the end of July, life is just whizzing by these days!
Thursday’s decline in EURUSD was met by a rally back to a lower high today.
The rally was expected in a possible wave ‘ii’ pink.
Although it is close to breaking the high at 1.1776.
It must turn down from these highs to remain immediately bearish.
I have relabelled the rise off the wave (iv) low to reflect the extent of the rally.
Wave (v) brown has extended in wave ‘i’ and wave ‘iii’,
which accounts for the precarious high it is sitting at right now.
For next week;
I remain in a wait and see mode,
The technical setup shows a rally which is on its last legs.
RSI bearish divergence is still very evident.
Lets see if the price follows suit next week.[/vc_column_text][/vc_column][/vc_row]
[/_s2If]
[_s2If current_user_can(access_s2member_ccap_gbpusd)]
[vc_row][vc_column][vc_separator border_width=”5″][/vc_column][/vc_row][vc_row][vc_column][vc_column_text]
GBPUSD
[/vc_column_text][/vc_column][/vc_row][vc_row][vc_column][vc_separator border_width=”5″][/vc_column][/vc_row][vc_row][vc_column width=”2/3″][vc_custom_heading text=”30 min” use_theme_fonts=”yes”][vc_column_text] [/vc_column_text][/vc_column][vc_column width=”1/3″][vc_custom_heading text=”4 Hours” use_theme_fonts=”yes”][vc_column_text]
 [/vc_column_text][vc_custom_heading text=”Daily” use_theme_fonts=”yes”][vc_column_text]
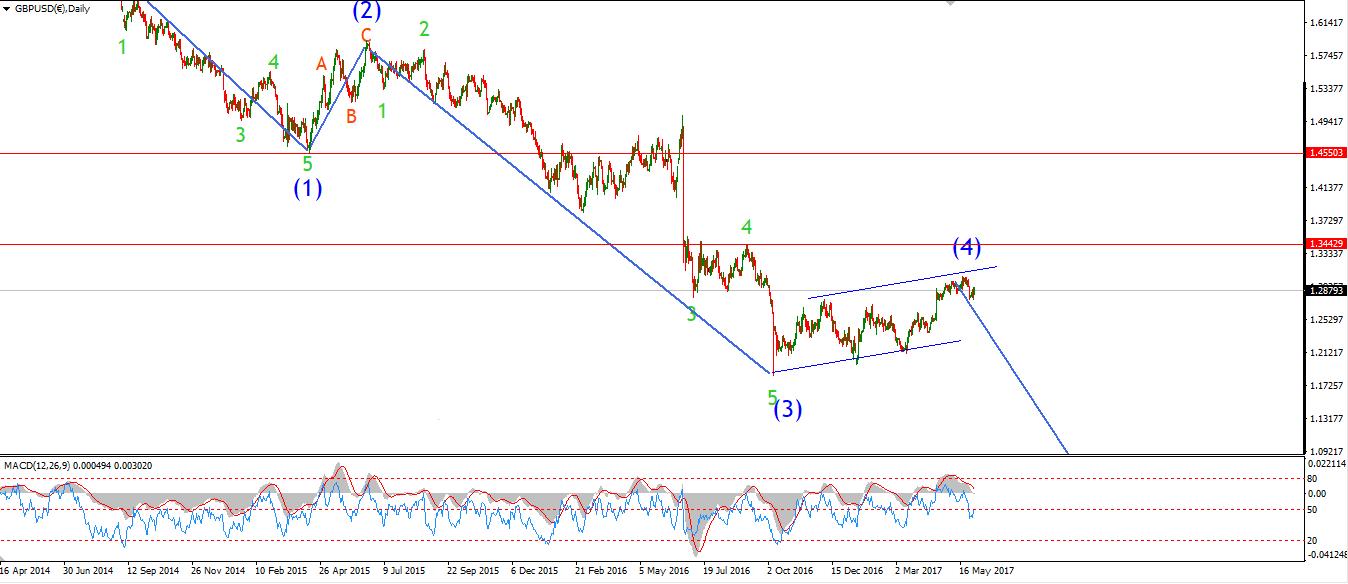 [/vc_column_text][/vc_column][/vc_row][vc_row][vc_column][vc_column_text]My Bias: short below parity in wave (5).
Wave Structure: continuing impulsive structure to the downside in wave (5)
Long term wave count: decline in wave (5) blue, below parity
Important risk events: GBP: Net Lending to Individuals m/m. USD: Chicago PMI, Pending Home Sales m/m.
Todays rally is in keeping with the wave count, but
did not rule out the alternate wave count either!
The price sits just below resistance at the previous high of 1.3160.
A break above this level will confirm the rally into the target of 1.3250.
The price rise over the last few days does have a corrective look to it,
So, I am keeping an open mind right now.
For next week;
1.2999 remains the point of focus on the short term chart,
A break below this point will be the first indication that the corrective rally is over.
A break below support at 1.2931, wave (b), will all but confirm a turn back into the down trend.[/vc_column_text][/vc_column][/vc_row]
[/_s2If]
[_s2If current_user_can(access_s2member_ccap_usdjpy)]
[vc_row][vc_column][vc_separator border_width=”5″][/vc_column][/vc_row][vc_row][vc_column][vc_column_text]
USDJPY
[/vc_column_text][/vc_column][/vc_row][vc_row][vc_column][vc_separator border_width=”5″][/vc_column][/vc_row][vc_row][vc_column width=”2/3″][vc_custom_heading text=”30 min” use_theme_fonts=”yes”][vc_column_text] [/vc_column_text][/vc_column][vc_column width=”1/3″][vc_custom_heading text=”4 Hours” use_theme_fonts=”yes”][vc_column_text]
 [/vc_column_text][vc_custom_heading text=”Daily” use_theme_fonts=”yes”][vc_column_text]
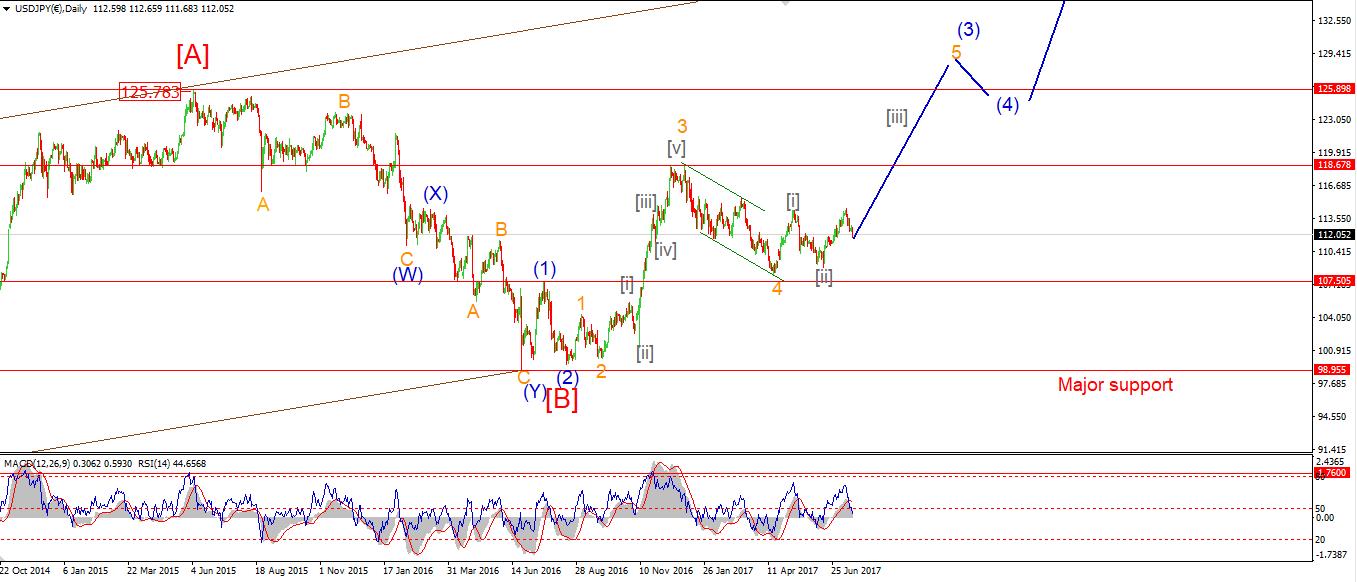 [/vc_column_text][/vc_column][/vc_row][vc_row][vc_column][vc_column_text]My Bias: LONG
Wave Structure: rally in wave [C]
Long term wave count: wave [C] is underway, upside to above 136.00
Important risk events: JPY: N/A. USD: Chicago PMI, Pending Home Sales m/m.
Despite a bullish turn to the upside this week in a five wave pattern.
The price dipped below support this evening and ruled out the bullish pattern.
I have altered the wave count for wave (ii) green to account for this action.
The overall pattern is still bullish,
And the decline is still viewed as wave (ii) green so far.
This correction is being persistent though!
It looks like wave ‘b’ brown has taken the form of a running flat correction.
Notice where wave ‘c’ did not break the high of wave ‘a’.
And this is where the wave count gets tricky!
Wave (ii) green is viewed as a double combination,
And should take a 3,3,3 wave structure.
Wave ‘a’ traced out 3 waves,
Wave ‘b’ also traced out three waves
therefore wave ‘c’ take a three wave form.
For next week,
watch for wave ‘c’ pink to complete at 1.0973.
The alternate wave count on the 4hr chart is still a possibility.[/vc_column_text][/vc_column][/vc_row]
[/_s2If]
[_s2If current_user_can(access_s2member_ccap_dow_jones)]
[vc_row][vc_column][vc_separator][/vc_column][/vc_row][vc_row][vc_column][vc_column_text]
DOW JONES INDUSTRIALS
[/vc_column_text][/vc_column][/vc_row][vc_row][vc_column][vc_separator][/vc_column][/vc_row][vc_row][vc_column width=”2/3″][vc_custom_heading text=”30 min” use_theme_fonts=”yes”][vc_column_text] [/vc_column_text][/vc_column][vc_column width=”1/3″][vc_custom_heading text=”4 Hours” use_theme_fonts=”yes”][vc_column_text]
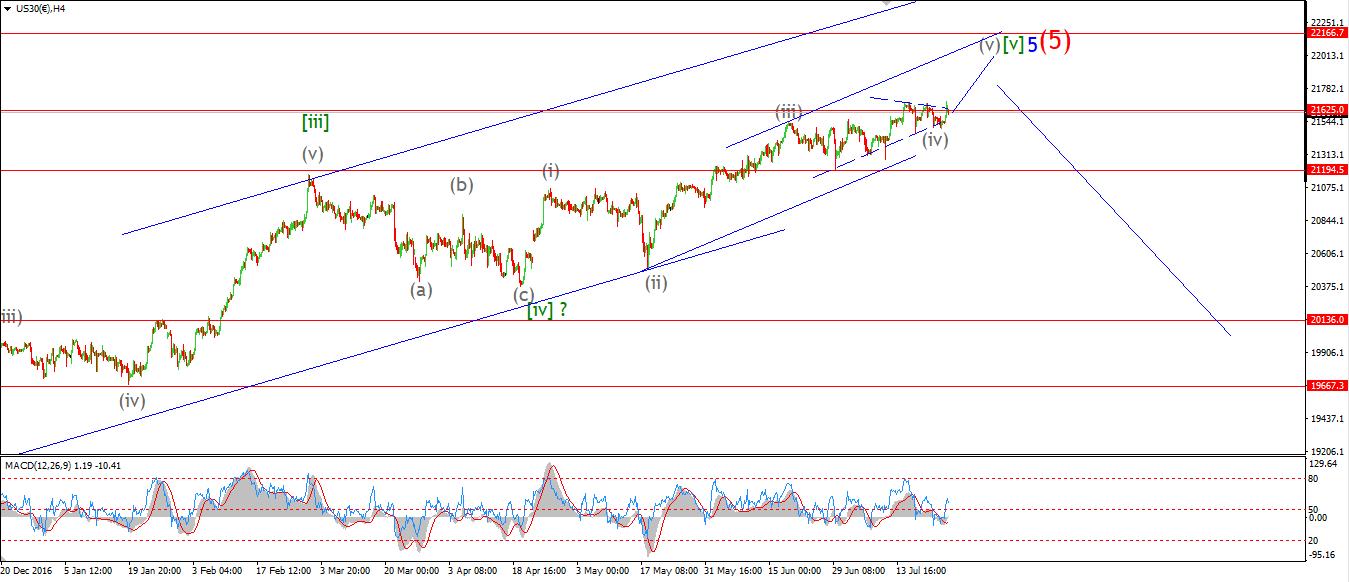 [/vc_column_text][vc_custom_heading text=”Daily” use_theme_fonts=”yes”][vc_column_text]
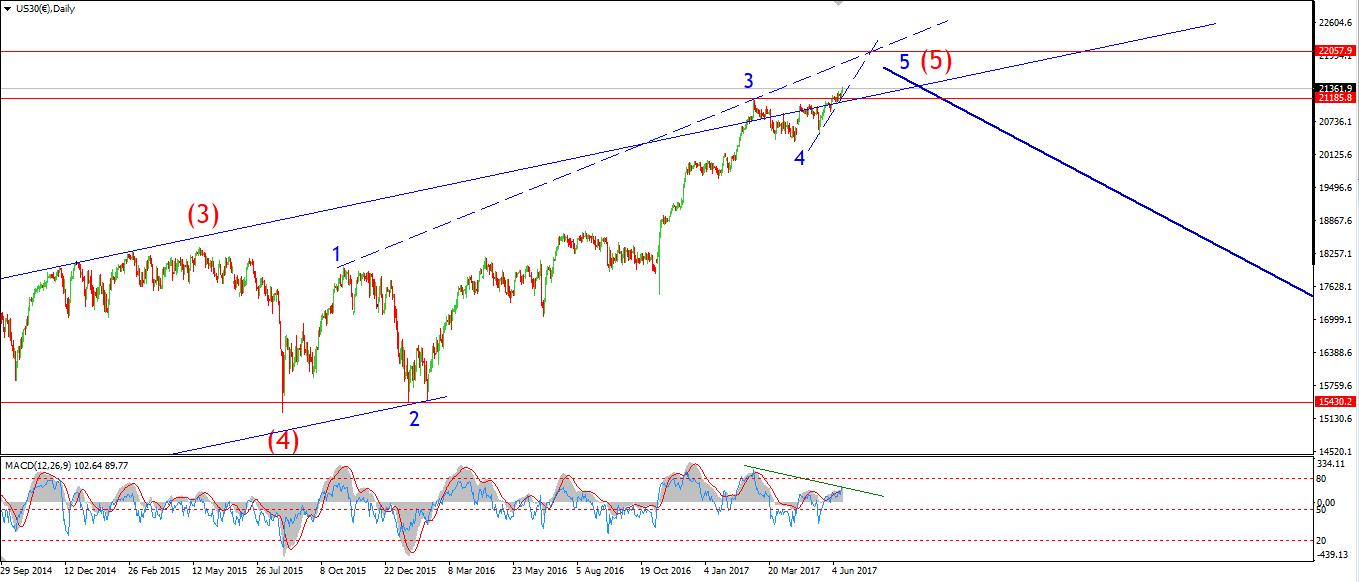 [/vc_column_text][/vc_column][/vc_row][vc_row][vc_column][vc_column_text]My Bias: market topping process ongoing
Wave Structure: Impulsive 5 wave structure, possibly topping in an all time high.
Long term wave count: Topping in wave (5)
Important risk events: USD: Chicago PMI, Pending Home Sales m/m.
This evenings rally in the DOW is looking quite corrective in nature.
Therefore I think wave ‘2’ blue is incomplete at the low of 21738.
It is possible that an expended flat correction is on the cards for wave ‘2’ blue.
If that is the case,
Then we should see another decline into 21730 to complete wave ‘2’ on Monday.
From a wide angle perspective,
The stock market is now rising on fumes,
NYSE margin debt reached new all time highs last month,
meaning investors have maxed out the credit card,
to buy into a rally which is now the second longest bull market rally in history!
last week the s&p 500 reached its second highest price / revenue reading ever,
only beaten by the high of FEB 2000 and the dotcom bubble.
The 30 day CBOE volatility index reached a record low this week.
And bearish traders slipped to 16.7% (Investors Intelligence).
This market is now offensively bullish and operating without any self awareness.
This environment has always ended in a crash,
And this time is not different!
For next week,
I am still fully expecting a final push to top 22000.
But given the late stage of this market cycle, the decline could begin quickly.[/vc_column_text][/vc_column][/vc_row]
[/_s2If]
[_s2If current_user_can(access_s2member_ccap_gold)]
[vc_row][vc_column][vc_separator][/vc_column][/vc_row][vc_row][vc_column][vc_column_text]
GOLD
[/vc_column_text][/vc_column][/vc_row][vc_row][vc_column][vc_separator][/vc_column][/vc_row][vc_row][vc_column width=”2/3″][vc_custom_heading text=”30 min” use_theme_fonts=”yes”][vc_column_text] [/vc_column_text][/vc_column][vc_column width=”1/3″][vc_custom_heading text=”4 Hours” use_theme_fonts=”yes”][vc_column_text]
 [/vc_column_text][vc_custom_heading text=”Daily” use_theme_fonts=”yes”][vc_column_text]
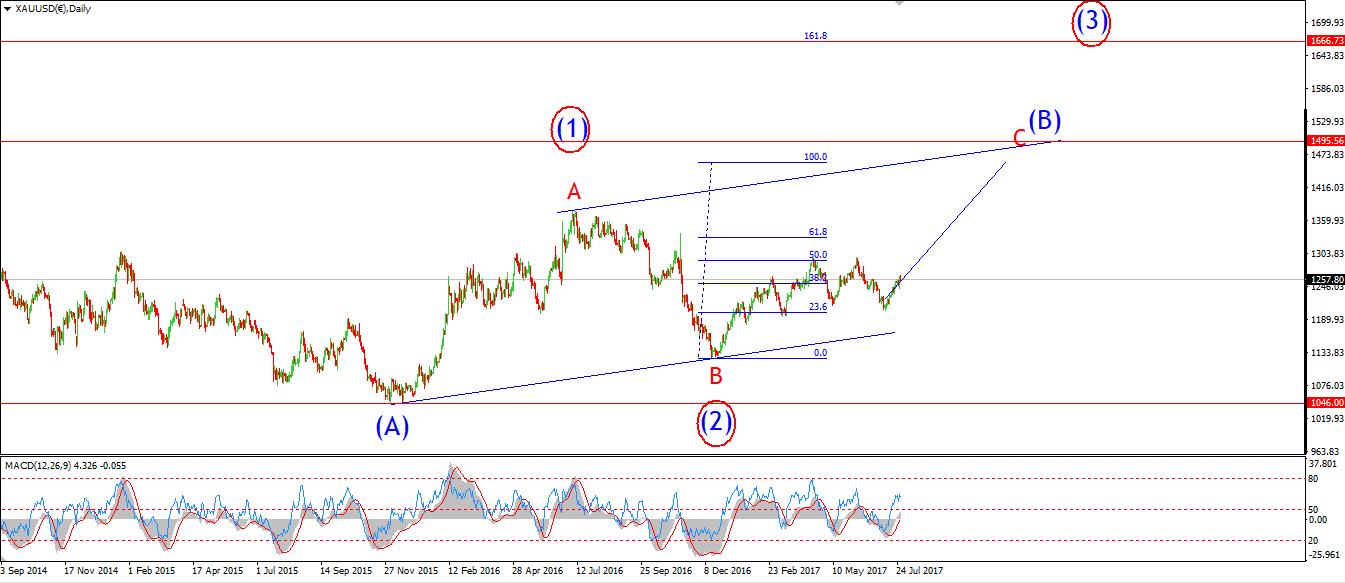 [/vc_column_text][/vc_column][/vc_row][vc_row][vc_column][vc_column_text]My Bias: Long towards 1550
Wave Structure: ZigZag correction to the upside.
Long term wave count: Topping in wave (B) at 1550
Important risk events: USD: Chicago PMI, Pending Home Sales m/m.
GOLD pushed higher this afternoon in a very bullish fashion almost meeting the upper trendline again.
Wave ‘1’ pink is likely now complete after extending higher.
the correction in wave ‘2’ pink should arrive on Monday.
The price contraction which happened yesterday looks to be a very minor triangle within wave ‘1’ pink.
That level is at 1258,
and now forms the initial support for a possible wave ‘2’ pink.
If waves ‘i’ and ‘ii’ brown are complete,
It follows that wave ‘iii’ is now underway.
Wave ‘iii’ brown is projected to reach 1331,
Which is the 162% Fibonacci extension of wave ‘i’ brown.
On Monday I will be watching for a decline in wave ‘2’.
I hope you all have a great weekend.[/vc_column_text][/vc_column][/vc_row]
[/_s2If]