
[vc_row][vc_column][vc_separator border_width=”5″][/vc_column][/vc_row][vc_row][vc_column][vc_column_text]
USDJPY
[/vc_column_text][/vc_column][/vc_row][vc_row][vc_column][vc_separator border_width=”5″][/vc_column][/vc_row][vc_row][vc_column width=”2/3″][vc_custom_heading text=”30 min” use_theme_fonts=”yes”][vc_column_text]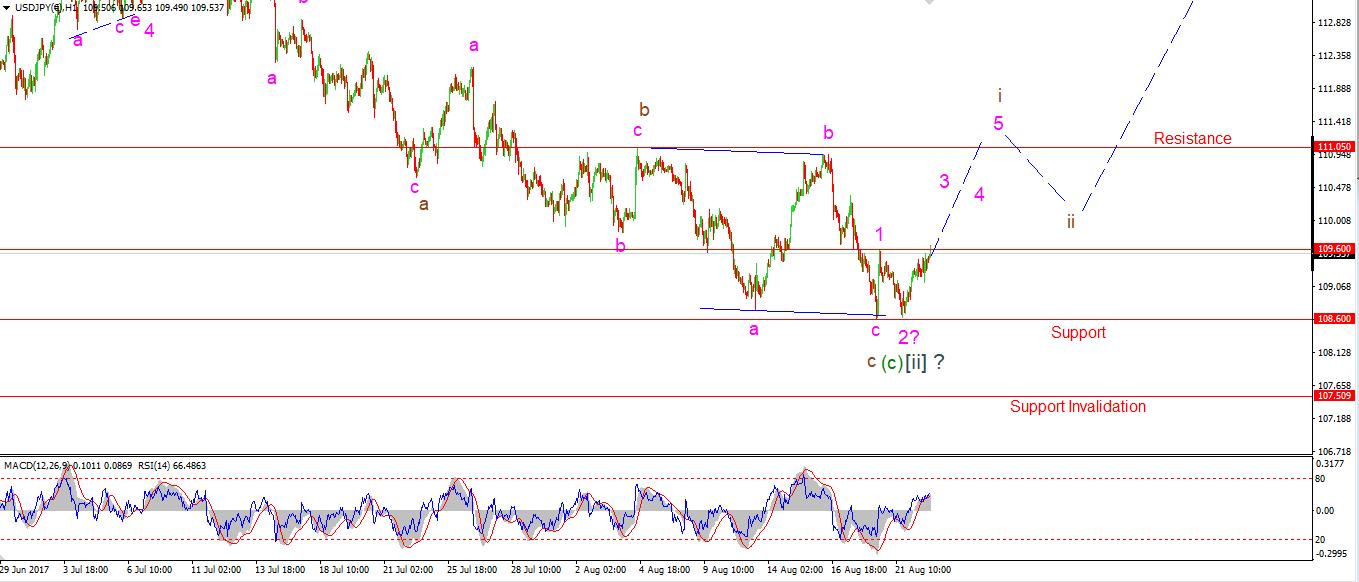 [/vc_column_text][/vc_column][vc_column width=”1/3″][vc_custom_heading text=”4 Hours” use_theme_fonts=”yes”][vc_column_text]
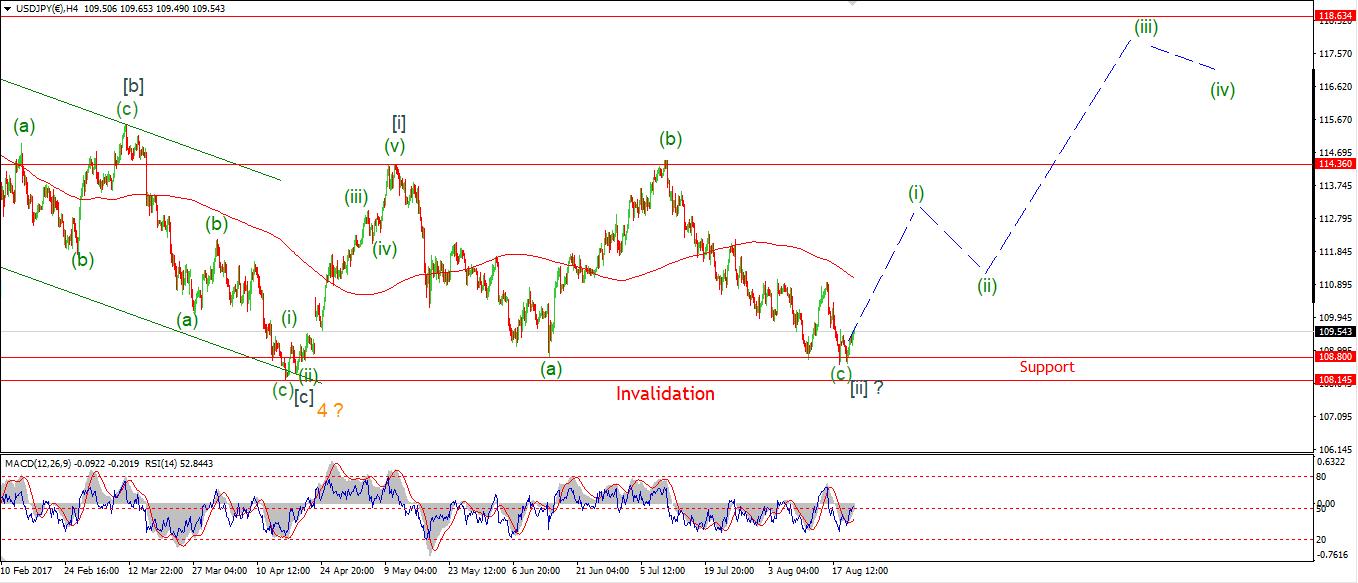 [/vc_column_text][vc_custom_heading text=”Daily” use_theme_fonts=”yes”][vc_column_text]
 [/vc_column_text][/vc_column][/vc_row][vc_row][vc_column][vc_column_text]My Bias: LONG
Wave Structure: rally in wave [C]
Long term wave count: wave [C] is underway, upside to above 136.00
Important risk events: JPY: N/A. USD: New Home Sales, Crude Oil Inventories.
So far the rise off support at 108.60 has been in three waves.
The price structure sits just above major support at 107.50,
if this market is going to turn up,
Which I think it will,
It has simply got to happen this week.
There is a clear bullish momentum divergence on the 4hr chart.
With a double bottom in place in RSI.
The price has spent the last 6 weeks in decline,
even though the larger wave form is still very bullish on the daily chart.
I get the feeling that this market is storing up a very large recoil rally,
Which could take the price above 118.60 in wave [iii] grey,
If this wave count proves correct.
For the next few days it is touch and go for the bullish setup.
But if there is a positive move into 111.05
followed by a corrective decline,
This will be the setup I have been waiting for.
108.60 must hold.[/vc_column_text][/vc_column][/vc_row][vc_row][vc_column][vc_separator][/vc_column][/vc_row][vc_row][vc_column][vc_column_text]
DOW JONES INDUSTRIALS
[/vc_column_text][/vc_column][/vc_row][vc_row][vc_column][vc_separator][/vc_column][/vc_row][vc_row][vc_column width=”2/3″][vc_custom_heading text=”30 min” use_theme_fonts=”yes”][vc_column_text]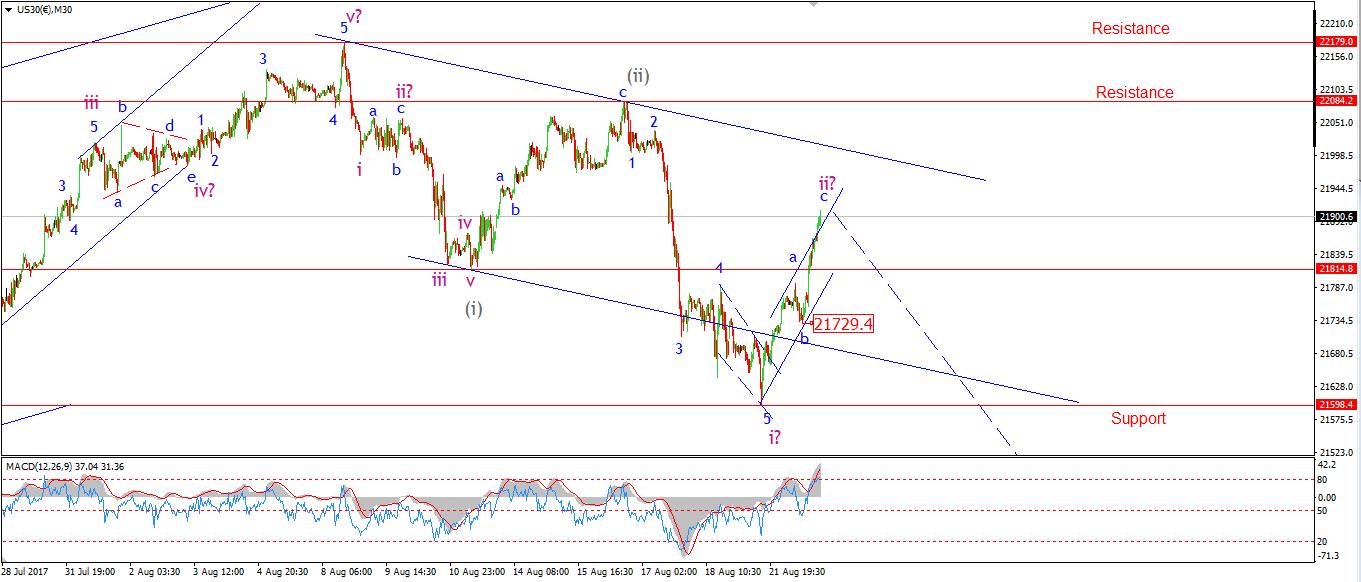 [/vc_column_text][/vc_column][vc_column width=”1/3″][vc_custom_heading text=”4 Hours” use_theme_fonts=”yes”][vc_column_text]
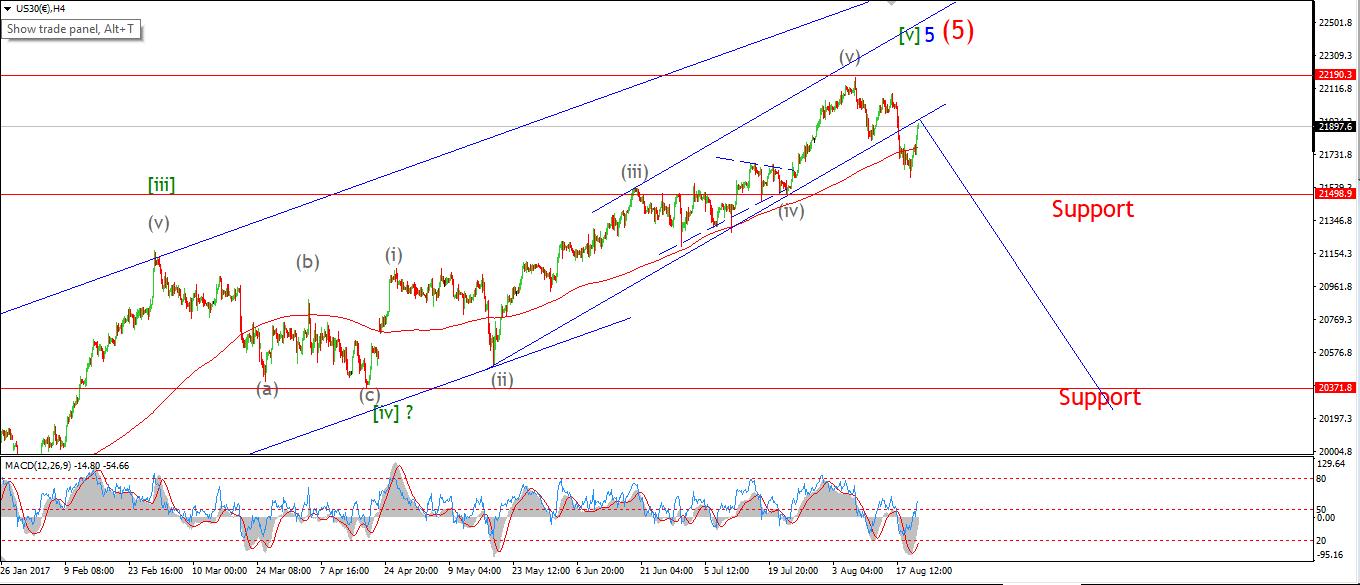 [/vc_column_text][vc_custom_heading text=”Daily” use_theme_fonts=”yes”][vc_column_text]
 [/vc_column_text][/vc_column][/vc_row][vc_row][vc_column][vc_column_text]My Bias: market topping process ongoing
Wave Structure: Impulsive 5 wave structure, possibly topping in an all time high.
Long term wave count: Topping in wave (5)
Important risk events: USD: New Home Sales, Crude Oil Inventories.
The declines off the recent all time highs have so far traced out a three wave form.
Which does point to a corrective decline.
But,
The rally of the recent low is best counted as a three wave move,
Which again points to a corrective rise in wave ‘ii’ pink.
So;
The bearish wave count is still a very real probability from here.
On the 4hr chart,
Last weeks declines punched down through the 200MA,
Which is a general bearish warning sign.
and since then,
The price has rebounded into the large rising trend channel,
which should offer resistance.
The daily RSI has now given a momentum sell signal
after a showing major divergence form the price for most of the year,
with successive lower highs.
At this point,
We have a bearish setup in Elliott waves, Momentum signals, and price action.
So this could get ugly.
For tomorrow;
Watch for signs turn down from todays highs in wave ‘iii’ pink.
A drop below wave ‘b’ will be the initial sign of a turn down.
22084 is the bearish invalidation line.
If you want to stay ahead of the trend,
and see the big market moves before they happen,
CHECK OUT OUR MEMBERSHIP PLANS……
[/vc_column_text][/vc_column][/vc_row]