On September 19th last,
the FED was about to cut rates again as the market was just hanging on below its all time highs.
The whole world was looking for the rally in the stock market to continue,
but the wave count was calling for something completely different to happen!
Here is what I said that night;
I am still sticking with the bearish interpretation,
against an onslaught of opinion on why the market can only going higher.this coke addict can just as easily have a heart attack tomorrow.
And that is why I am sticking to my guns for now.If the sideways action is a correction in wave ‘ii’ as shown,
then tomorrow will begin a sharp decline in wave ‘iii’ of (i)
which should fall below 26700.watch for wave ‘ii’ to complete below the high and wave ‘iii’ to begin tomorrow.
Here is the chart from that night.

Waves i and ii created a slight lower high at 27280.
And then it was time for wave ‘iii’ down to begin.
This chart shows what happened next!
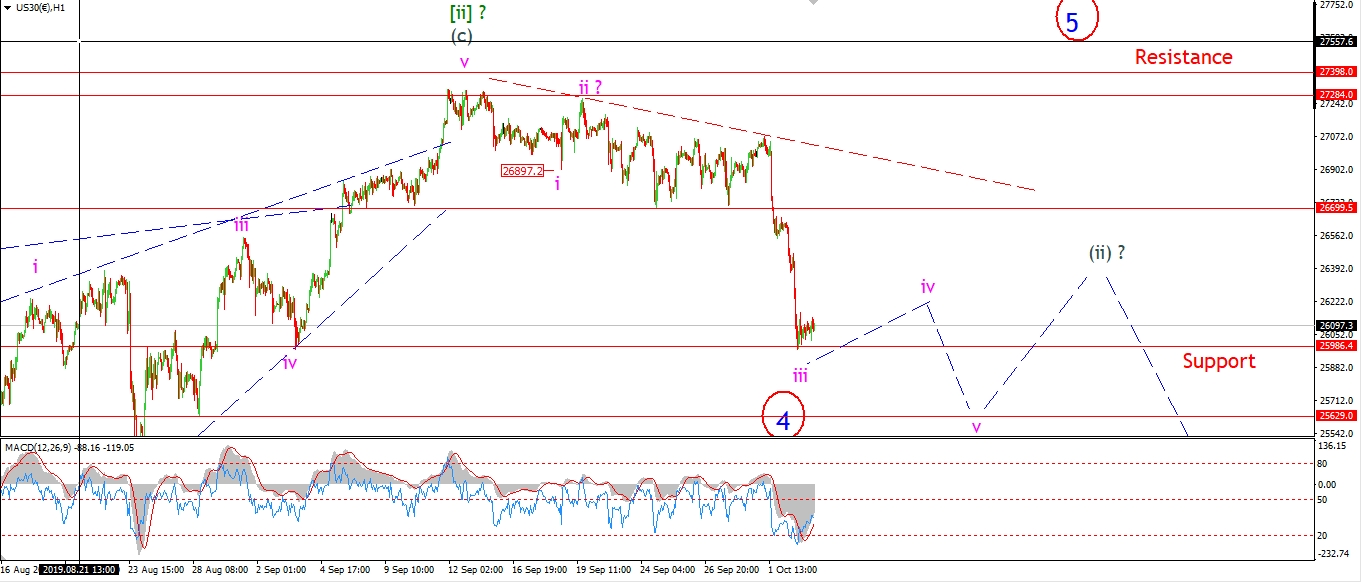
Wave ‘ii’ did indeed create a lower high, and wave ‘iii’ took its sweet time to get going!
But,
the first week in October started with a BANG!
The DOW has fallen 1200 points off that wave ‘ii’ high!
And this pattern is not done yet!
That big call went against the consensus view,
after long rally and a rate cut from the FED.
But the wave count saw the decline coming,
before it appeared on the charts!
What is next for the stock market?
Check out the membership to find out now.
This is a great example of how you can spot major turns on the fly,
using simple Elliott wave patterns.
Check out the membership options today!