On September 3rd last,
the bond market had reached the most overbought position in years according to the COT data.
And of course everyone thought bonds can only go up!
But the wave count saw another path ahead for bond prices.
Here is what I said that night;
An Historic Top for the Bond Market is Here!
When you look at the COT data for the 10YR,
It is plain to see how horribly overbought and precarious the market is right now.
This lopsided setup can only be resolved one way in my opinion.
this market is about to undergo a severe selloff over the coming months, which will serve to re-balance the market at a lower price.Wave (2) has gone on long enough
and is now approaching major resistance at 134.00.
I expect wave C of (2) to complete below that level
and the initial move lower off the high will be a sharp decline in five waves.
That initial decline remains my focus in the short term.Tomorrow;
the short term count may allow for another small new high but not by much.
Watch for wave (i) to begin this week.
Here is the chart from that night.

Waves (2) was coming to a close after a long corrective rally.
The short term count was calling for a top around 133.00 in a final pop to the upside.
But the next major move was to begin soon,
with a five wave pattern lower over the next few weeks, labelled as wave (i) down.
This chart shows what happened next!

The market finally topped at 132.40 in wave (2), and then came the drop!
The next ten days brought a 400 point drop in the 10YR bond price just as expected by the wave count.
And then on the 12th of Sept as wave (i) closed out, we called for a correction higher in wave (ii).
Bonds will Lead the Market into Chaos!
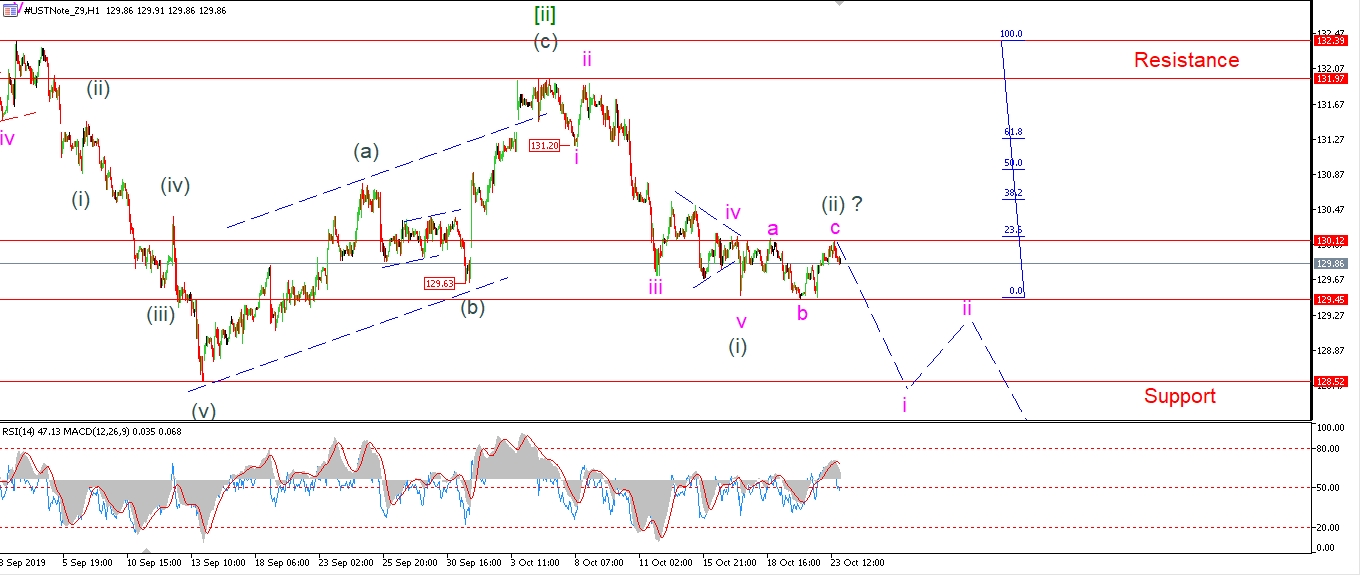
The 10YR has traced out a five wave decline off the recent high at 132.39 this week.
The price has actually accelerated lower this today in wave ‘v’ of (i).
So we are looking good now for a major turn down in the general bond market to get underway.I will be looking for a three wave recovery in wave (ii) next week to complete a bearish signal in bonds.
Here’s what happened next!

Wave (ii) went on to trace out a perfect three wave pattern higher as expected.
A 350 point rally in wave (ii) over the next 2 weeks.
The bond market completed a bearish lower high, and then more downside was called for.
And that came too, with a 250 point decline!
Three in a row for the wave count,
-
But what comes next you ask?
-
And what does it mean for the larger financial market?
Join Bullwaves today and see for yourself!
This is a great example of how you can spot major turns on the fly, using simple Elliott wave patterns.
If you want nightly Elliott wave updates just like this,
Check out the membership options today!