[vc_row][vc_column][vc_separator border_width="5"][/vc_column][/vc_row][vc_row][vc_column][vc_column_text]
Evenin all!
I hope the day treated you well.
[/vc_column_text][/vc_column][/vc_row][vc_row][vc_column][vc_separator border_width="5"][/vc_column][/vc_row][vc_row][vc_column][vc_column_text]
[/vc_column_text][/vc_column][/vc_row][vc_row][vc_column][vc_column_text]
UPCOMING RISK EVENTS:
USD: Building Permits, Capacity Utilization Rate.
EUR: N/A.
GBP: N/A.
JPY: N/A.
[/vc_column_text][/vc_column][/vc_row]
[vc_row][vc_column][vc_separator border_width="5"][/vc_column][/vc_row][vc_row][vc_column][vc_column_text]
DOW JONES INDUSTRIALS
[/vc_column_text][/vc_column][/vc_row][vc_row][vc_column][vc_separator border_width="5"][/vc_column][/vc_row][vc_row][vc_column width="2/3"][vc_custom_heading text="30 min" use_theme_fonts="yes"][vc_column_text]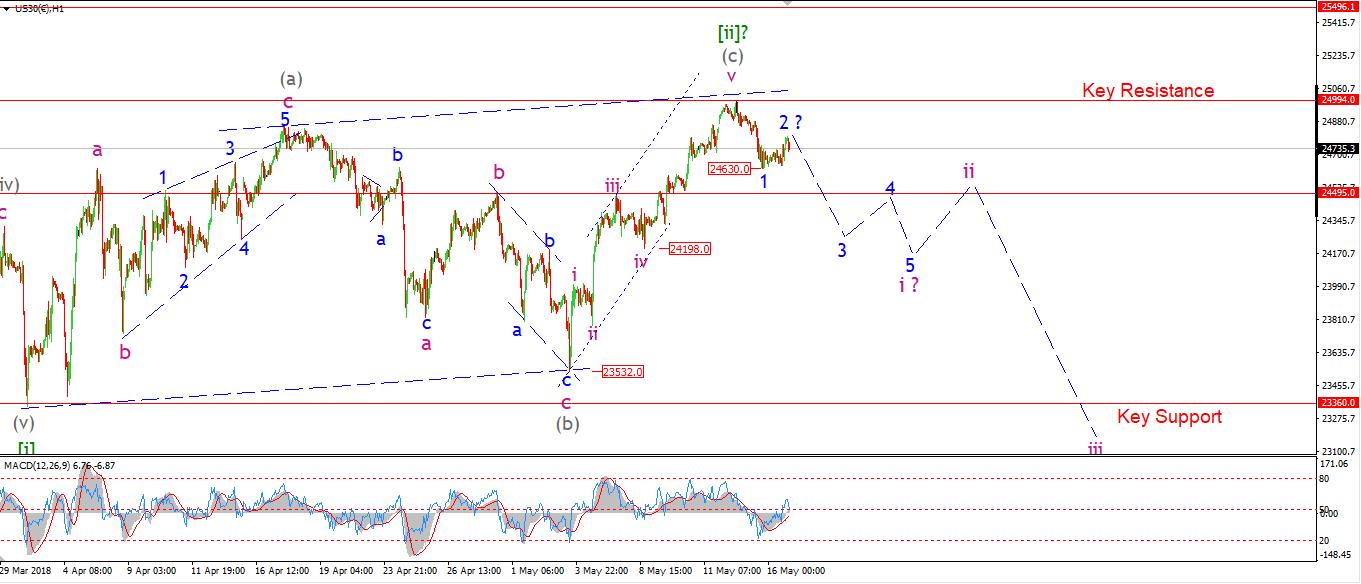 [/vc_column_text][/vc_column][vc_column width="1/3"][vc_custom_heading text="4 Hours" use_theme_fonts="yes"][vc_column_text]
 [/vc_column_text][vc_custom_heading text="Daily" use_theme_fonts="yes"][vc_column_text]
 [/vc_column_text][/vc_column][/vc_row][vc_row][vc_column][vc_column_text]My Bias: market topping process completing
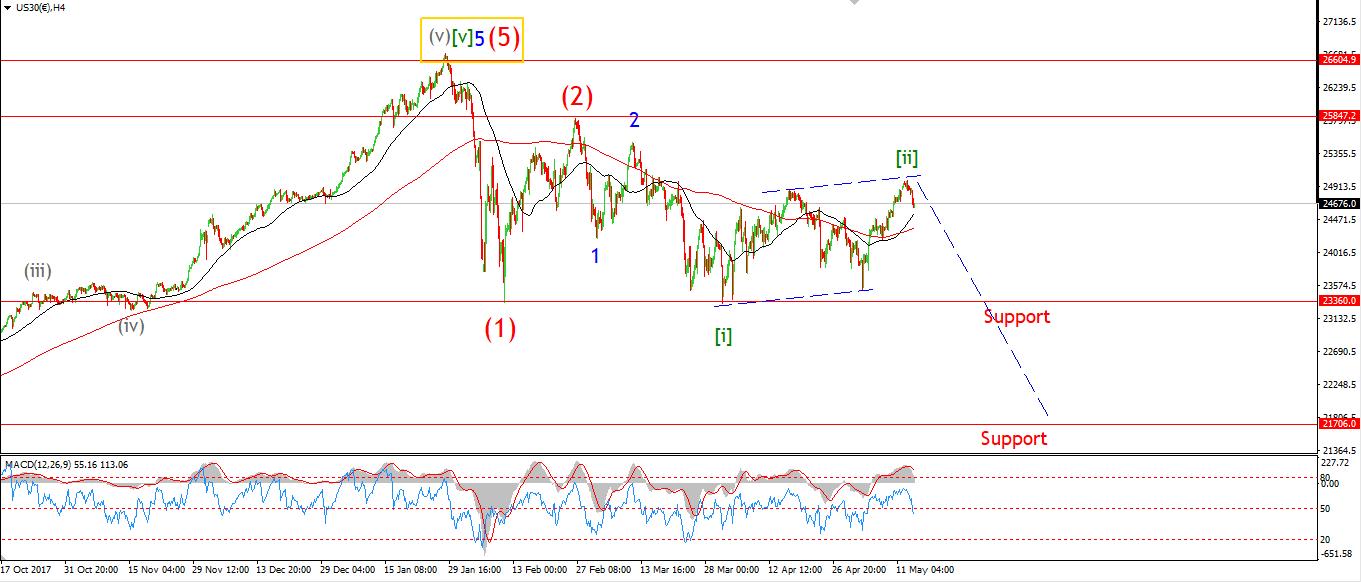
Wave Structure: Impulsive 5 wave structure, topping in an all time high, now beginning new bear market.
Long term wave count: topped in wave (5)
The low of todays session so far hit 24630,
This is labelled as wave '1' of 'i' of a possible return to the larger downtrend in wave [iii] green.
The rise off todays low is in a clear abc correction wave pattern,
This suggests that a corrective rise in wave '2' blue is underway.
A further break of 24630 tomorrow will confirm that wave '3' down has begun.
In the short term,
The signs are lining up so far that another serious acceleration lower is on the cards.
I want to see a clear five wave pattern in wave 'i' pink,
Followed by a three wave corrective rise in wave 'ii'.
which will create the bearish Elliott wave signal I am looking for.
Tomorrow;
Prices must remain below 24994 from here on out, as per the elliott wave rules.
Watch for a break of 24630 and a decline in wave '3' blue.
[/vc_column_text][/vc_column][/vc_row]
[vc_row][vc_column][vc_separator border_width="5"][/vc_column][/vc_row][vc_row][vc_column][vc_column_text]
U.S CRUDE OIL
[/vc_column_text][/vc_column][/vc_row][vc_row][vc_column][vc_separator border_width="5"][/vc_column][/vc_row][vc_row][vc_column width="2/3"][vc_custom_heading text="30 min" use_theme_fonts="yes"][vc_column_text]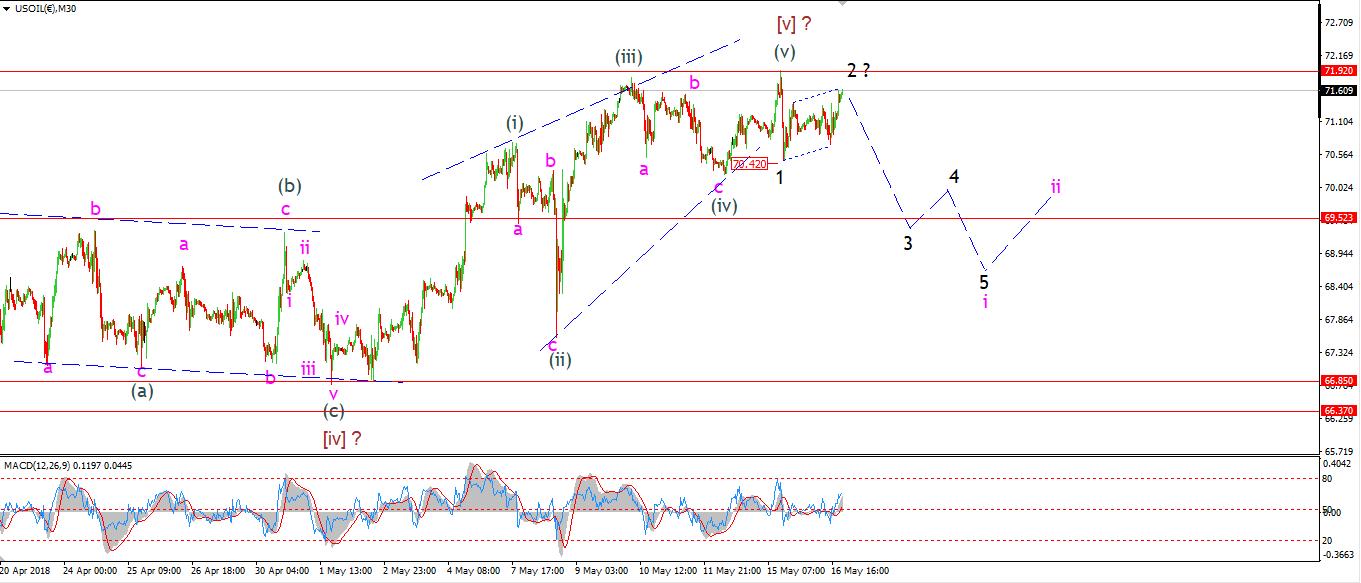 [/vc_column_text][/vc_column][vc_column width="1/3"][vc_custom_heading text="4 Hours" use_theme_fonts="yes"][vc_column_text]
 [/vc_column_text][vc_custom_heading text="Daily" use_theme_fonts="yes"][vc_column_text]
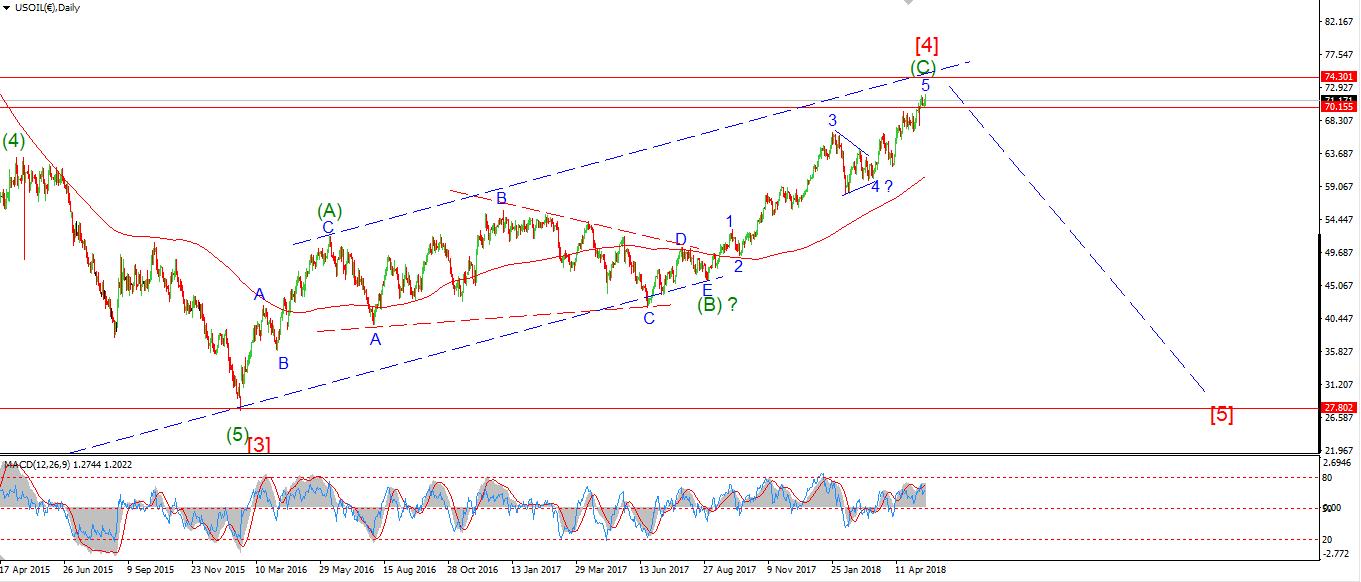 [/vc_column_text][/vc_column][/vc_row][vc_row][vc_column][vc_column_text]My Bias: topping in a large correction wave [4].
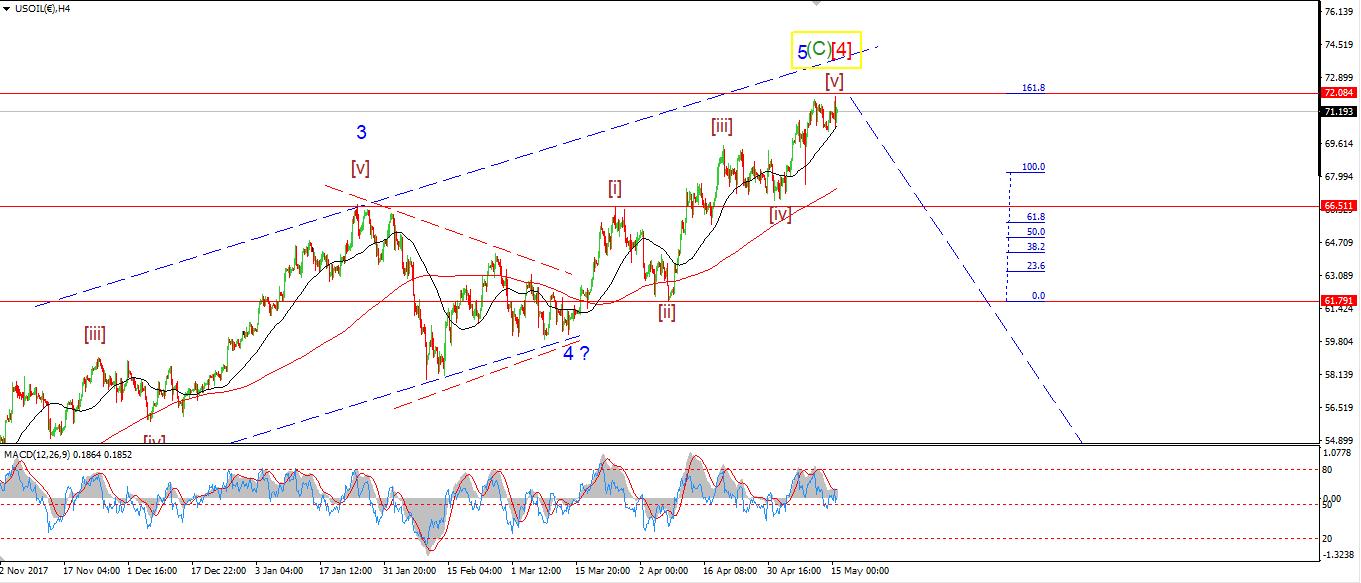
Wave Structure: Double combination higher in wave [4] red now complete.
Long term wave count: wave [5] target $20
The rise off Tuesdays low at 70.42,
has created a clear three wave pattern to the upside.
The price has filled the trend channel and should now turn back down again.
I have labelled the rise as a possible second wave complete at todays highs.
Price must not break above 71.92 from here on,
And wave '3' down should begin off todays highs.
Much like the DOW,
I expect to see complete five wave pattern to the downside,
followed by a three wave corrective rise in wave 'ii'.
That will complete another Elliott wave indicator sell signal off the recent high,
and set up for a very large bear market decline.
The stakes are very high in crude oil right now.
And the long term elliott wave pattern could carry the price below $20 if I am correct.
Back to the short term.
Tomorrow;
71.92 must hold to,
Watch for a break of 70.42 in a possible wave '3' down.
[/vc_column_text][/vc_column][/vc_row]
[vc_row][vc_column][vc_column_text]
There is a big move coming in the markets!
To stay ahead of the next trend,
Check out the membership page.
[/vc_column_text][/vc_column][/vc_row]
[vc_row][vc_column][vc_separator border_width="5"][/vc_column][/vc_row]