
[_s2If current_user_can(access_s2member_ccap_eurusd)]
[vc_row][vc_column][vc_separator border_width=”5″][/vc_column][/vc_row][vc_row][vc_column][vc_column_text]
EURUSD
[/vc_column_text][/vc_column][/vc_row][vc_row][vc_column][vc_separator border_width=”5″][/vc_column][/vc_row][vc_row][vc_column width=”2/3″][vc_custom_heading text=”30 min” use_theme_fonts=”yes”][vc_column_text] [/vc_column_text][/vc_column][vc_column width=”1/3″][vc_custom_heading text=”4 Hours” use_theme_fonts=”yes”][vc_column_text]
 [/vc_column_text][vc_custom_heading text=”Daily” use_theme_fonts=”yes”][vc_column_text]
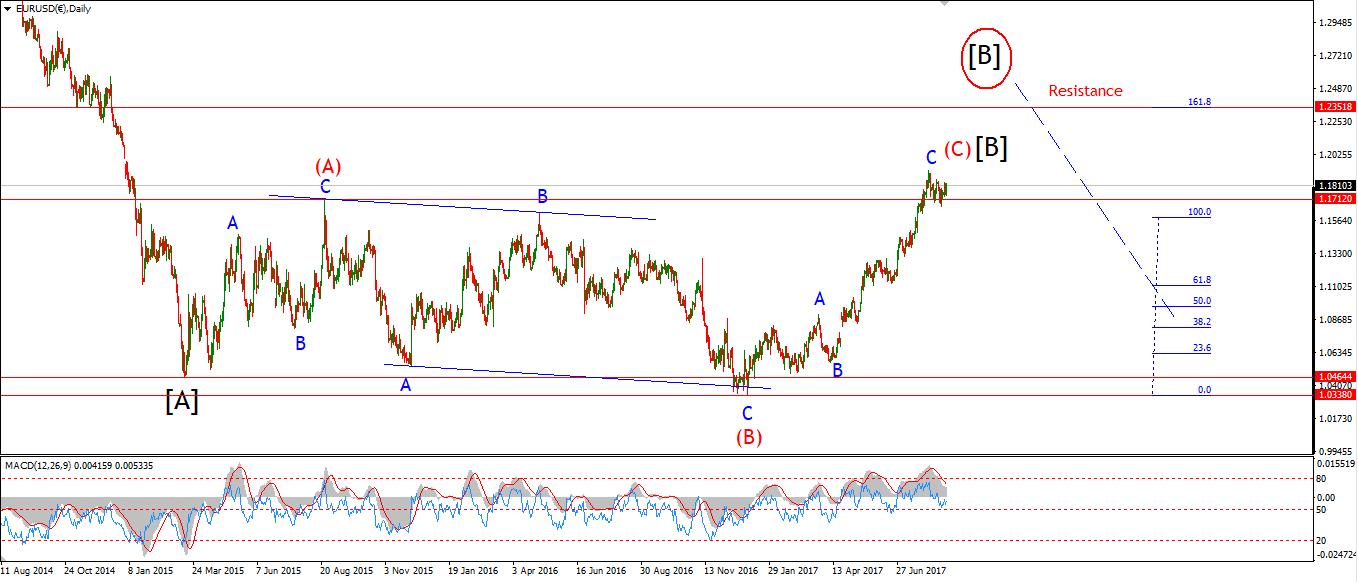 [/vc_column_text][/vc_column][/vc_row][vc_row][vc_column][vc_column_text]My Bias: long term bearish
Wave Structure: downward impulse wave
Long term wave count: lower in wave (3) red
Important risk events: EUR: N/A. USD: Existing Home Sales, Mortgage Delinquencies, Jackson Hole Symposium.
Good evening to one and all.
EURUSD has dragged out its sideways formation for far too long now.
So;
in order for the current bearish short term count to remain valid,
The price must immediately begin a large decline in wave ‘3’ grey.
If the price crosses up above 1.1847,
I will swtch to the alternate wave count on the 4hr chart.
This alternate count circled in red,
shows the recent three wave decline as a fourth wave within the larger correction.
If the alternate wave count is correct,
Then the price will likely rally into 1.2200 to complete wave [B] black.
On the daily chart you can see this relationship clearer.
At 1.2200 wave (C) reaches 161.8% the length of wave (A) red.
For tomorrow;
A decline 1.1660 will confirm the current wave count,
However,
A break of 1.1847, will switch focus to the alternate count,
If the price rises above 1.1910,
This will confirm the alternate wave count.[/vc_column_text][/vc_column][/vc_row]
[/_s2If]
[_s2If current_user_can(access_s2member_ccap_gbpusd)]
[vc_row][vc_column][vc_separator border_width=”5″][/vc_column][/vc_row][vc_row][vc_column][vc_column_text]
GBPUSD
[/vc_column_text][/vc_column][/vc_row][vc_row][vc_column][vc_separator border_width=”5″][/vc_column][/vc_row][vc_row][vc_column width=”2/3″][vc_custom_heading text=”30 min” use_theme_fonts=”yes”][vc_column_text] [/vc_column_text][/vc_column][vc_column width=”1/3″][vc_custom_heading text=”4 Hours” use_theme_fonts=”yes”][vc_column_text]
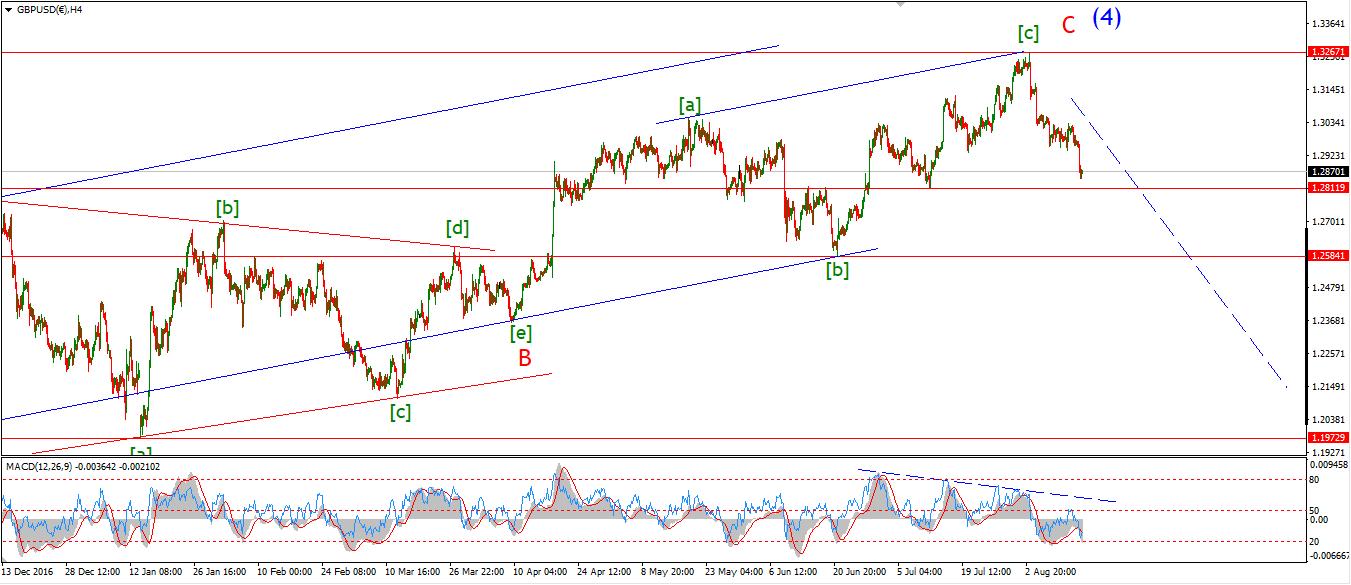 [/vc_column_text][vc_custom_heading text=”Daily” use_theme_fonts=”yes”][vc_column_text]
 [/vc_column_text][/vc_column][/vc_row][vc_row][vc_column][vc_column_text]My Bias: short below parity in wave (5).
Wave Structure: continuing impulsive structure to the downside in wave (5)
Long term wave count: decline in wave (5) blue, below parity
Important risk events: GBP: Second Estimate GDP q/q, Unemployment Claims. USD: Existing Home Sales, Mortgage Delinquencies, Jackson Hole Symposium.
The price broke down through 1.2811 today, which is the previous wave (b) as shown.
The price is now likely declining in wave ‘iii’ pink.
The corrective look to todays action is possibly within wave ‘2’ grey.
So I expect a slight rise into the upper trendline to complete a three wave correction.
Further declines below 1.2811 again will be within wave ‘3’ grey.
For tomorrow;
The price must remain below 1.2916 in wave ‘2’ grey.
wave ‘3’ will carry the price into support at 1.2580.[/vc_column_text][/vc_column][/vc_row]
[/_s2If]
[_s2If current_user_can(access_s2member_ccap_usdjpy)]
[vc_row][vc_column][vc_separator border_width=”5″][/vc_column][/vc_row][vc_row][vc_column][vc_column_text]
USDJPY
[/vc_column_text][/vc_column][/vc_row][vc_row][vc_column][vc_separator border_width=”5″][/vc_column][/vc_row][vc_row][vc_column width=”2/3″][vc_custom_heading text=”30 min” use_theme_fonts=”yes”][vc_column_text] [/vc_column_text][/vc_column][vc_column width=”1/3″][vc_custom_heading text=”4 Hours” use_theme_fonts=”yes”][vc_column_text]
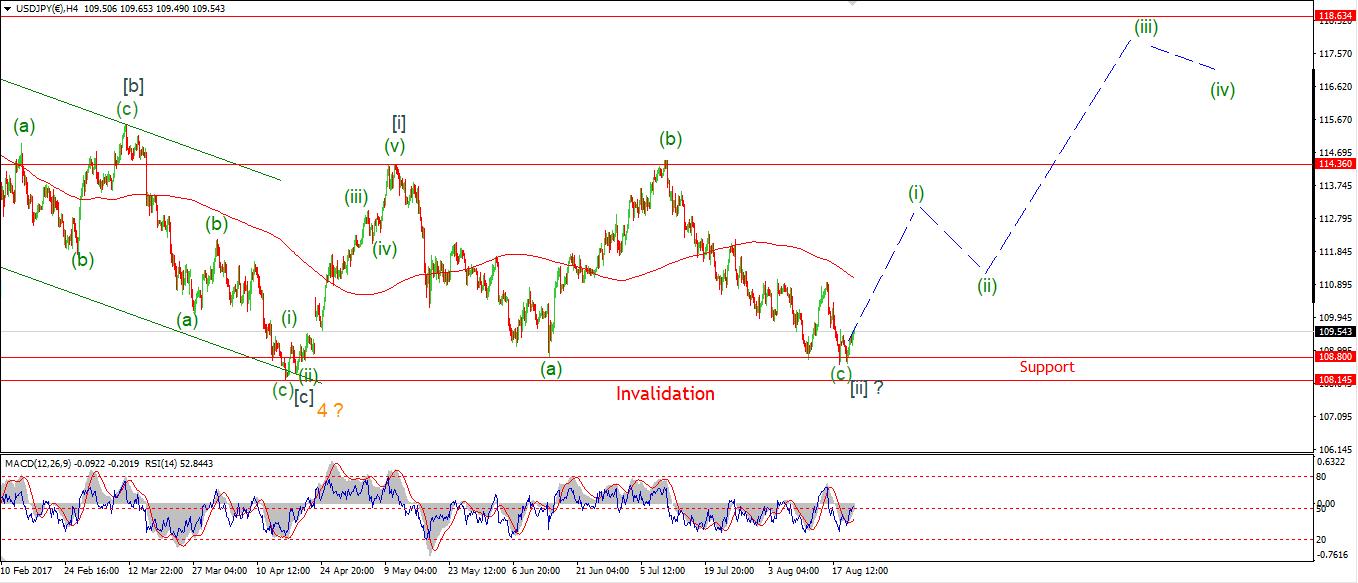 [/vc_column_text][vc_custom_heading text=”Daily” use_theme_fonts=”yes”][vc_column_text]
 [/vc_column_text][/vc_column][/vc_row][vc_row][vc_column][vc_column_text]My Bias: LONG
Wave Structure: rally in wave [C]
Long term wave count: wave [C] is underway, upside to above 136.00
Important risk events: JPY: N/A. USD: Existing Home Sales, Mortgage Delinquencies, Jackson Hole Symposium.
The short term action is still pretty hard to read after todays trade.
I am reluctant to give up on the bullish interpretation just yet,
given the larger bullish signals which are evident.
The short term price action may be tracing out a running flat correction in wave ‘2’
The key support level at 108.60 remains my main point of focus,
This level must hold and a break of 109.82 must happen soon to save the bullish interpretation.
For tomorrow;
I am looking for a larger degree bullish signal to form in waves ‘i’ an ‘ii’ brown in order to go all in on the bullish wave count.
For that to happen,
108.60 must hold first.[/vc_column_text][/vc_column][/vc_row]
[/_s2If]
[_s2If current_user_can(access_s2member_ccap_dow_jones)]
[vc_row][vc_column][vc_separator][/vc_column][/vc_row][vc_row][vc_column][vc_column_text]
DOW JONES INDUSTRIALS
[/vc_column_text][/vc_column][/vc_row][vc_row][vc_column][vc_separator][/vc_column][/vc_row][vc_row][vc_column width=”2/3″][vc_custom_heading text=”30 min” use_theme_fonts=”yes”][vc_column_text] [/vc_column_text][/vc_column][vc_column width=”1/3″][vc_custom_heading text=”4 Hours” use_theme_fonts=”yes”][vc_column_text]
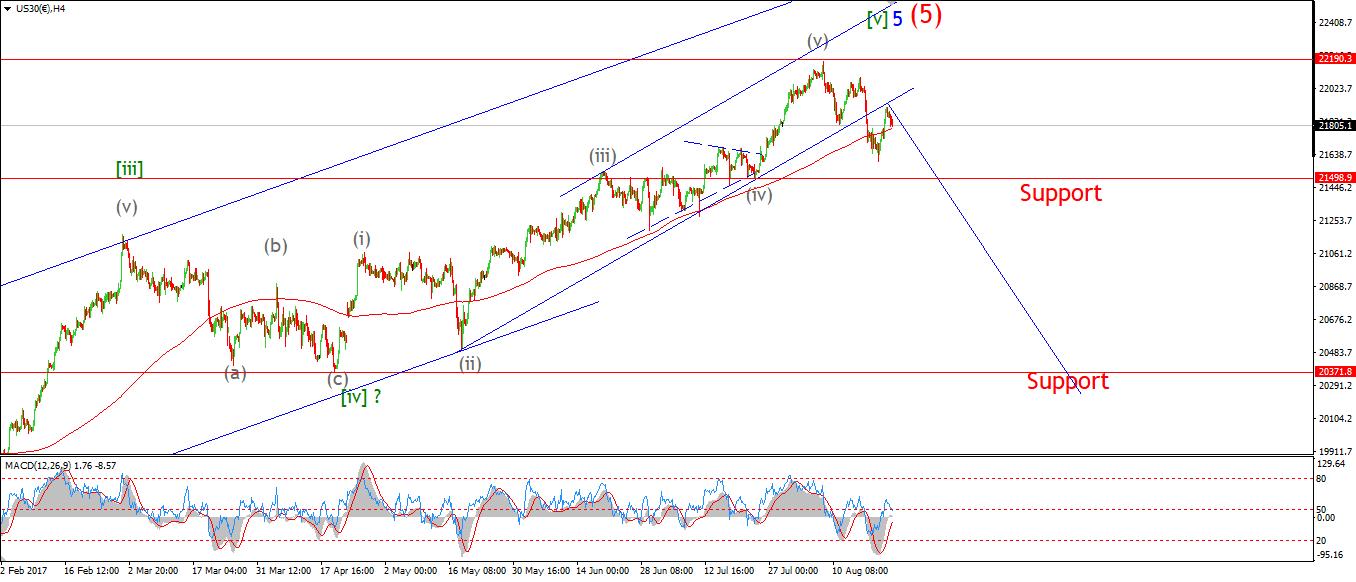 [/vc_column_text][vc_custom_heading text=”Daily” use_theme_fonts=”yes”][vc_column_text]
 [/vc_column_text][/vc_column][/vc_row][vc_row][vc_column][vc_column_text]My Bias: market topping process ongoing
Wave Structure: Impulsive 5 wave structure, possibly topping in an all time high.
Long term wave count: Topping in wave (5)
Important risk events: USD: Existing Home Sales, Mortgage Delinquencies, Jackson Hole Symposium.
Stocks declined off the upper trendline today in what may be the beginning of wave ‘iii’ pink.
The declines were relatively small,
And so far they have traced out three waves,
The price structure must extend downwards in a five wave form from here.
So;
I want to see a firm break of support at 21814 and 21793,
the high labelled wave ‘a’ blue.
This would rule out a five wave structure forming off the recent low, labelled wave ‘i’.
On the 4hr chart,
I can see a double bottom in the RSI,
In order for a real downtrend to begin, the RSI centreline should hold momentum in negative territory while the downtrend builds.
for tomorrow;
The price needs to extend lower to kick off wave ‘iii’ pink.
21793 is the first indicator that wave ‘iii’ has begun.[/vc_column_text][/vc_column][/vc_row]
[/_s2If]
[_s2If current_user_can(access_s2member_ccap_gold)]
[vc_row][vc_column][vc_separator][/vc_column][/vc_row][vc_row][vc_column][vc_column_text]
GOLD
[/vc_column_text][/vc_column][/vc_row][vc_row][vc_column][vc_separator][/vc_column][/vc_row][vc_row][vc_column width=”2/3″][vc_custom_heading text=”30 min” use_theme_fonts=”yes”][vc_column_text] [/vc_column_text][/vc_column][vc_column width=”1/3″][vc_custom_heading text=”4 Hours” use_theme_fonts=”yes”][vc_column_text]
 [/vc_column_text][vc_custom_heading text=”Daily” use_theme_fonts=”yes”][vc_column_text]
 [/vc_column_text][/vc_column][/vc_row][vc_row][vc_column][vc_column_text]My Bias: Long towards 1550
Wave Structure: ZigZag correction to the upside.
Long term wave count: Topping in wave (B) at 1550
Important risk events: USD: Existing Home Sales, Mortgage Delinquencies, Jackson Hole Symposium.
The contracting range in price over the last few days lends itself to a contracting triangle in wave ‘4’ pink
I have now switched to this interpretaion,
rather than the previous wave count shown last night.
If this is correct,
then wave ‘5’ pink will take the price higher to the target at 1332 to complete wave ‘iii’ brown.
The alternate wave count views the triangle as wave ‘2’ pink.
Although triangles rarely occur in a second wave, it is not impossible.
For tomorrow;
The pric must accelerate out of this triangle to get wave ‘5’ or wave ‘3’ under way.
Tomorrows action will decide which wave count is the most fitting.[/vc_column_text][/vc_column][/vc_row]
[/_s2If]