
[_s2If current_user_can(access_s2member_ccap_eurusd)]
[vc_row][vc_column][vc_separator border_width=”5″][/vc_column][/vc_row][vc_row][vc_column][vc_column_text]
EURUSD
[/vc_column_text][/vc_column][/vc_row][vc_row][vc_column][vc_separator border_width=”5″][/vc_column][/vc_row][vc_row][vc_column width=”2/3″][vc_custom_heading text=”30 min” use_theme_fonts=”yes”][vc_column_text] [/vc_column_text][/vc_column][vc_column width=”1/3″][vc_custom_heading text=”4 Hours” use_theme_fonts=”yes”][vc_column_text]
 [/vc_column_text][vc_custom_heading text=”Daily” use_theme_fonts=”yes”][vc_column_text]
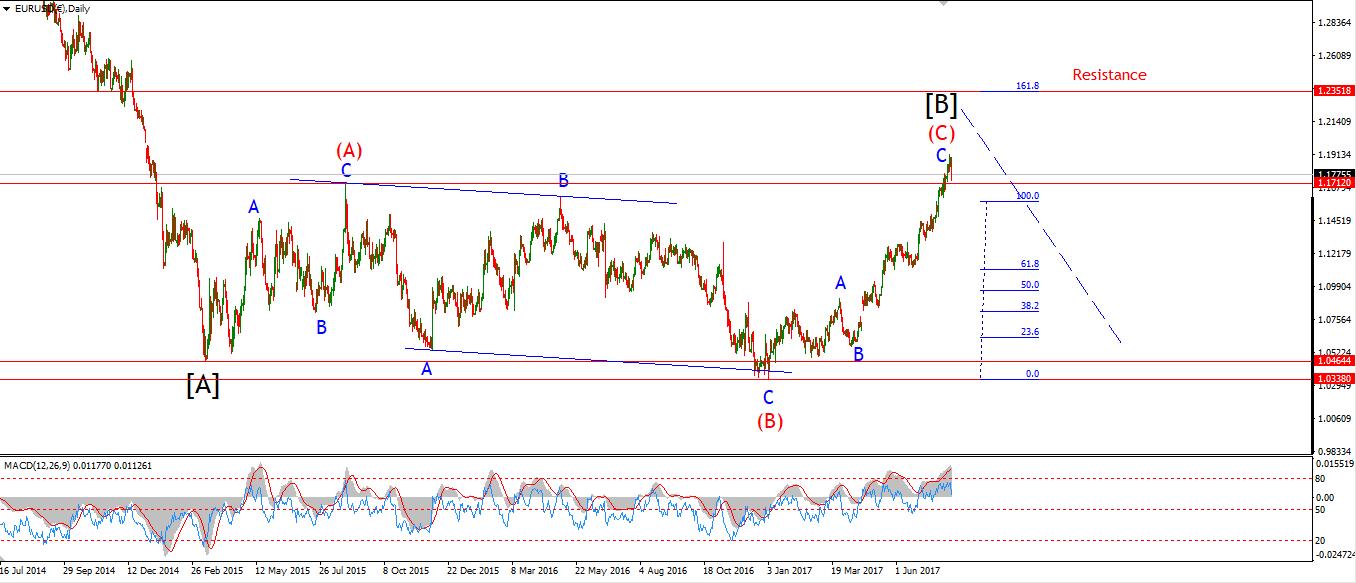 [/vc_column_text][/vc_column][/vc_row][vc_row][vc_column][vc_column_text]My Bias: long term bearish
Wave Structure: downward impulse wave
Long term wave count: lower in wave (3) red
Important risk events: EUR: Flash GDP q/q. USD: Building Permits, Housing Starts, Crude Oil Inventories, FOMC Meeting Minutes.
Hello everyone.
EURUSD took another dive today, down about 100 points at the lows.
The price met support at the previous wave ‘i’ pink,
And has rallied off that point.
This suggests that a set of 1,2 waves is in development.
And wave ‘iii’ pink should extend,
possibly further than the initial target at 1.1487.
I have labelled wave ‘1’ grey at 1.1687,
Wave ‘2’ is underway and should complete in three waves below 1.1847.
The price should complete a lower high and then decline into wave ‘3’ grey.
the paralell trend channel must be broken to the downside soon in order to shake the corrective look to the structure and expand the price movement lower in a typical impulse movement.
For tomorrow,
Watch for the completion of wave ‘2’ grey in a three wave form,
and a decline in wave ‘3’ grey below support.[/vc_column_text][/vc_column][/vc_row]
[/_s2If]
[_s2If current_user_can(access_s2member_ccap_gbpusd)]
[vc_row][vc_column][vc_separator border_width=”5″][/vc_column][/vc_row][vc_row][vc_column][vc_column_text]
GBPUSD
[/vc_column_text][/vc_column][/vc_row][vc_row][vc_column][vc_separator border_width=”5″][/vc_column][/vc_row][vc_row][vc_column width=”2/3″][vc_custom_heading text=”30 min” use_theme_fonts=”yes”][vc_column_text] [/vc_column_text][/vc_column][vc_column width=”1/3″][vc_custom_heading text=”4 Hours” use_theme_fonts=”yes”][vc_column_text]
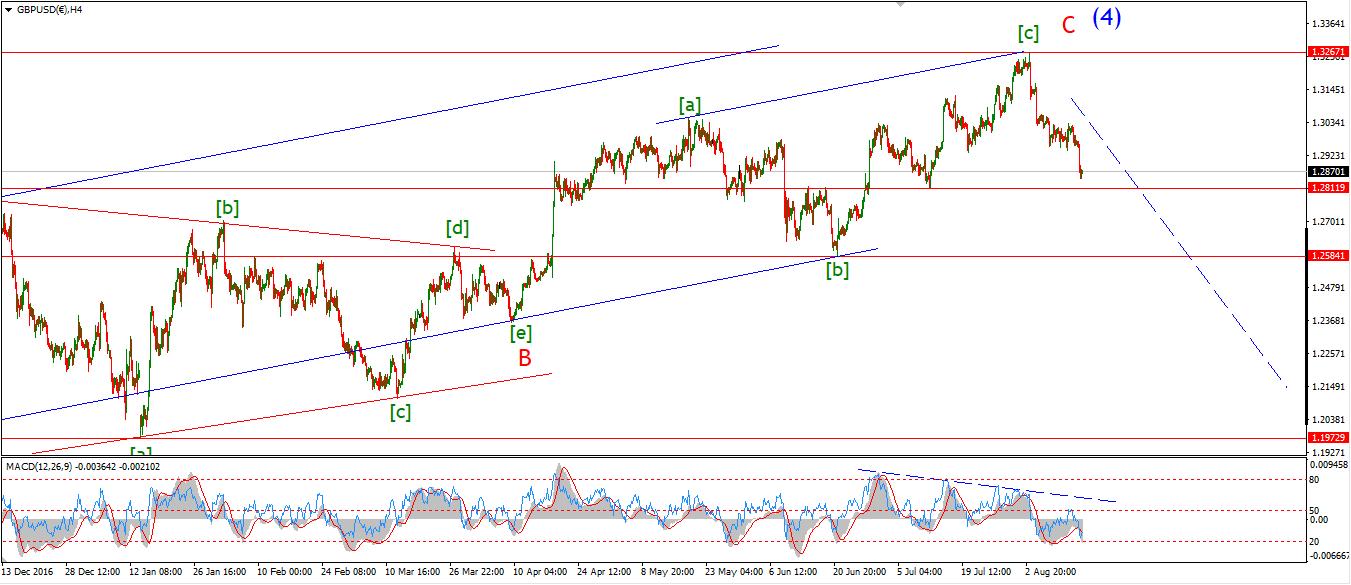 [/vc_column_text][vc_custom_heading text=”Daily” use_theme_fonts=”yes”][vc_column_text]
 [/vc_column_text][/vc_column][/vc_row][vc_row][vc_column][vc_column_text]My Bias: short below parity in wave (5).
Wave Structure: continuing impulsive structure to the downside in wave (5)
Long term wave count: decline in wave (5) blue, below parity
Important risk events: GBP: Average Earnings Index 3m/y, Unemployment Rate. USD: Building Permits, Housing Starts, Crude Oil Inventories, FOMC Meeting Minutes.
The decline in cable today is more fitting of a third wave.
So I have labelled the movements as such.
The trend channel and the fibonacci extension
both suggest a drop below 1.2790 to complete wave ‘3’ grey.
The previous wave (b) lies at 1.2811,
So a break below that point will add further confidence to the idea of a trend change.
On the 4hr chart,
The momentum indicators have now reached an extreme oversold level.
It will be a test of the return to a downtrend, to see if the price continues its decline despite these readings.
For tomorrow;
Watch for a break of 1.2811,
wave ‘3’ will be complete with a touch of the lower trendline.[/vc_column_text][/vc_column][/vc_row]
[/_s2If]
[_s2If current_user_can(access_s2member_ccap_usdjpy)]
[vc_row][vc_column][vc_separator border_width=”5″][/vc_column][/vc_row][vc_row][vc_column][vc_column_text]
USDJPY
[/vc_column_text][/vc_column][/vc_row][vc_row][vc_column][vc_separator border_width=”5″][/vc_column][/vc_row][vc_row][vc_column width=”2/3″][vc_custom_heading text=”30 min” use_theme_fonts=”yes”][vc_column_text] [/vc_column_text][/vc_column][vc_column width=”1/3″][vc_custom_heading text=”4 Hours” use_theme_fonts=”yes”][vc_column_text]
 [/vc_column_text][vc_custom_heading text=”Daily” use_theme_fonts=”yes”][vc_column_text]
 [/vc_column_text][/vc_column][/vc_row][vc_row][vc_column][vc_column_text]My Bias: LONG
Wave Structure: rally in wave [C]
Long term wave count: wave [C] is underway, upside to above 136.00
Important risk events: JPY: N/A. USD: Building Permits, Housing Starts, Crude Oil Inventories, FOMC Meeting Minutes.
USDJPY approached resistance at 111.05 in a very encouraging fashion today.
Although it did not break resistance,
the internal structure of the rally counts very well as a five wave pattern.
I have labelled the rally as a completed impulse wave ‘i’ brown.
The decline off the high is likely be the beginning of wave ‘ii’ brown.
If the price hits the lower trendline in three waves that will be sufficient to complete a corrective wave ‘ii’.
The 50% retracement level lies at 109.78.
That level should offer significant support.
For tomorrow;
Watch for the completion of a correction in three waves off the high,
A further rally above 110.84 will signal that wave ‘iii’ is underway.[/vc_column_text][/vc_column][/vc_row]
[/_s2If]
[_s2If current_user_can(access_s2member_ccap_dow_jones)]
[vc_row][vc_column][vc_separator][/vc_column][/vc_row][vc_row][vc_column][vc_column_text]
DOW JONES INDUSTRIALS
[/vc_column_text][/vc_column][/vc_row][vc_row][vc_column][vc_separator][/vc_column][/vc_row][vc_row][vc_column width=”2/3″][vc_custom_heading text=”30 min” use_theme_fonts=”yes”][vc_column_text]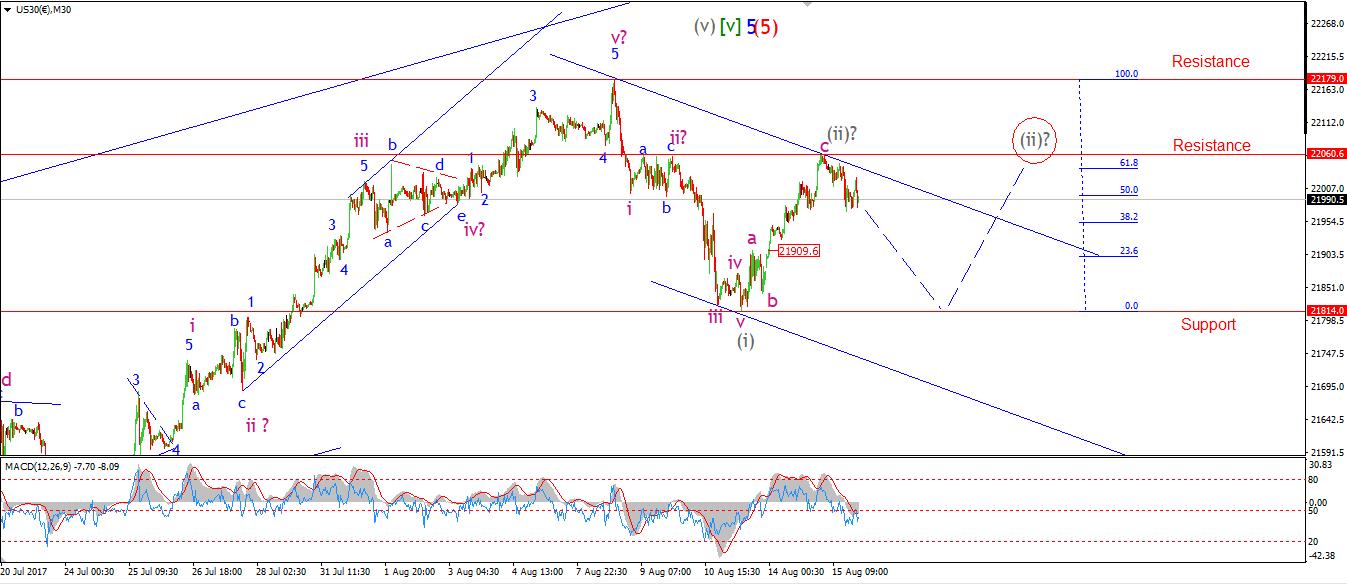 [/vc_column_text][/vc_column][vc_column width=”1/3″][vc_custom_heading text=”4 Hours” use_theme_fonts=”yes”][vc_column_text]
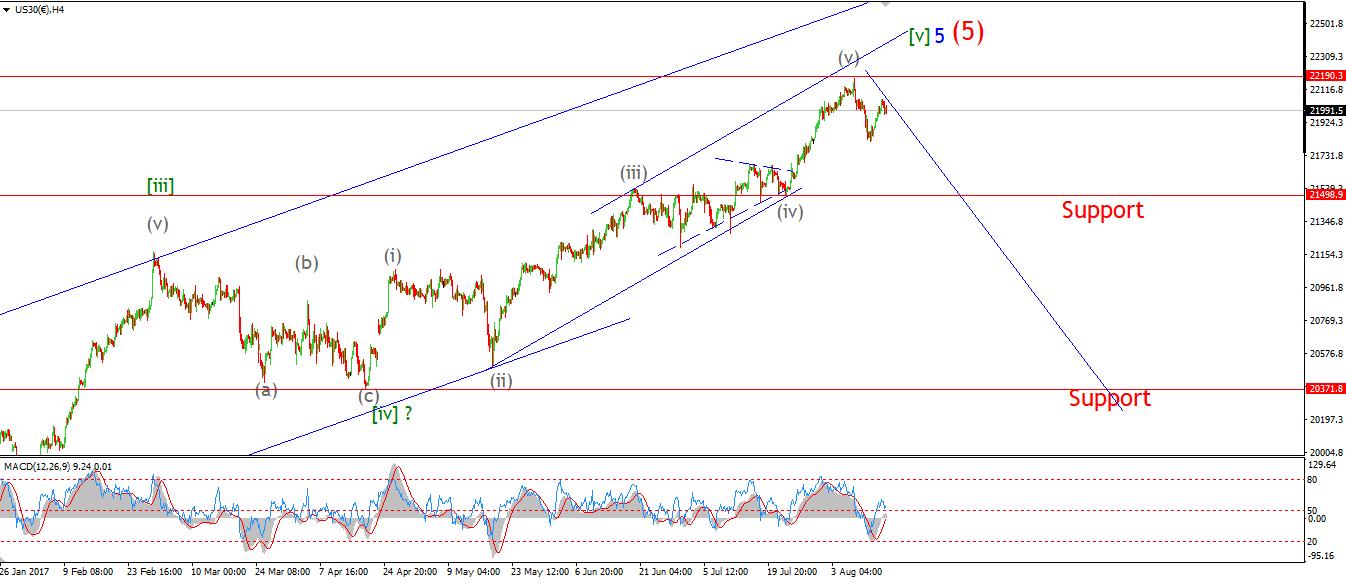 [/vc_column_text][vc_custom_heading text=”Daily” use_theme_fonts=”yes”][vc_column_text]
 [/vc_column_text][/vc_column][/vc_row][vc_row][vc_column][vc_column_text]My Bias: market topping process ongoing
Wave Structure: Impulsive 5 wave structure, possibly topping in an all time high.
Long term wave count: Topping in wave (5)
Important risk events: USD: Building Permits, Housing Starts, Crude Oil Inventories, FOMC Meeting Minutes.
The rise in wave (ii) grey has stretched the limits of the corrective rally interpretation.
With that in mind I have shown an alternate idea for wave (ii) grey.
This involves a flat correction three wave structure,
The price would decline again into support and then rally to meet resistance.
Lets see how this works out.
On the 4hr chart you can see that 21498 is the initial support,
This is the low of the previous wave (iv) grey.
A break of that level will be a far bigger confirmation of a turn into the bear market.
For tomorrow;
Watch for todays high to hold, labelled wave (ii) grey at 22060 on my chart – (22023 cash).
If the price again declines in a five wave structure,
That will signal wave (iii) has begun.[/vc_column_text][/vc_column][/vc_row]
[/_s2If]
[_s2If current_user_can(access_s2member_ccap_gold)]
[vc_row][vc_column][vc_separator][/vc_column][/vc_row][vc_row][vc_column][vc_column_text]
GOLD
[/vc_column_text][/vc_column][/vc_row][vc_row][vc_column][vc_separator][/vc_column][/vc_row][vc_row][vc_column width=”2/3″][vc_custom_heading text=”30 min” use_theme_fonts=”yes”][vc_column_text]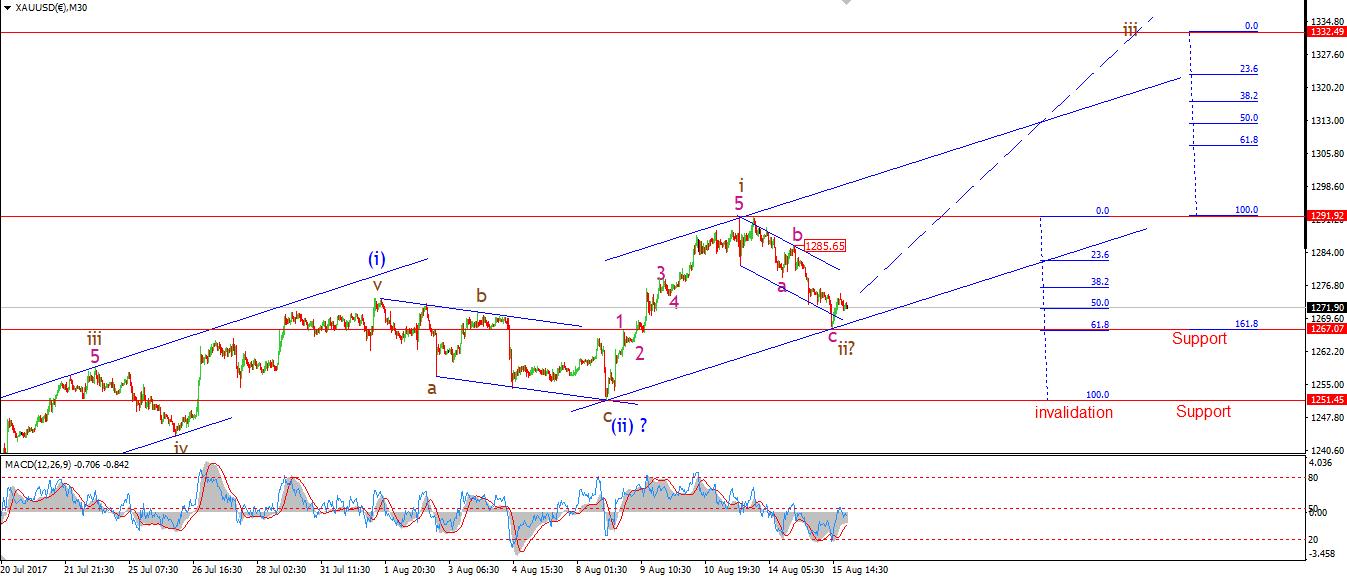 [/vc_column_text][/vc_column][vc_column width=”1/3″][vc_custom_heading text=”4 Hours” use_theme_fonts=”yes”][vc_column_text]
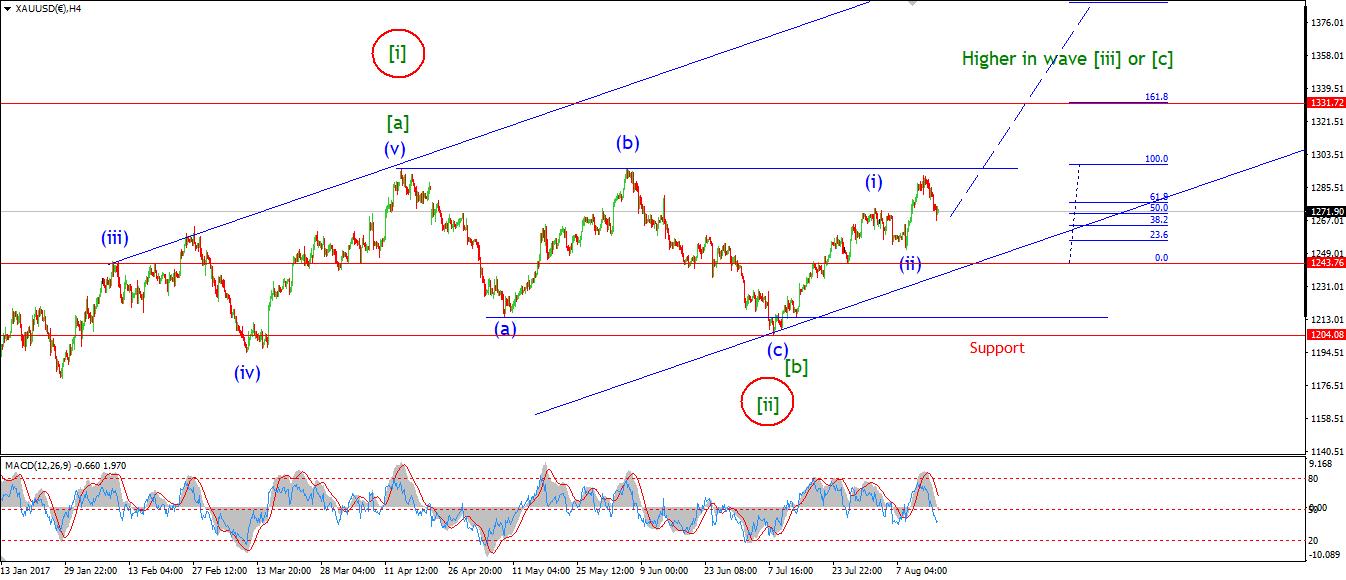 [/vc_column_text][vc_custom_heading text=”Daily” use_theme_fonts=”yes”][vc_column_text]
 [/vc_column_text][/vc_column][/vc_row][vc_row][vc_column][vc_column_text]My Bias: Long towards 1550
Wave Structure: ZigZag correction to the upside.
Long term wave count: Topping in wave (B) at 1550
Important risk events: USD: Building Permits, Housing Starts, Crude Oil Inventories, FOMC Meeting Minutes.
GOLD declined into the 61.8% Fibonacci retracement level today.
Wave ‘ii’ brown did infact extend lower as suggested.
So far the bounce off todays lows looks to have halted the decline.
If we get a break of the high of wave ‘b’ at 1285 it will signal wave ‘iii’ brown has begun.
Wave ‘iii’ is projected to reach 1332 at the 161.8% Fibonacci extension.
For tomorrow;
Watch for 1267 to hold, and a rise into 1285 to signal a turn up again.[/vc_column_text][/vc_column][/vc_row]
[/_s2If]