
[_s2If current_user_can(access_s2member_ccap_eurusd)]
[vc_row][vc_column][vc_separator border_width=”5″][/vc_column][/vc_row][vc_row][vc_column][vc_column_text]
EURUSD
[/vc_column_text][/vc_column][/vc_row][vc_row][vc_column][vc_separator border_width=”5″][/vc_column][/vc_row][vc_row][vc_column width=”2/3″][vc_custom_heading text=”30 min” use_theme_fonts=”yes”][vc_column_text]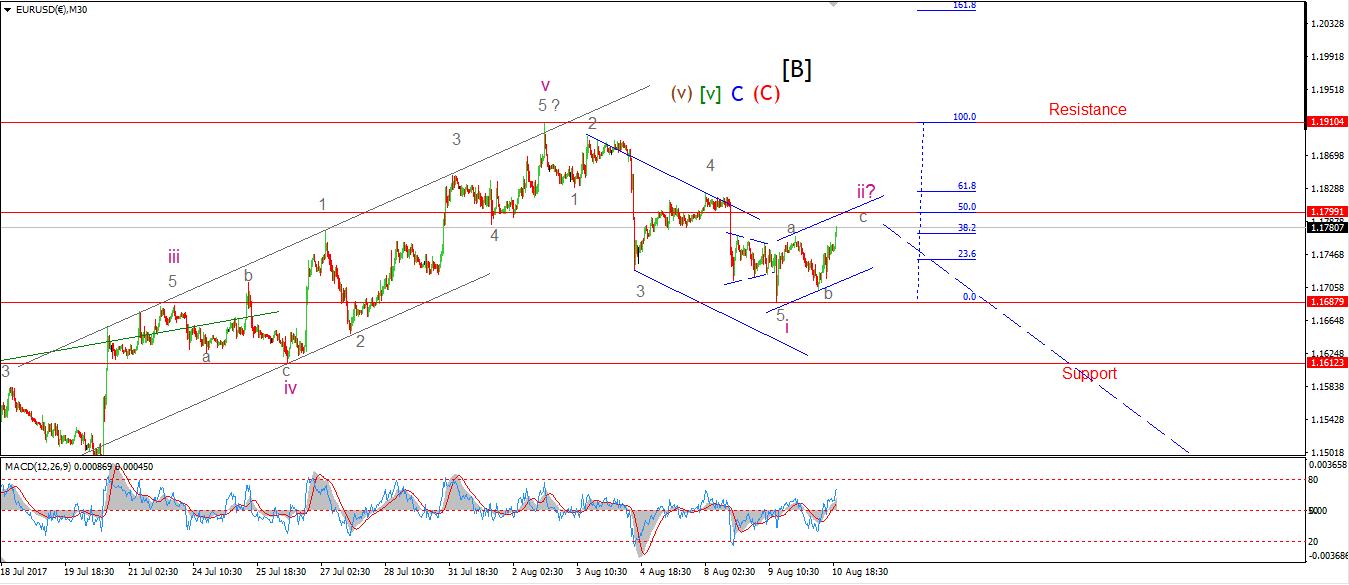 [/vc_column_text][/vc_column][vc_column width=”1/3″][vc_custom_heading text=”4 Hours” use_theme_fonts=”yes”][vc_column_text]
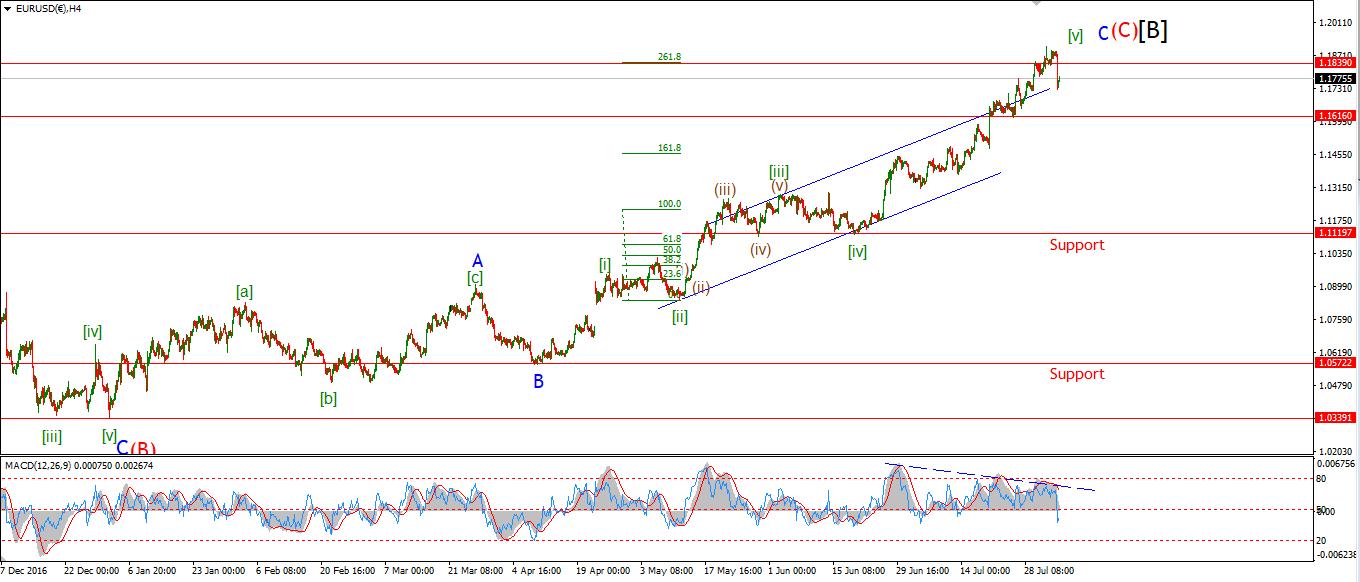 [/vc_column_text][vc_custom_heading text=”Daily” use_theme_fonts=”yes”][vc_column_text]
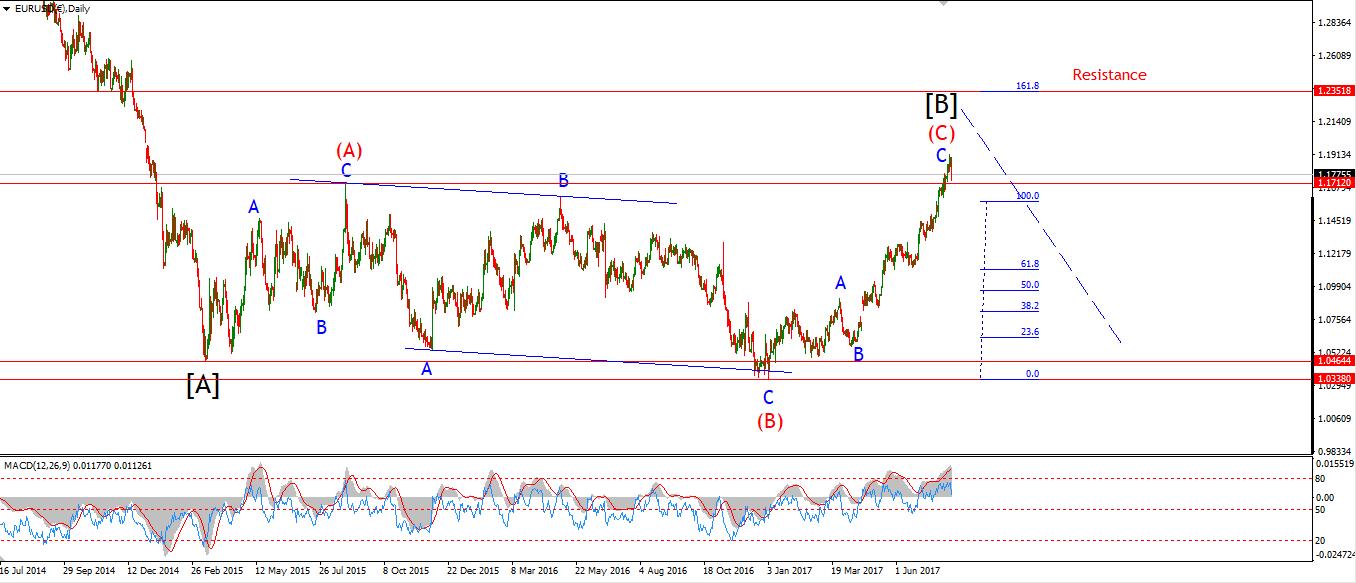 [/vc_column_text][/vc_column][/vc_row][vc_row][vc_column][vc_column_text]My Bias: long term bearish
Wave Structure: downward impulse wave
Long term wave count: lower in wave (3) red
Important risk events: EUR: N/A. USD: CPI m/m, FOMC Member Kaplan Speaks, FOMC Member Kashkari Speaks.
Good evening everyone,
Today is one of those days where the larger theme of a turn into chaos, is beginning to materialize in market prices.
Lets start with EURUSD as usual.
Five waves have completed to the downside off the recent high.
This is labelled wave ‘i’ pink.
Wave ‘ii’ was expected today and so far the correction has completed wave ‘a’ and ‘b’ with wave ‘c’ underway as we speak.
Wave ‘c’ will meet the upper trend line at about 1.1800,
The 50% retracement level lies at 1.1799.
For tomorrow;
Watch for a reaction off the upper trendline in an impulsive form.
If the price declines below 1.1687,
That will signal that wave ‘iii’ has begun.[/vc_column_text][/vc_column][/vc_row]
[/_s2If]
[_s2If current_user_can(access_s2member_ccap_gbpusd)]
[vc_row][vc_column][vc_separator border_width=”5″][/vc_column][/vc_row][vc_row][vc_column][vc_column_text]
GBPUSD
[/vc_column_text][/vc_column][/vc_row][vc_row][vc_column][vc_separator border_width=”5″][/vc_column][/vc_row][vc_row][vc_column width=”2/3″][vc_custom_heading text=”30 min” use_theme_fonts=”yes”][vc_column_text] [/vc_column_text][/vc_column][vc_column width=”1/3″][vc_custom_heading text=”4 Hours” use_theme_fonts=”yes”][vc_column_text]
 [/vc_column_text][vc_custom_heading text=”Daily” use_theme_fonts=”yes”][vc_column_text]
 [/vc_column_text][/vc_column][/vc_row][vc_row][vc_column][vc_column_text]My Bias: short below parity in wave (5).
Wave Structure: continuing impulsive structure to the downside in wave (5)
Long term wave count: decline in wave (5) blue, below parity
Important risk events: GBP: N/A. USD: CPI m/m, FOMC Member Kaplan Speaks, FOMC Member Kashkari Speaks.
Cable found support at yesterdays lows of 1.2950.
This flat action is most likely part of wave ‘ii’ pink.
Wave ‘ii’ looks to be tracing out a flat correction
with three waves in ‘a’, three in wave ‘b’
and a possible five wave rally underway in ‘c’.
The previous wave ‘4’ at one lesser degree lies at 1.3053.
So this is the initial resistance level for the correction in wave ‘ii’ pink.
For tomorrow;
Watch for a rise into that resistance zone between 1.3053 and 1.3110.[/vc_column_text][/vc_column]
[/_s2If]
[_s2If current_user_can(access_s2member_ccap_usdjpy)]
[vc_row][vc_column][vc_separator border_width=”5″][/vc_column][/vc_row][vc_row][vc_column][vc_column_text]
USDJPY
[/vc_column_text][/vc_column][/vc_row][vc_row][vc_column][vc_separator border_width=”5″][/vc_column][/vc_row][vc_row][vc_column width=”2/3″][vc_custom_heading text=”30 min” use_theme_fonts=”yes”][vc_column_text] [/vc_column_text][/vc_column][vc_column width=”1/3″][vc_custom_heading text=”4 Hours” use_theme_fonts=”yes”][vc_column_text]
 [/vc_column_text][vc_custom_heading text=”Daily” use_theme_fonts=”yes”][vc_column_text]
 [/vc_column_text][/vc_column][/vc_row][vc_row][vc_column][vc_column_text]My Bias: LONG
Wave Structure: rally in wave [C]
Long term wave count: wave [C] is underway, upside to above 136.00
Important risk events: JPY: N/A. USD: CPI m/m, FOMC Member Kaplan Speaks, FOMC Member Kashkari Speaks.
USDJPY continues to disappoint to the downside!
the alternate wave count is becoming a better interpretation of the current action given the persistent declines.
It the price hits 1.0879, the alternate wave count will take force,
Although the price is getting dangerously close to invalidating the bullish perspective altogether.
This evenings lows have brought the price down to touch the lower trendline once more.
And it is fairly evident that momentum to the downside is stretched,
So from a purely technical perspective, the price is on the verge of a turn up.
For tomorrow,
Watch for support at 108.80 to hold,
The USD should begin to show strength soon as it has in the other pairs.[/vc_column_text][/vc_column][/vc_row]
[/_s2If]
[_s2If current_user_can(access_s2member_ccap_dow_jones)]
[vc_row][vc_column][vc_separator][/vc_column][/vc_row][vc_row][vc_column][vc_column_text]
DOW JONES INDUSTRIALS
[/vc_column_text][/vc_column][/vc_row][vc_row][vc_column][vc_separator][/vc_column][/vc_row][vc_row][vc_column width=”2/3″][vc_custom_heading text=”30 min” use_theme_fonts=”yes”][vc_column_text] [/vc_column_text][/vc_column][vc_column width=”1/3″][vc_custom_heading text=”4 Hours” use_theme_fonts=”yes”][vc_column_text]
 [/vc_column_text][vc_custom_heading text=”Daily” use_theme_fonts=”yes”][vc_column_text]
 [/vc_column_text][/vc_column][/vc_row][vc_row][vc_column][vc_column_text]My Bias: market topping process ongoing
Wave Structure: Impulsive 5 wave structure, possibly topping in an all time high.
Long term wave count: Topping in wave (5)
Important risk events: USD: CPI m/m, FOMC Member Kaplan Speaks, FOMC Member Kashkari Speaks.
The DOW dropped again in an impulsive fashion today.
It is possible that wave ‘ii’ is complete and the price is now declining in wave ‘iii’ pink.
So far the decline has complete a three wave structure off the high,
This must develop into a five wave form in order to complete a bearish elliott wave signal.
It is possible that we are seeing a series of 1,2 waves to the downside,
which I have shown on the chart.
If so, the current rise should trace out a wave form and complete below the high of wave ‘ii’ pink
For tomorrow;
Watch for a three wave rally to complete below 22057,
Wave ‘iii’ is projected to 21752, where it will reach 161.8% of wave ‘i’.[/vc_column_text][/vc_column][/vc_row]
[/_s2If]
[_s2If current_user_can(access_s2member_ccap_gold)]
[vc_row][vc_column][vc_separator][/vc_column][/vc_row][vc_row][vc_column][vc_column_text]
GOLD
[/vc_column_text][/vc_column][/vc_row][vc_row][vc_column][vc_separator][/vc_column][/vc_row][vc_row][vc_column width=”2/3″][vc_custom_heading text=”30 min” use_theme_fonts=”yes”][vc_column_text] [/vc_column_text][/vc_column][vc_column width=”1/3″][vc_custom_heading text=”4 Hours” use_theme_fonts=”yes”][vc_column_text]
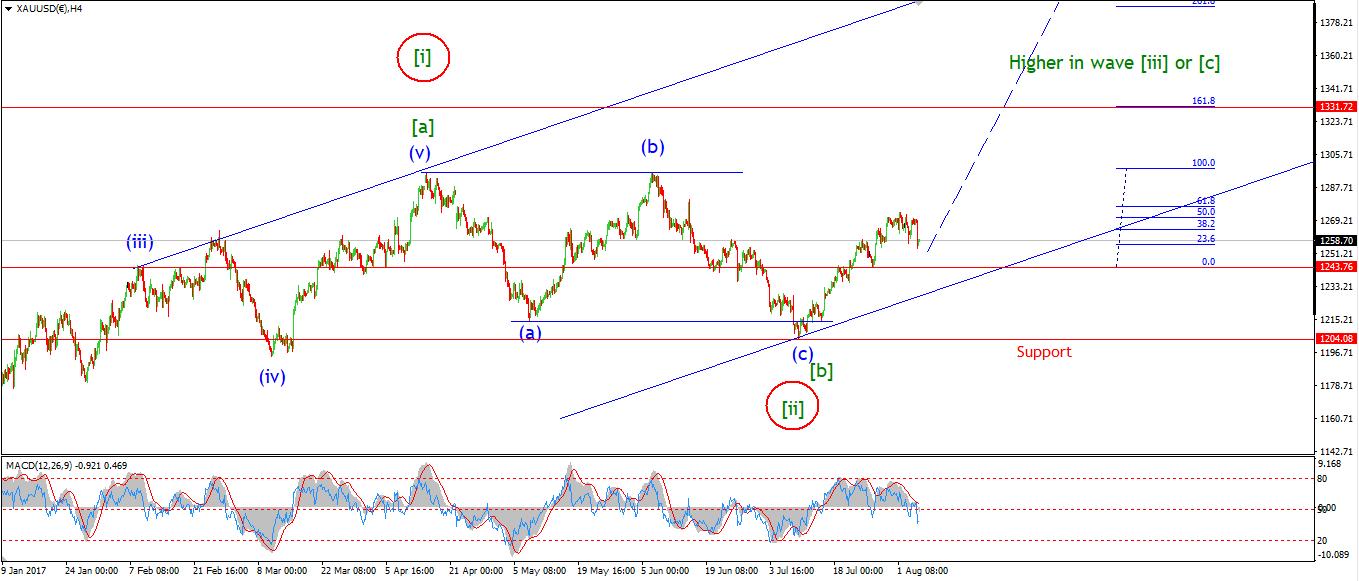 [/vc_column_text][vc_custom_heading text=”Daily” use_theme_fonts=”yes”][vc_column_text]
 [/vc_column_text][/vc_column][/vc_row][vc_row][vc_column][vc_column_text]My Bias: Long towards 1550
Wave Structure: ZigZag correction to the upside.
Long term wave count: Topping in wave (B) at 1550
Important risk events: USD: CPI m/m, FOMC Member Kaplan Speaks, FOMC Member Kashkari Speaks.
GOLD continued its rally in wave ‘i’ brown today.
I was looking for another push into 1280, and today high reached 1287.94.
I have shown a completed five wave structure off the low at wave (ii) blue.
Wave ‘ii’ brown is expected to begin presently.
This should occur in three waves and the initial support lies at 1271,
this is the level of the previous wave ‘b’, which also marks a clear shelf of support in the price structure.
Once wave ‘ii’ brown completes, we will have another elliott wave signal in place off the low.
For tomorrow;
watch for signs of an initial decline in wave ‘a’ of ‘ii’.[/vc_column_text][/vc_column][/vc_row]
[/_s2If]