
[vc_row][vc_column][vc_separator border_width=”5″][/vc_column][/vc_row]
Join Bullwaves.org,
and you will see future Trends
before they even begin.
[vc_row][vc_column][vc_separator border_width=”5″][/vc_column][/vc_row]
Here are a few examples of major trend changes that we caught recently.
[vc_row][vc_column][vc_separator border_width=”5″][/vc_column][/vc_row]
On November 16th last,
I sent out an email with this Headline;
“Stocks are in a horribly precarious position right now!
And it is time to prepare for market chaos….”
Heres the chart that I showed;
DAILY Chart:
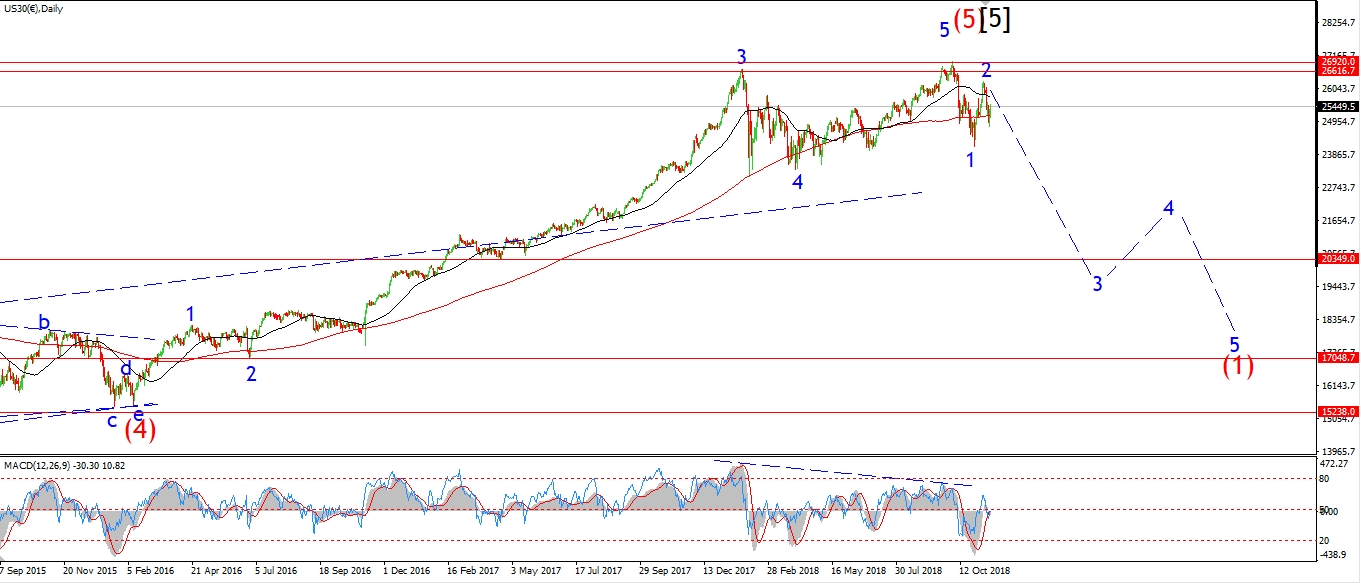
The DOW had declined off the all time high in an impulse wave structure.
I said;
“What comes next in wave ‘3’
will blow your socks off!”
The DOW completed wave ‘2’, and within a few days wave ‘3’ down began with a crash!
In my nightly update on December 3rd I said:
“As I am a consistent bear on stocks,
It would be remiss of me to mention that the market is down off a gap to a new high.
Todays move could also be viewed as an exhaustion gap at the end of wave [c].
In that case,
we could have an irregular flat complete at the session high of 25973.
If the price continues lower tomorrow to create a further five waves down,
that will strongly favor the irregular flat idea.”
Heres the chart I showed;
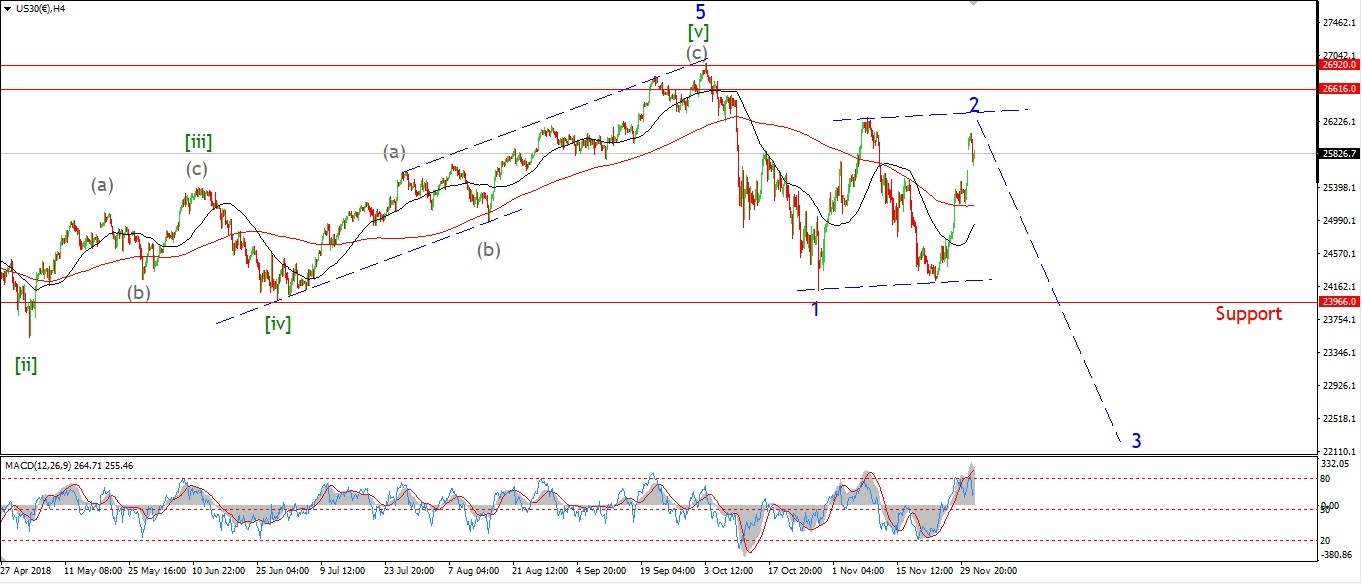
And here’s what happened next;

25973 was the final high for wave ‘2’.
And then began the largest plunge in the Stock market since the great recession of 2008/2009.
The DOW lost 17.5% in a few short weeks in December!
A total decline of just over 4500 points!
The investment world was blind sided by this move!
But Elliott wave saw this crash coming a mile out!
[vc_row][vc_column][vc_separator border_width=”5″][/vc_column][/vc_row]
Don’t miss the next big move
in the the stock market!
Join now.
[vc_row][vc_column][vc_separator border_width=”5″][/vc_column][/vc_row]
BULLWAVES Membership.
Nightly Elliott Wave Analysis for;
GOLD, SILVER, DOW Jones,
S&P 500, US 10YR, WTI Crude Oil,
EURUSD, GBPUSD, USDJPY.
[vc_row][vc_column][vc_separator border_width=”5″][/vc_column][/vc_row]
[vc_row][vc_column][vc_column_text]
Monthly Membership.
[vc_row][vc_column][vc_separator border_width=”5″][/vc_column][/vc_row]
What about the GOLD market?
[vc_row][vc_column][vc_separator border_width=”5″][/vc_column][/vc_row]
Back in August 2017 I released this chart to support my very bullish outlook for GOLD.
It involves a long term corrective low in wave ‘2’.
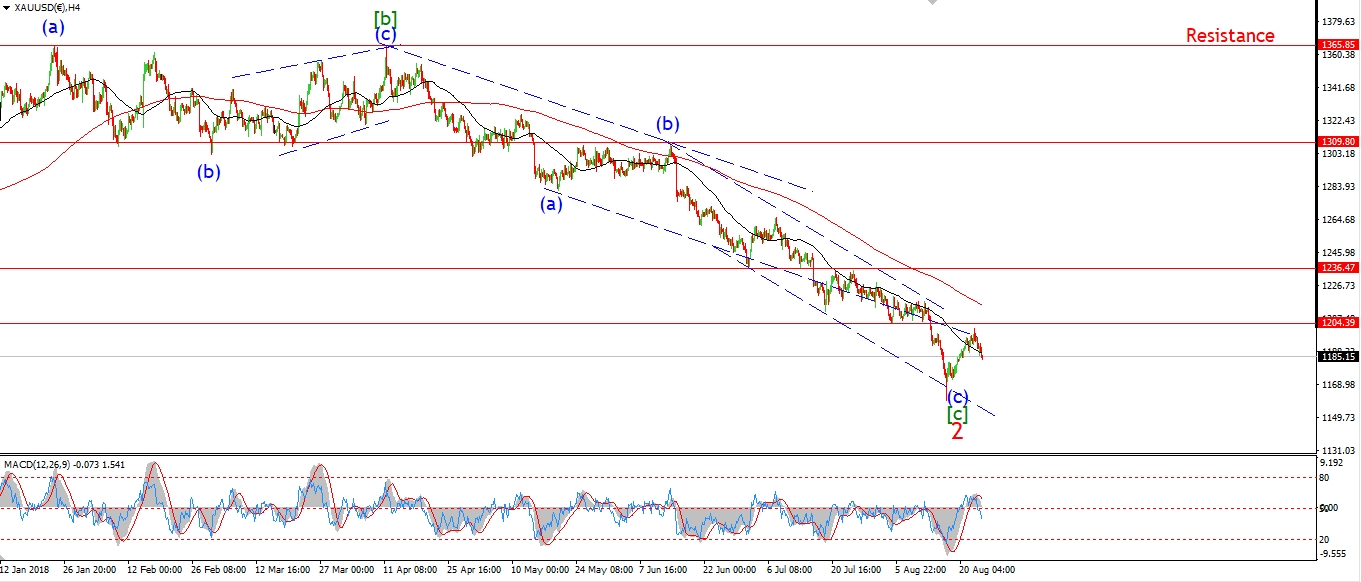
The market had just created an impulsive pattern higher off the 1160 lows on August 16th.
The wave count called for a large wave ‘3’ up to begin off that low.
I said this on the 28th of August;
“We are now drawing near
to an impulsive bullish signal in GOLD.”
And here is the outcome of that call;

Gold hit a high on January 4th of 1298.
That is a 12% rise off the lows.
[vc_row][vc_column][vc_separator border_width=”5″][/vc_column][/vc_row]
Become a BULLWAVES Member,
And find out where GOLD goes next!
[vc_row][vc_column][vc_separator border_width=”5″][/vc_column][/vc_row]
[vc_row][vc_column][vc_column_text]
Monthly Membership.
[vc_row][vc_column][vc_separator border_width=”5″][/vc_column][/vc_row]
And what about Crude Oil….
[vc_row][vc_column][vc_separator border_width=”5″][/vc_column][/vc_row]
In September 2018,
Everyone on ‘the News’ called for $100 Oil.
But;
The wave count called for an Oil Price Crash!
[vc_row][vc_column][vc_separator border_width=”5″][/vc_column][/vc_row]
On Tuesday October 2nd,
Crude oil was trading at $75.00 for the first time in 4 years.
Jim Cramer on CNBC said;
“don’t let an overdeveloped sense of caution
trick you into missing these straightforward moves,
it could cost you!”
Sept 25th – Don’t overthink—the oil rally is for real!
Bullish commentary on CNBC did not stop there!
Oct 1st – OPEC ‘powerless to prevent’ oil jumping toward $100 a barrel this year.
Oct 1st – “$100 a barrel oil now looks possible, if not inevitable” .
Oct 3rd – The oil market ‘fever’ pushing prices toward $100 won’t break soon.
An over-bullish mania type behavior had gripped the market and the news.
But;
At the very same time;
My Elliott wave count quietly suggested a different future for Crude prices!
I knew a crash was coming soon!
On Oct 2nd,
I published this article;.
NO THIS IS NOT A NEW BULL MARKET IN CRUDE OIL!!
Prices were at a 4 year high, and the world was consumed with oil price fever!
But in that article I said;
“The scene is set for another horrible decline in the oil price,
the wave count says so,
and the futures market agrees!”
Heres a chart from that nights update:
The chart called for one more pop to the upside to above the 76.00 handle and then a crash!
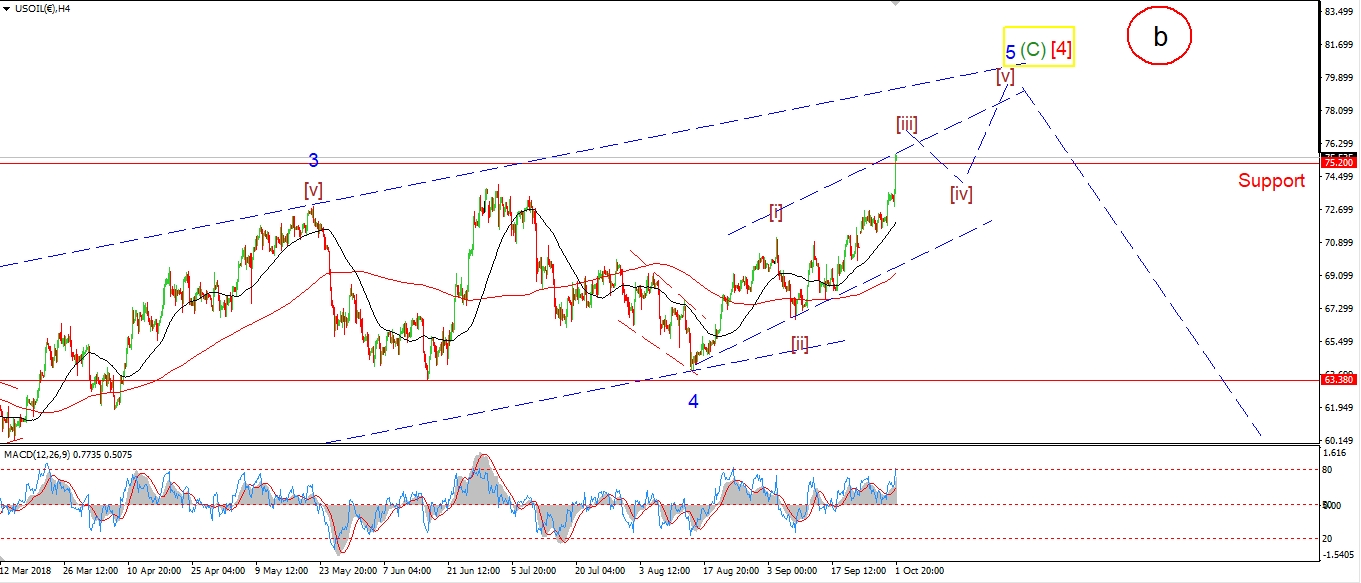
Wave [4] was complete at that high,
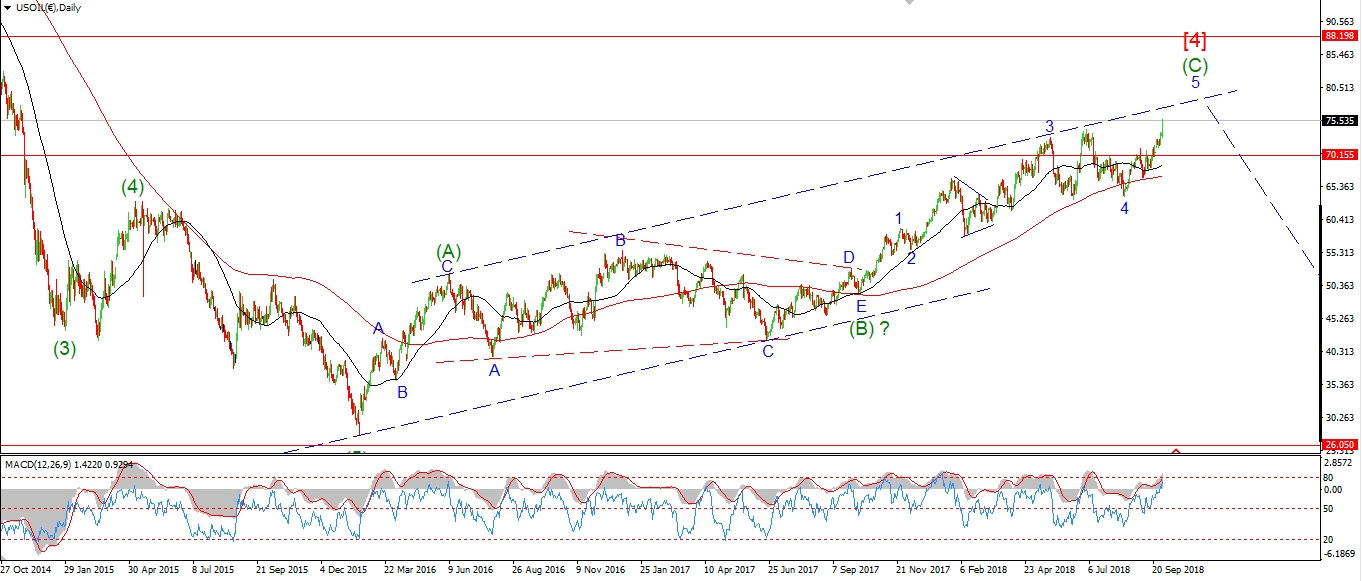
And then came a 44% decline as predicted!
The very next day, on Oct 3rd,
the price rose into 76.72 at the top.
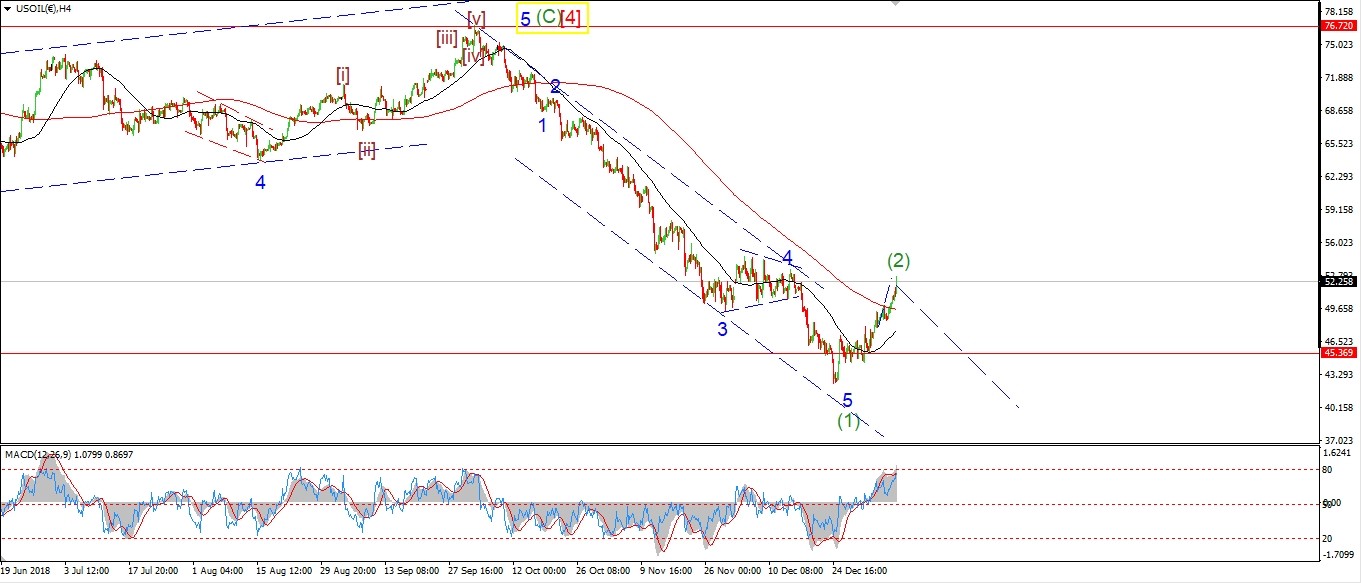
And then;
the oil price crashed by 44% into the December lows!
Exactly in line with the wave count!
The price reached a low on December 24th of $42.40 a barrel.
that makes a total fall of 3360 points in 11 weeks!
That’s a hell of a long way off $100 a barrel, hey Mr Cramer?
[vc_row][vc_column][vc_separator border_width=”5″][/vc_column][/vc_row]
The news can never prepare you for a trend change!
But Bullwaves.org can.
[vc_row][vc_column][vc_separator border_width=”5″][/vc_column][/vc_row]
Become a BULLWAVES Member,
And see the next trend before it even begins.
[/vc_column_text][/vc_column][/vc_row]
[vc_row][vc_column][vc_separator border_width=”5″][/vc_column][/vc_row]
[vc_row][vc_column][vc_column_text]