
[vc_row][vc_column][vc_separator border_width=”5″][/vc_column][/vc_row][vc_row][vc_column][vc_column_text]Good evening to one and all.
Interesting price action in both EURUSD and GOLD today.
The market seems to be acting inline with the wave count in EURUSD and GBPUSD, and in GOLD the fresh declines triggered the alternate wave count.
Lets dive into the action.[/vc_column_text][/vc_column][/vc_row]
[_s2If current_user_can(access_s2member_ccap_eurusd)]
[vc_row][vc_column][vc_separator border_width=”5″][/vc_column][/vc_row][vc_row][vc_column][vc_column_text]
EURUSD
[/vc_column_text][/vc_column][/vc_row][vc_row][vc_column][vc_separator border_width=”5″][/vc_column][/vc_row][vc_row][vc_column width=”2/3″][vc_custom_heading text=”30 min” use_theme_fonts=”yes”][vc_column_text] [/vc_column_text][/vc_column][vc_column width=”1/3″][vc_custom_heading text=”4 Hours” use_theme_fonts=”yes”][vc_column_text]
 [/vc_column_text][vc_custom_heading text=”Daily” use_theme_fonts=”yes”][vc_column_text]
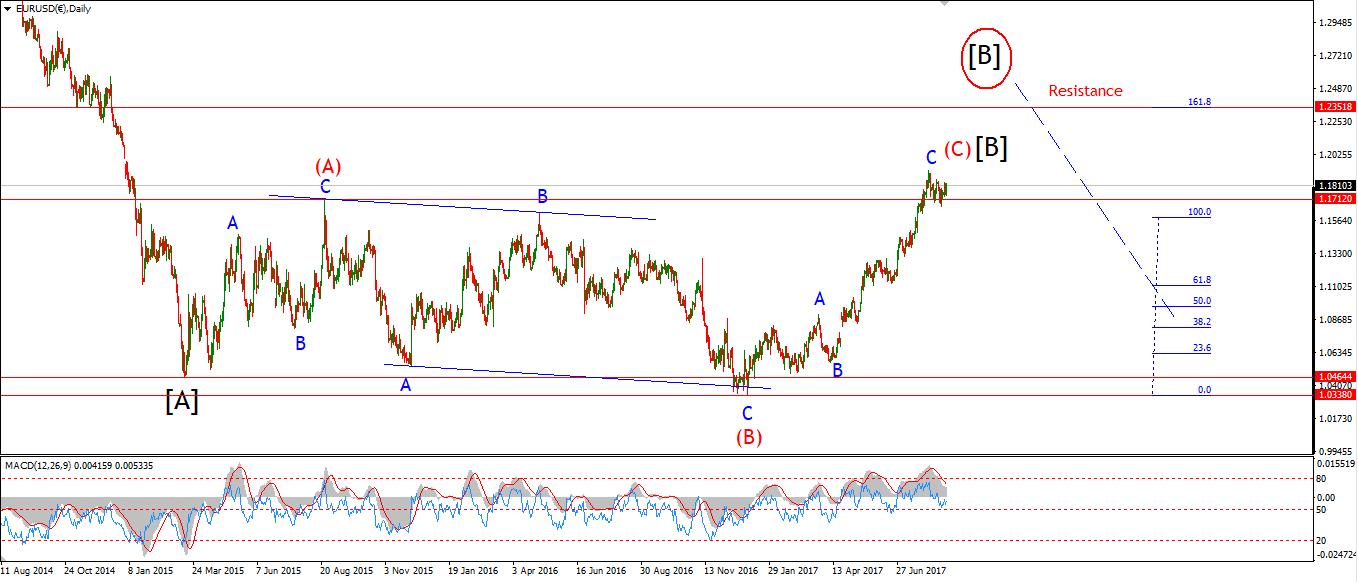 [/vc_column_text][/vc_column][/vc_row][vc_row][vc_column][vc_column_text]My Bias: long term bearish
Wave Structure: downward impulse wave
Long term wave count: lower in wave (3) red
Important risk events: EUR: German ZEW Economic Sentiment. USD: Building Permits, Current Account, Housing Starts.
After a day of pretty flat action,
the price strcuture may have completed wave ‘iv’ pink at todays low of 1.1914
It is a bit early to say,but the rise off the low today may be wave ‘1’ grey.
If the price drops below 1.1914, then wave ‘e’ will still be in force.
in both scenarios, the price must not break support at 1.1823.
For tomorrow;
Watch for a break of the wave ‘d’ high at 1.1986,
This will signal wave ‘v’ has possibly begun.
The initial target for wave ‘v’ remains at 1.2200.[/vc_column_text][/vc_column][/vc_row]
[/_s2If]
[_s2If current_user_can(access_s2member_ccap_gbpusd)]
[vc_row][vc_column][vc_separator border_width=”5″][/vc_column][/vc_row][vc_row][vc_column][vc_column_text]
GBPUSD
[/vc_column_text][/vc_column][/vc_row][vc_row][vc_column][vc_separator border_width=”5″][/vc_column][/vc_row][vc_row][vc_column width=”2/3″][vc_custom_heading text=”30 min” use_theme_fonts=”yes”][vc_column_text] [/vc_column_text][/vc_column][vc_column width=”1/3″][vc_custom_heading text=”4 Hours” use_theme_fonts=”yes”][vc_column_text]
 [/vc_column_text][vc_custom_heading text=”Daily” use_theme_fonts=”yes”][vc_column_text]
 [/vc_column_text][/vc_column][/vc_row][vc_row][vc_column][vc_column_text]My Bias: short below parity in wave (5).
Wave Structure: continuing impulsive structure to the downside in wave (5)
Long term wave count: decline in wave (5) blue, below parity
Important risk events: GBP: N/A. USD: Building Permits, Current Account, Housing Starts.
After a flat overnight session,
cable then dropped in three waves off the intra-day high.
it is possible that wave ‘4’ grey is complete at the low of the day.
The price must stay above the wave ‘1’ high at 1.3406 for this structure to remain valid.
A rally in wave ‘5’ grey is still on the cards
This should reach the upper trendline at about 1.3720, the Fibonacci target lies at 1.3860.
For tomorrow;
Watch for support at 1.3406 to remain untouched.
A break of that level would indicate that the top is already in.
And a break of the previous wave ‘iv’ at 1.3150 will confirm the top is in place.[/vc_column_text][/vc_column][/vc_row]
[/_s2If]
[_s2If current_user_can(access_s2member_ccap_usdjpy)]
[vc_row][vc_column][vc_separator border_width=”5″][/vc_column][/vc_row][vc_row][vc_column][vc_column_text]
USDJPY
[/vc_column_text][/vc_column][/vc_row][vc_row][vc_column][vc_separator border_width=”5″][/vc_column][/vc_row][vc_row][vc_column width=”2/3″][vc_custom_heading text=”30 min” use_theme_fonts=”yes”][vc_column_text] [/vc_column_text][/vc_column][vc_column width=”1/3″][vc_custom_heading text=”4 Hours” use_theme_fonts=”yes”][vc_column_text]
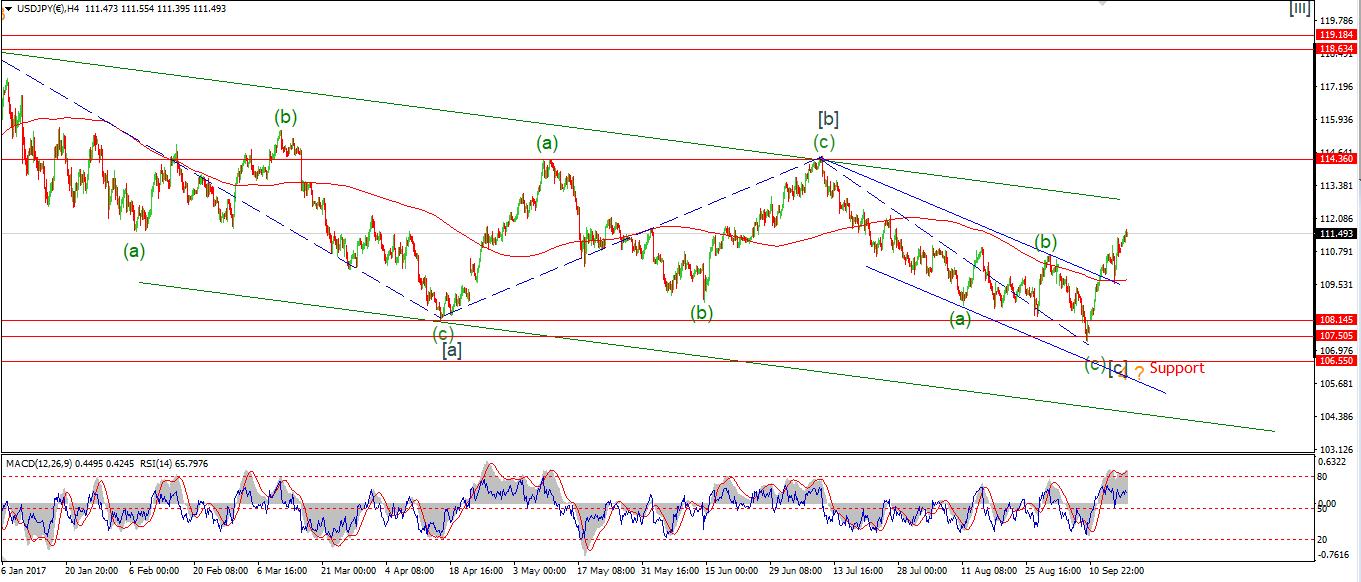 [/vc_column_text][vc_custom_heading text=”Daily” use_theme_fonts=”yes”][vc_column_text]
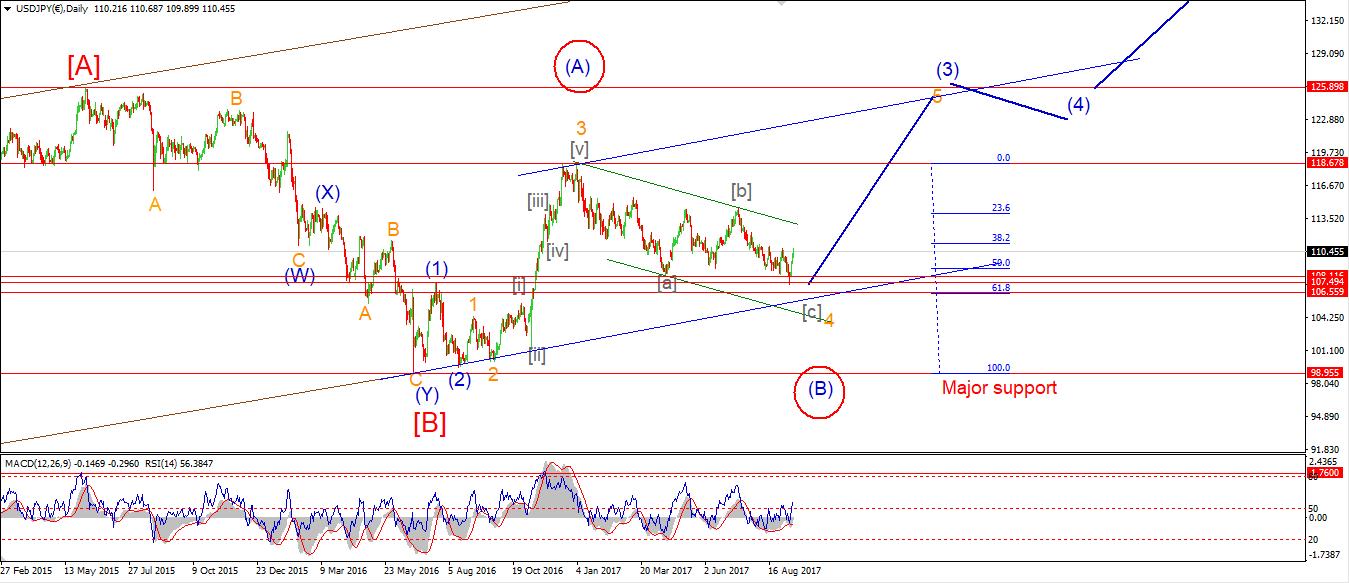 [/vc_column_text][/vc_column][/vc_row][vc_row][vc_column][vc_column_text]My Bias: LONG
Wave Structure: rally in wave [C]
Long term wave count: wave [C] is underway, upside to above 136.00
Important risk events: JPY: N/A. USD: Building Permits, Current Account, Housing Starts.
The relentless upward momentum in USDJPY over the last week
has brought about a few different interpretations of the structure of the rally.
Todays continued rise has forced another rethink.
The rally off thursdays low of 109.54 is now viewed as wave ‘i’ of (iii),
A minor contracting triangle can be seen within wave ‘i’
and the previous wave count becomes the alternate shown circled in red.
The new wave count now calls for a drop in wave ‘ii’ brown.
This decline should not break the previous low of wave (ii) green at 109.54.
For tomorrow;
The divergence of momentum on the 30min chart indicates a decline is on the cards soon.
Watch for wave ‘ii’ to begin.[/vc_column_text][/vc_column][/vc_row]
[/_s2If]
[_s2If current_user_can(access_s2member_ccap_dow_jones)]
[vc_row][vc_column][vc_separator][/vc_column][/vc_row][vc_row][vc_column][vc_column_text]
DOW JONES INDUSTRIALS
[/vc_column_text][/vc_column][/vc_row][vc_row][vc_column][vc_separator][/vc_column][/vc_row][vc_row][vc_column width=”2/3″][vc_custom_heading text=”30 min” use_theme_fonts=”yes”][vc_column_text] [/vc_column_text][/vc_column][vc_column width=”1/3″][vc_custom_heading text=”4 Hours” use_theme_fonts=”yes”][vc_column_text]
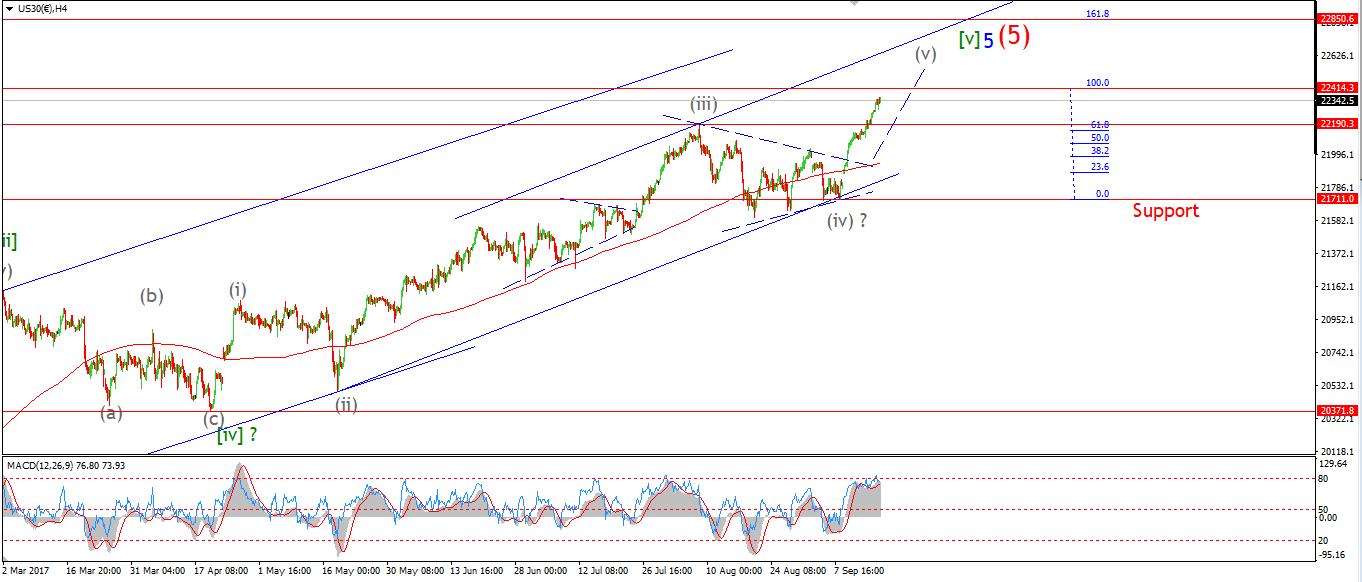 [/vc_column_text][vc_custom_heading text=”Daily” use_theme_fonts=”yes”][vc_column_text]
 [/vc_column_text][/vc_column][/vc_row][vc_row][vc_column][vc_column_text]My Bias: market topping process ongoing
Wave Structure: Impulsive 5 wave structure, possibly topping in an all time high.
Long term wave count: Possibly topped in wave (5)
Important risk events: USD: Building Permits, Current Account, Housing Starts.
Todays continued rally in the DOW
has brought the price to within spitting distance of the initial Fibonacci target for wave ‘v’.
This target lies at 22419, and is where wave (v) grey equals wave (i) grey.
Todays high reached 22355, 64 points off target.
The wave count still favors a rally in wave ‘v’ pink,
possibly to the upper trendline, with a final high above 22600.
For tomorrow;
a decline is on the cards given that short term momentum has declined from an extreme high.
The initial support for wave ‘iv’ pink lies at 22086.[/vc_column_text][/vc_column][/vc_row]
[/_s2If]
[_s2If current_user_can(access_s2member_ccap_gold)]
[vc_row][vc_column][vc_separator][/vc_column][/vc_row][vc_row][vc_column][vc_column_text]
GOLD
[/vc_column_text][/vc_column][/vc_row][vc_row][vc_column][vc_separator][/vc_column][/vc_row][vc_row][vc_column width=”2/3″][vc_custom_heading text=”30 min” use_theme_fonts=”yes”][vc_column_text] [/vc_column_text][/vc_column][vc_column width=”1/3″][vc_custom_heading text=”4 Hours” use_theme_fonts=”yes”][vc_column_text]
 [/vc_column_text][vc_custom_heading text=”Daily” use_theme_fonts=”yes”][vc_column_text]
 [/vc_column_text][/vc_column][/vc_row][vc_row][vc_column][vc_column_text]My Bias: Long towards 1550
Wave Structure: ZigZag correction to the upside.
Long term wave count: Topping in wave (B) at 1550
Important risk events: USD: Building Permits, Current Account, Housing Starts.
GOLD dropped through the short term invalidation line today.
this has triggered the alternate wave count.
the updated chart now shows the decline off the recent high at 1357 as wave (iv) blue.
The decline so far has traced out three waves and is approaching the lower trendline of the trend channel.
price has not reached the trendline yet,
With the previous fourth wave support at 1298,
it is likely we see that level reached as the trend channel closes out.
The price has also reached the 200MA on the 4hr chart.
Ans should find significant support here.
For tomorrow;
watch for this correction in wave (iv) to complete around 1298.
A higher low above that level will indicate wave (v) has begun.[/vc_column_text][/vc_column][/vc_row]
[/_s2If]