
[vc_row][vc_column][vc_separator border_width=”5″][/vc_column][/vc_row][vc_row][vc_column][vc_column_text]Good night to you all!
I hope you had a great week,
The sun finally came out today here,
after two weeks hidden behind a blanket of cloud and rain, a real eclipse!
It has been a flat week all around.
The markets are in the usual end of summer go slow,
It will be a different story once september rolls in and the volume picks up again.
I will be away on holidays with the wife and kids next week,
But I hope to update the charts as often as the internet connection, and kids, allow.
Every effort will be made![/vc_column_text][/vc_column][/vc_row]
[_s2If current_user_can(access_s2member_ccap_eurusd)]
[vc_row][vc_column][vc_separator border_width=”5″][/vc_column][/vc_row][vc_row][vc_column][vc_column_text]
EURUSD
[/vc_column_text][/vc_column][/vc_row][vc_row][vc_column][vc_separator border_width=”5″][/vc_column][/vc_row][vc_row][vc_column width=”2/3″][vc_custom_heading text=”30 min” use_theme_fonts=”yes”][vc_column_text] [/vc_column_text][/vc_column][vc_column width=”1/3″][vc_custom_heading text=”4 Hours” use_theme_fonts=”yes”][vc_column_text]
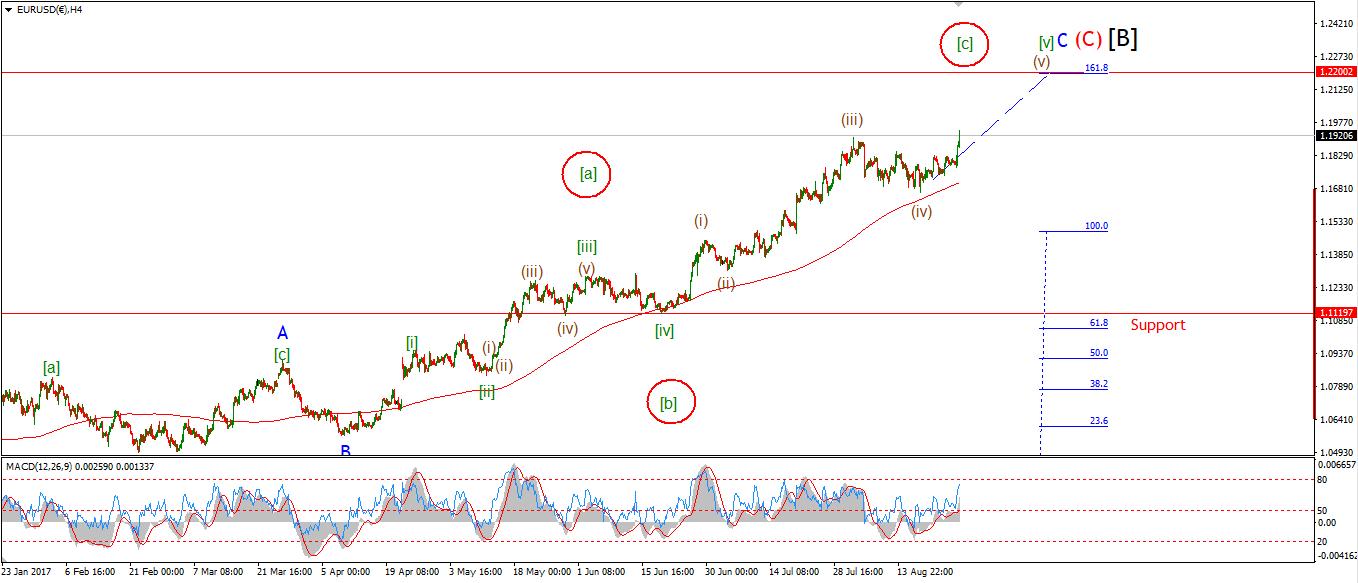 [/vc_column_text][vc_custom_heading text=”Daily” use_theme_fonts=”yes”][vc_column_text]
 [/vc_column_text][/vc_column][/vc_row][vc_row][vc_column][vc_column_text]My Bias: long term bearish
Wave Structure: downward impulse wave
Long term wave count: lower in wave (3) red
Important risk events: EUR: M3 Money Supply y/y. USD: CB Consumer Confidence. USD: CB Consumer Confidence.
Changing trends take time,
EURUSD is a good example of this.
The future for EURUSD is most deffinitely down,
in a big way.
And as we cycle through the wave count,
We are getting closer and closer to that turning point.
The immediately bearish wave count was hanging on by a thread.
And was invalidaated as I wrote this evenings analysis!
price broke up above 1.1910,
The new wave count shows the price rising in wave (v)
And upper target shown on the 4hr chart is the one to watch.
So it is worth while noting this wave count again.
The current sideways action is seen as a complex wave (iv).
This interpretation would allow for another rally up to the target shown on the 4hr chart at 1.2200
For next week:
This market is closing out a corrective rally at a very large degree.
The market is just now deciding how to complete the rally in wave [B]
And then begin the new downtrend.
For now, the next major target is 1.2200 to complete wave [B].[/vc_column_text][/vc_column][/vc_row]
[/_s2If]
[_s2If current_user_can(access_s2member_ccap_gbpusd)]
[vc_row][vc_column][vc_separator border_width=”5″][/vc_column][/vc_row][vc_row][vc_column][vc_column_text]
GBPUSD
[/vc_column_text][/vc_column][/vc_row][vc_row][vc_column][vc_separator border_width=”5″][/vc_column][/vc_row][vc_row][vc_column width=”2/3″][vc_custom_heading text=”30 min” use_theme_fonts=”yes”][vc_column_text] [/vc_column_text][/vc_column][vc_column width=”1/3″][vc_custom_heading text=”4 Hours” use_theme_fonts=”yes”][vc_column_text]
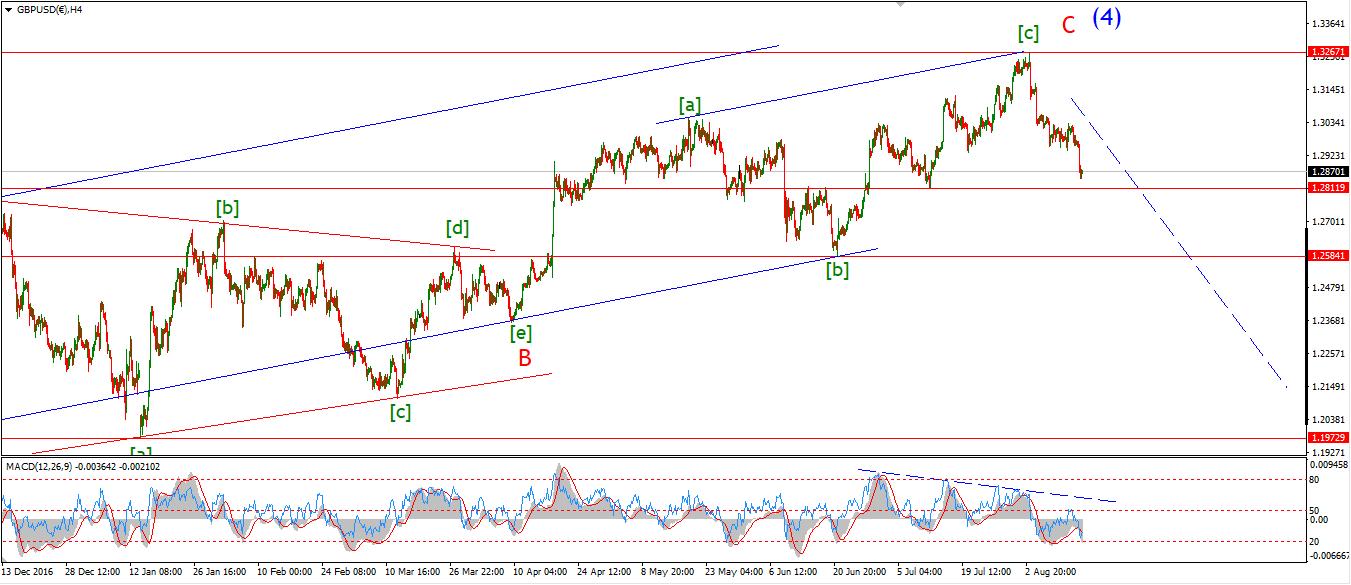 [/vc_column_text][vc_custom_heading text=”Daily” use_theme_fonts=”yes”][vc_column_text]
 [/vc_column_text][/vc_column][/vc_row][vc_row][vc_column][vc_column_text]My Bias: short below parity in wave (5).
Wave Structure: continuing impulsive structure to the downside in wave (5)
Long term wave count: decline in wave (5) blue, below parity
Important risk events: GBP: Net Lending to Individuals m/m. USD: CB Consumer Confidence.
Cable may be further along in the process to EURUSD,
the declines off the recent high look very impulsive so far,
Both the preferred wave count and the alternate count view the top as complete.
The new downtrend has begun off the high at 1.3268.
The alternate wave count would allow a larger correction higher in wave (ii).
Wave ‘2’ grey posted a short rally today towards the resistance at 1.2916.
Wave ‘2’ still shows a three wave structure off Thursdays low.
A decline below support at 1.2774 will further confirm the bearish wave count.
For next week;
The high at 1.3031 at wave (ii) is the invalidation line for the current wave count.
If this breaks, the alternate wave count will be triggered.
Watch for the action off resistance at 1.2916 early on monday.
An impulsive decline will signal that wave ‘3’ grey has begun.[/vc_column_text][/vc_column][/vc_row]
[/_s2If]
[_s2If current_user_can(access_s2member_ccap_usdjpy)]
[vc_row][vc_column][vc_separator border_width=”5″][/vc_column][/vc_row][vc_row][vc_column][vc_column_text]
USDJPY
[/vc_column_text][/vc_column][/vc_row][vc_row][vc_column][vc_separator border_width=”5″][/vc_column][/vc_row][vc_row][vc_column width=”2/3″][vc_custom_heading text=”30 min” use_theme_fonts=”yes”][vc_column_text] [/vc_column_text][/vc_column][vc_column width=”1/3″][vc_custom_heading text=”4 Hours” use_theme_fonts=”yes”][vc_column_text]
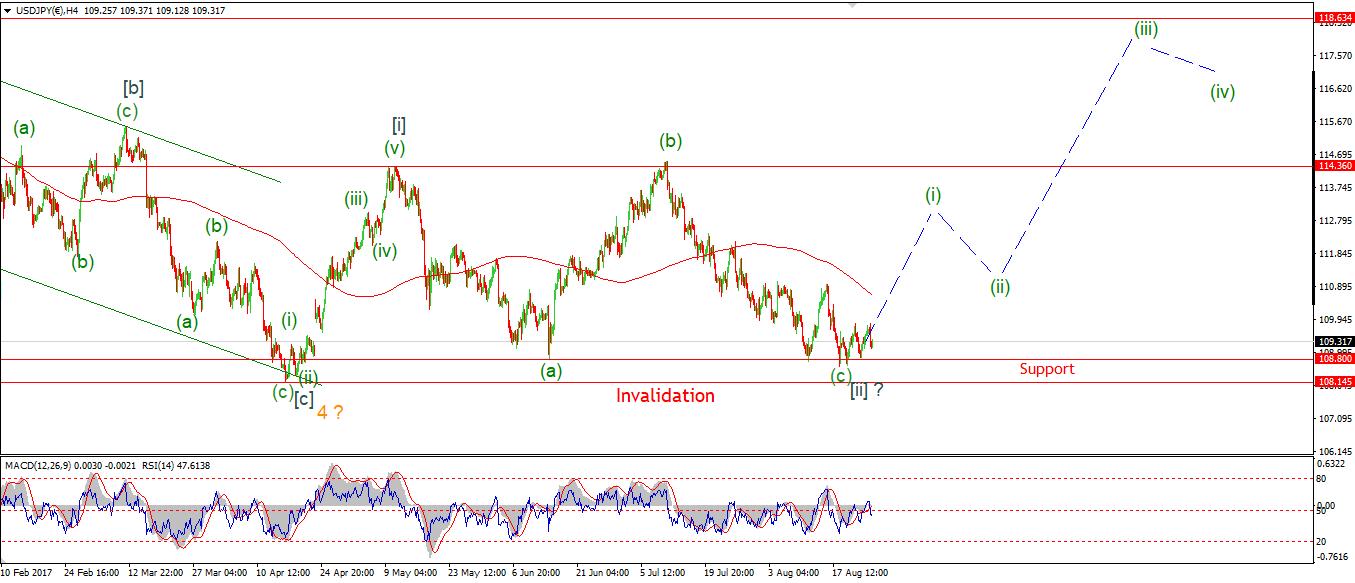 [/vc_column_text][vc_custom_heading text=”Daily” use_theme_fonts=”yes”][vc_column_text]
 [/vc_column_text][/vc_column][/vc_row][vc_row][vc_column][vc_column_text]My Bias: LONG
Wave Structure: rally in wave [C]
Long term wave count: wave [C] is underway, upside to above 136.00
Important risk events: JPY: N/A. USD: CB Consumer Confidence.
The short term action in USDJPY has been tricky to read these last few weeks.
Despite some very impulsive moves to the upside,
The price has corrected to new lows.
And the action this week has proved unsatisfactory to read as an impulse structure to the upside.
Again,
the big picture on the daily chart is for a very large rally in the USD.
How the current corrective phase plays out will reveal itself in time.
On the 4hr chart, wave [ii] grey looks complete going by this current interpretation.
so I am looking for a bullish Elliott wave signal to the upside to indicate wave [iii] grey has begun.
And that remains the focus next week.
The immediate alternate view on the short term chart would see yet another three wave decline inside the trend channel.
A break of 1.0750 will trigger a change of the larger wave count on the 4hr chart.
For next week;
108.60 is the level to watch,
There has been three higher lows above that level in the last week,
A further rally into resistance could complete a larger impulse wave to the upside.
And that will create a bullish signal.
It is a case of wait and see for the moment.[/vc_column_text][/vc_column][/vc_row]
[/_s2If]
[_s2If current_user_can(access_s2member_ccap_dow_jones)]
[vc_row][vc_column][vc_separator][/vc_column][/vc_row][vc_row][vc_column][vc_column_text]
DOW JONES INDUSTRIALS
[/vc_column_text][/vc_column][/vc_row][vc_row][vc_column][vc_separator][/vc_column][/vc_row][vc_row][vc_column width=”2/3″][vc_custom_heading text=”30 min” use_theme_fonts=”yes”][vc_column_text] [/vc_column_text][/vc_column][vc_column width=”1/3″][vc_custom_heading text=”4 Hours” use_theme_fonts=”yes”][vc_column_text]
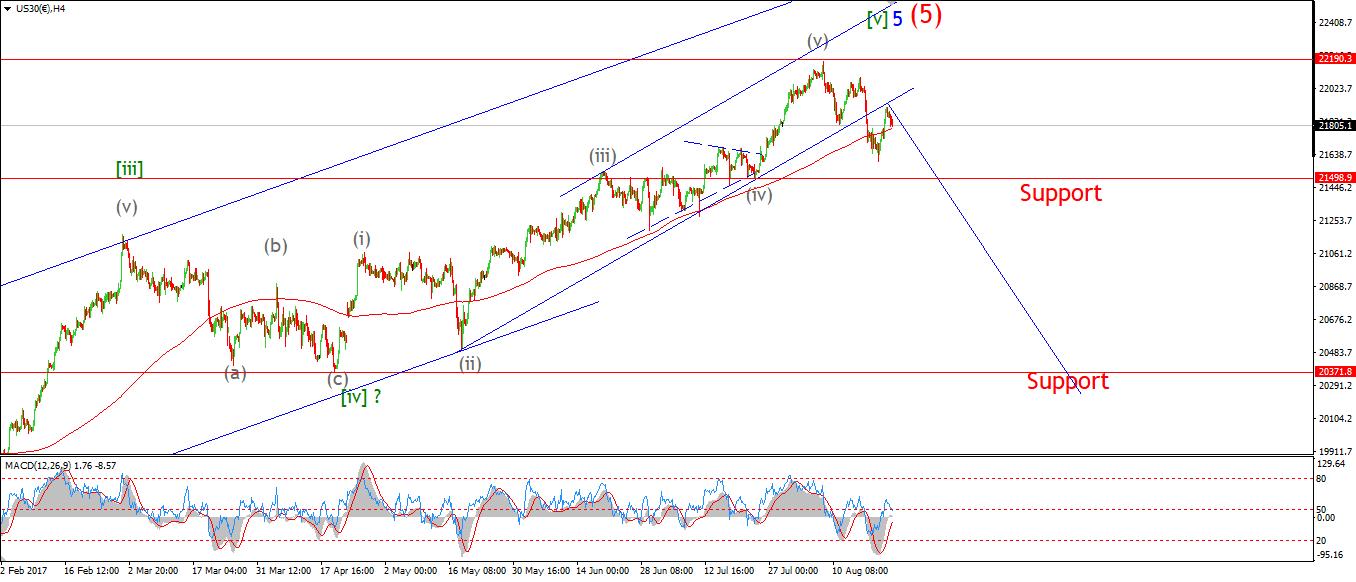 [/vc_column_text][vc_custom_heading text=”Daily” use_theme_fonts=”yes”][vc_column_text]
 [/vc_column_text][/vc_column][/vc_row][vc_row][vc_column][vc_column_text]My Bias: market topping process ongoing
Wave Structure: Impulsive 5 wave structure, possibly topping in an all time high.
Long term wave count: Topping in wave (5)
Important risk events: USD: CB Consumer Confidence.
Todays spike higher in the DOW almost hit resistance at wave ‘ii’ pink.
The best interpretation for the move so far
is a decline in a possible leading diagonal wave ‘1’ blue
And an expanding flat wave ‘2’ blue into todays high.
The price has given up much of it gains again this evening.
So it is possible that wave ‘3’ blue has now begun.
The probability for another large decline in wave ‘iii’ of (iii) is growing now.
IF you check the 4hr chart,
The price now sits at the 200MA,
Another decline below this line could turn this market for good.
For next week;
This market is on a Knife edge right now.
A break of immediate resistance at the wave ‘ii’ high will force a rethink of the short term count.
But another impulsive decline below wave ‘1’ blue
Could kick off a larger decline in wave ‘iii’ pink.[/vc_column_text][/vc_column][/vc_row]
[/_s2If]
[_s2If current_user_can(access_s2member_ccap_gold)]
[vc_row][vc_column][vc_separator][/vc_column][/vc_row][vc_row][vc_column][vc_column_text]
GOLD
[/vc_column_text][/vc_column][/vc_row][vc_row][vc_column][vc_separator][/vc_column][/vc_row][vc_row][vc_column width=”2/3″][vc_custom_heading text=”30 min” use_theme_fonts=”yes”][vc_column_text] [/vc_column_text][/vc_column][vc_column width=”1/3″][vc_custom_heading text=”4 Hours” use_theme_fonts=”yes”][vc_column_text]
 [/vc_column_text][vc_custom_heading text=”Daily” use_theme_fonts=”yes”][vc_column_text]
 [/vc_column_text][/vc_column][/vc_row][vc_row][vc_column][vc_column_text]My Bias: Long towards 1550
Wave Structure: ZigZag correction to the upside.
Long term wave count: Topping in wave (B) at 1550
Important risk events: USD: CB Consumer Confidence.
GOLD took a slight hit today and knocked the market out of its slumber.
The alternate wave count now best fits the action.
This is a more bullish interpretation of the action
and allows for a larger rise in wave ‘3’ pink to occur.
After todays action,
Wave ‘2’ looks to have traced out a three wave correction,
With the contracting triangle forming the central wave.
Todays low in the cash market wave 1281.30,
This now forms key support as the price rallies in wave ‘3’ pink.
The initial target for wave ‘3’ is at 1332
where a cluster of Fibonacci extensions now meet.
For next week;
Watch for another higher low above 1281.30,
A break of the wave ‘1’ high will signal wave ‘3’ has begun.[/vc_column_text][/vc_column][/vc_row]
[/_s2If]