
[_s2If current_user_can(access_s2member_ccap_eurusd)]
[vc_row][vc_column][vc_separator border_width=”5″][/vc_column][/vc_row][vc_row][vc_column][vc_column_text]
EURUSD
[/vc_column_text][/vc_column][/vc_row][vc_row][vc_column][vc_separator border_width=”5″][/vc_column][/vc_row][vc_row][vc_column width=”2/3″][vc_custom_heading text=”30 min” use_theme_fonts=”yes”][vc_column_text] [/vc_column_text][/vc_column][vc_column width=”1/3″][vc_custom_heading text=”4 Hours” use_theme_fonts=”yes”][vc_column_text]
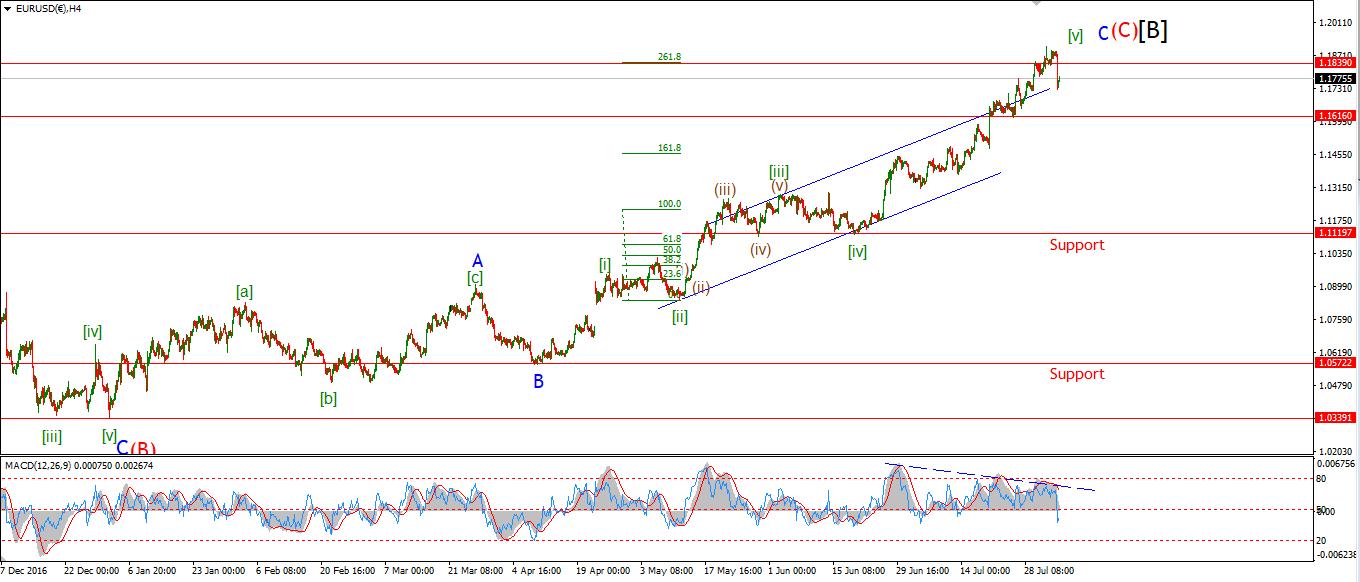 [/vc_column_text][vc_custom_heading text=”Daily” use_theme_fonts=”yes”][vc_column_text]
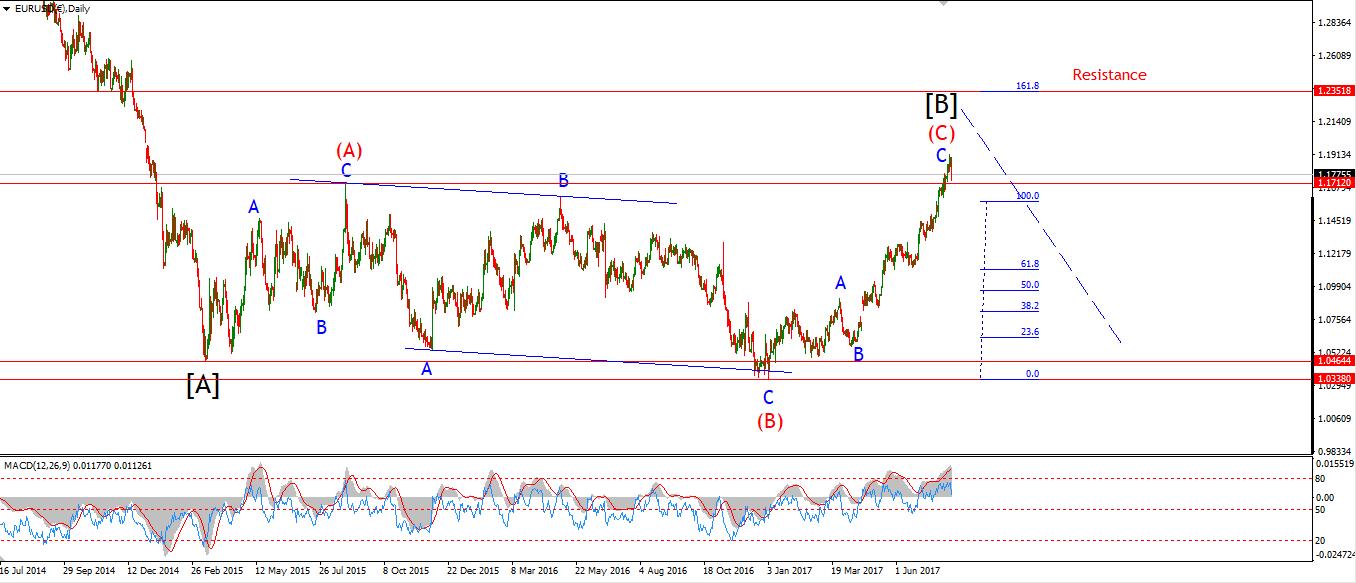 [/vc_column_text][/vc_column][/vc_row][vc_row][vc_column][vc_column_text]My Bias: long term bearish
Wave Structure: downward impulse wave
Long term wave count: lower in wave (3) red
Important risk events: EUR: N/A. USD: Prelim Nonfarm Productivity q/q, Prelim Unit Labor Costs q/q, Crude Oil Inventories.
Hello everyone,
Another day, another Dollar,
And it is beginning to look like we are witnessing resurgent USD!
Calling a major turning point in a market which is completing at seven degrees of trend,
Is a bit like like trying to predict the exact point a supertanker comes to a halt and reverses direction!
Suffice to say it is difficult at the best of times.
That being said,
EURUSD is giving off the right signals off last weeks high.
And after todays decline,
we now have a pretty clear five wave pattern to the downside off the recent high.
I have labelled the decline as wave ‘i’ pink.
Wave ‘ii’ has possibly begun off the low of the day.
First, we will see if the low of the day holds at 1.1715
Wave ‘ii’ pink has an initial target at about 1.1825,
This is the high of the previous fourth wave of one lesser degree.
The 50% retracement level lies at 1.1812, so that is a tight target range for wave ‘ii’.
For tomorrow;
Watch for a corrective rise in wave ‘ii’ pink to complete at about 1.1825.[/vc_column_text][/vc_column][/vc_row]
[/_s2If]
[_s2If current_user_can(access_s2member_ccap_gbpusd)]
[vc_row][vc_column][vc_separator border_width=”5″][/vc_column][/vc_row][vc_row][vc_column][vc_column_text]
GBPUSD
[/vc_column_text][/vc_column][/vc_row][vc_row][vc_column][vc_separator border_width=”5″][/vc_column][/vc_row][vc_row][vc_column width=”2/3″][vc_custom_heading text=”30 min” use_theme_fonts=”yes”][vc_column_text] [/vc_column_text][/vc_column][vc_column width=”1/3″][vc_custom_heading text=”4 Hours” use_theme_fonts=”yes”][vc_column_text]
 [/vc_column_text][vc_custom_heading text=”Daily” use_theme_fonts=”yes”][vc_column_text]
 [/vc_column_text][/vc_column][/vc_row][vc_row][vc_column][vc_column_text]My Bias: short below parity in wave (5).
Wave Structure: continuing impulsive structure to the downside in wave (5)
Long term wave count: decline in wave (5) blue, below parity
Important risk events: GBP: N/A. USD: Prelim Nonfarm Productivity q/q, Prelim Unit Labor Costs q/q, Crude Oil Inventories.
Cable continued its impulsive decline off the recent highs as suggested last night,
and was down 320 points into todays lows.
The immediate decline phase looks near to complete off the lows of the day.
It is now time to look for a corrective rally in wave ‘ii’ pink.
The 50% retracement level of wave ‘i’ pink lies at 1.3109.
So this is the initial target level for wave ‘ii’.
For tomorrow;
Watch for a rebound off support at 1.2930,
And the start of a three wave correction into wave ‘ii’ pink.[/vc_column_text][/vc_column][/vc_row]
[/_s2If]
[_s2If current_user_can(access_s2member_ccap_usdjpy)]
[vc_row][vc_column][vc_separator border_width=”5″][/vc_column][/vc_row][vc_row][vc_column][vc_column_text]
USDJPY
[/vc_column_text][/vc_column][/vc_row][vc_row][vc_column][vc_separator border_width=”5″][/vc_column][/vc_row][vc_row][vc_column width=”2/3″][vc_custom_heading text=”30 min” use_theme_fonts=”yes”][vc_column_text] [/vc_column_text][/vc_column][vc_column width=”1/3″][vc_custom_heading text=”4 Hours” use_theme_fonts=”yes”][vc_column_text]
 [/vc_column_text][vc_custom_heading text=”Daily” use_theme_fonts=”yes”][vc_column_text]
 [/vc_column_text][/vc_column][/vc_row][vc_row][vc_column][vc_column_text]My Bias: LONG
Wave Structure: rally in wave [C]
Long term wave count: wave [C] is underway, upside to above 136.00
Important risk events: JPY: N/A. USD: Prelim Nonfarm Productivity q/q, Prelim Unit Labor Costs q/q, Crude Oil Inventories.
USDJPY may have completed an Elliott wave bullish signal off the recent low at 109.84.
The decline off wave ‘1’ pink is in three waves,
And the price rebounded this afternoon in a positive fashion.
The key level now is at 111.05,
If the price rallies above that point in an impulsive wave form,
It will likely be in wave ‘3’ pink.
The alternate wave count shows the possibility that the rally off the recent lows is wave ‘i’ and ‘ii’ brown.
This would allow for another higher low to begin wave ‘iii’ brown.
For tomorrow;
111.05 remains the level to watch.
Also,
Todays low reached 110.24,
If the price falls below this level again,
it will raise doubts on the immediately bullish outlook.[/vc_column_text][/vc_column][/vc_row]
[/_s2If]
[_s2If current_user_can(access_s2member_ccap_dow_jones)]
[vc_row][vc_column][vc_separator][/vc_column][/vc_row][vc_row][vc_column][vc_column_text]
DOW JONES INDUSTRIALS
[/vc_column_text][/vc_column][/vc_row][vc_row][vc_column][vc_separator][/vc_column][/vc_row][vc_row][vc_column width=”2/3″][vc_custom_heading text=”30 min” use_theme_fonts=”yes”][vc_column_text] [/vc_column_text][/vc_column][vc_column width=”1/3″][vc_custom_heading text=”4 Hours” use_theme_fonts=”yes”][vc_column_text]
 [/vc_column_text][vc_custom_heading text=”Daily” use_theme_fonts=”yes”][vc_column_text]
 [/vc_column_text][/vc_column][/vc_row][vc_row][vc_column][vc_column_text]My Bias: market topping process ongoing
Wave Structure: Impulsive 5 wave structure, possibly topping in an all time high.
Long term wave count: Topping in wave (5)
Important risk events: USD: Prelim Nonfarm Productivity q/q, Prelim Unit Labor Costs q/q, Crude Oil Inventories.
The high of the day in the cash market was 22173.
This is 17 points off the initial target,
I do wonder,
Have we seen the end of the bull market?
It is a bit early to say just yet,
but, the declines off the high todays has taken out the low labelled wave ‘2’ blue.
If this decline continues,
it may well spell disaster for the stock market!
With that in mind, I have shown
The high of the day also reached a trendline connecting the previous three extremes.
We will have to wait and see how this develops from here.
If the price declines in a clear five wave pattern from todays high,
And breaks initial support at 21980,
It will be time to step into full bearish outlook mode!
For tomorrow;
Watch for the support at 21980, if it is broken in an impulsive fashion,
I will switch to the alternate wave count.[/vc_column_text][/vc_column][/vc_row]
[/_s2If]
[_s2If current_user_can(access_s2member_ccap_gold)]
[vc_row][vc_column][vc_separator][/vc_column][/vc_row][vc_row][vc_column][vc_column_text]
GOLD
[/vc_column_text][/vc_column][/vc_row][vc_row][vc_column][vc_separator][/vc_column][/vc_row][vc_row][vc_column width=”2/3″][vc_custom_heading text=”30 min” use_theme_fonts=”yes”][vc_column_text]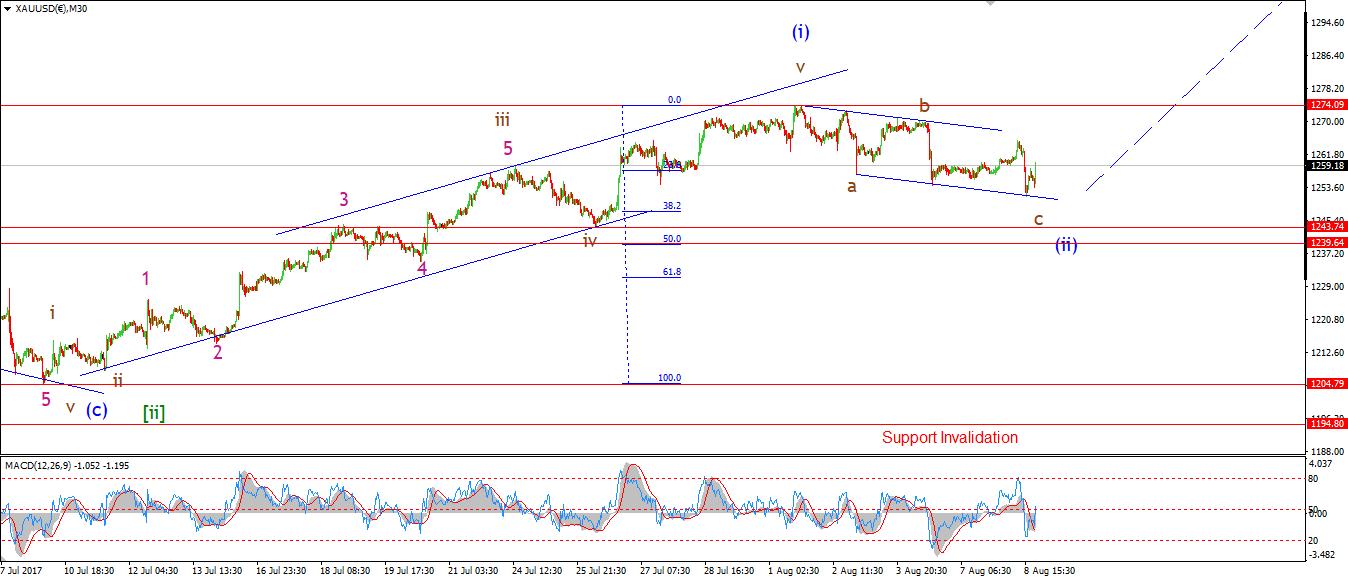 [/vc_column_text][/vc_column][vc_column width=”1/3″][vc_custom_heading text=”4 Hours” use_theme_fonts=”yes”][vc_column_text]
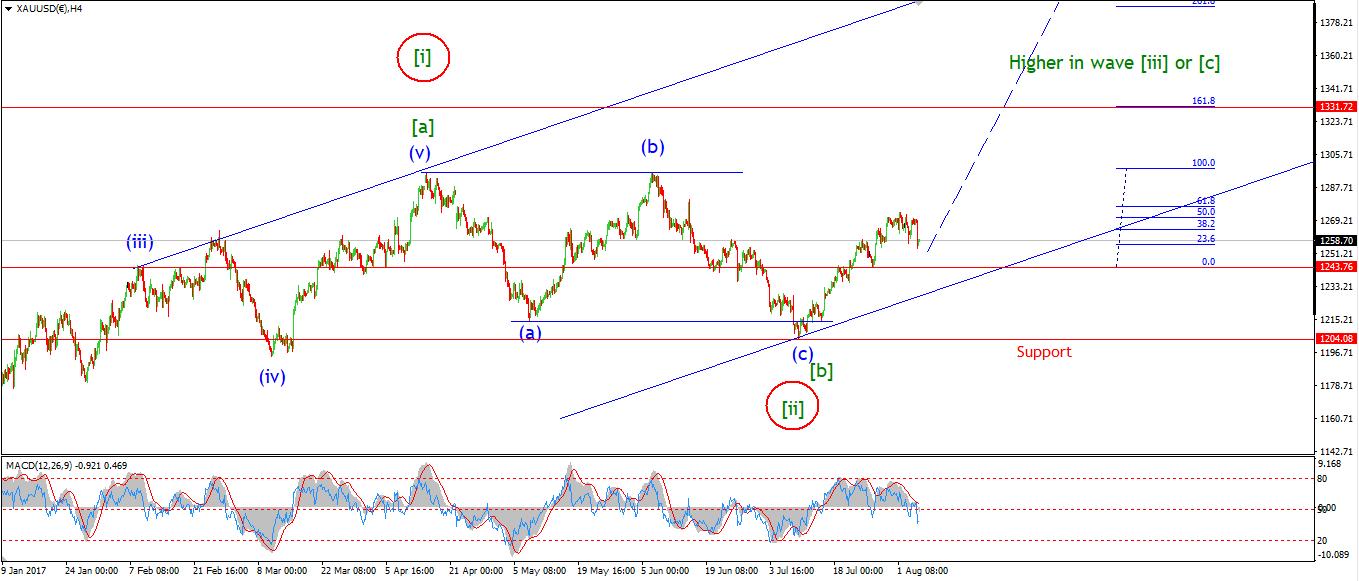 [/vc_column_text][vc_custom_heading text=”Daily” use_theme_fonts=”yes”][vc_column_text]
 [/vc_column_text][/vc_column][/vc_row][vc_row][vc_column][vc_column_text]My Bias: Long towards 1550
Wave Structure: ZigZag correction to the upside.
Long term wave count: Topping in wave (B) at 1550
Important risk events: USD: Prelim Nonfarm Productivity q/q, Prelim Unit Labor Costs q/q, Crude Oil Inventories.
I have switched the labeling on the short term action in GOLD to favor the alternate wave count.
The new wave count fits the subdividing waves better I think.
The price action is now viewed as a rise off the low in wave (i) blue,
And the recent decline is now labelled wave (ii) blue.
This decline is approaching completion as the lower trendline has been reached again.
Wave (ii) blue could be a complex double combination wave, which has a 3,3,3 internal structure.
Initial support lies at 1243, the previous fourth wave.
And 1239, the 50% retracement level.
For tomorrow;
I am actively on the lookout for a rally to begin in wave (iii) blue.
This one should be significant,
A break of 1274 will indicate wave (iii) has begun.[/vc_column_text][/vc_column][/vc_row]
[/_s2If]