
[_s2If current_user_can(access_s2member_ccap_eurusd)]
[vc_row][vc_column][vc_separator border_width=”5″][/vc_column][/vc_row][vc_row][vc_column][vc_column_text]
EURUSD
[/vc_column_text][/vc_column][/vc_row][vc_row][vc_column][vc_separator border_width=”5″][/vc_column][/vc_row][vc_row][vc_column width=”2/3″][vc_custom_heading text=”30 min” use_theme_fonts=”yes”][vc_column_text] [/vc_column_text][/vc_column][vc_column width=”1/3″][vc_custom_heading text=”4 Hours” use_theme_fonts=”yes”][vc_column_text]
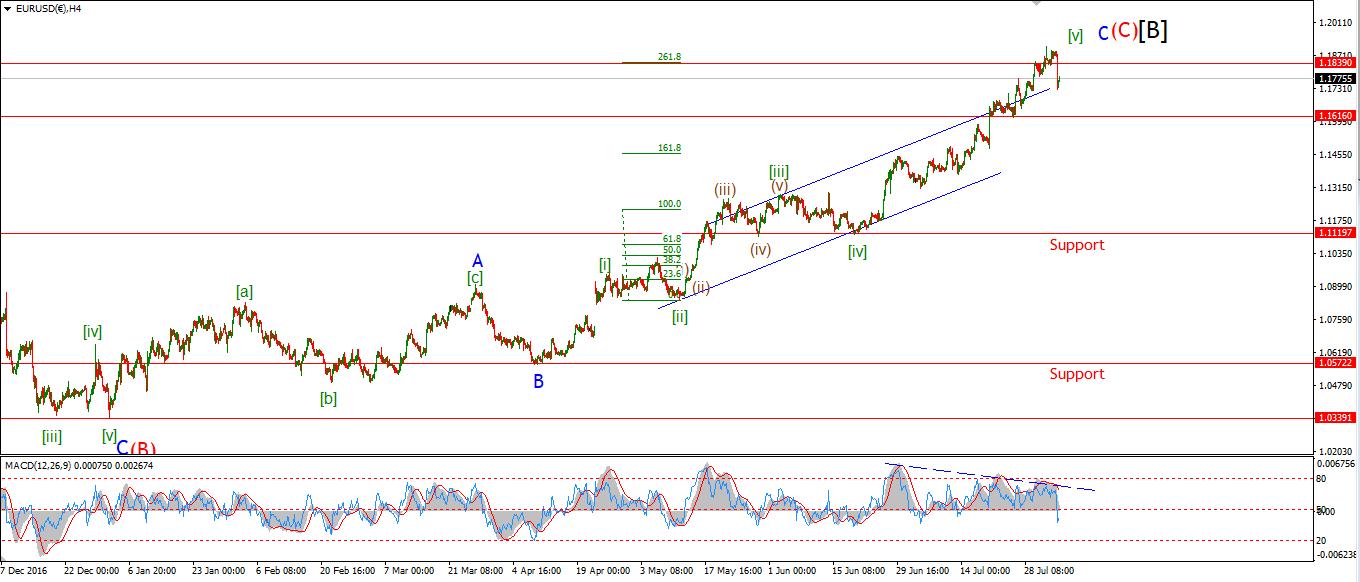 [/vc_column_text][vc_custom_heading text=”Daily” use_theme_fonts=”yes”][vc_column_text]
 [/vc_column_text][/vc_column][/vc_row][vc_row][vc_column][vc_column_text]My Bias: long term bearish
Wave Structure: downward impulse wave
Long term wave count: lower in wave (3) red
Important risk events: EUR: N/A. USD: JOLTS Job Openings.
Good evening to one and all!!
I hope you all had a great weekend.
I have posted the first weekly review video which you can find in the members area.
Despite my best efforts to keep it short and sweet,
It turned out quite long!
Back to business.
EURUSD rose today as expected,
Although the price came close to hitting wave ‘1’ grey at 1.1830.
This level must hold for the bearish wave count to remain valid.
What we need to see is a completed decline in five waves, labelled wave ‘i’.
And then a corrective rally in three waves for wave ‘ii’ pink.
That action will form a bearish Elliott wave signal,
And signal an end to the larger structure.
For tomorrow;
Watch wave ‘1’ grey at 1.1830.
I want to see the price decline again in wave ‘5’ grey.[/vc_column_text][/vc_column][/vc_row]
[/_s2If]
[_s2If current_user_can(access_s2member_ccap_gbpusd)]
[vc_row][vc_column][vc_separator border_width=”5″][/vc_column][/vc_row][vc_row][vc_column][vc_column_text]
GBPUSD
[/vc_column_text][/vc_column][/vc_row][vc_row][vc_column][vc_separator border_width=”5″][/vc_column][/vc_row][vc_row][vc_column width=”2/3″][vc_custom_heading text=”30 min” use_theme_fonts=”yes”][vc_column_text] [/vc_column_text][/vc_column][vc_column width=”1/3″][vc_custom_heading text=”4 Hours” use_theme_fonts=”yes”][vc_column_text]
 [/vc_column_text][vc_custom_heading text=”Daily” use_theme_fonts=”yes”][vc_column_text]
 [/vc_column_text][/vc_column][/vc_row][vc_row][vc_column][vc_column_text]My Bias: short below parity in wave (5).
Wave Structure: continuing impulsive structure to the downside in wave (5)
Long term wave count: decline in wave (5) blue, below parity
Important risk events: GBP: N/A. USD: JOLTS Job Openings.
Cable has possibly completed five waves down in wave ‘i’ pink.
The low of the day reached 1.3013,
The price has barely reacted to that low,
so it is possible that we will see another dip below 1.3013
to complete wave ‘5’ grey.
From here I am expecting a corrective rally in wave ‘ii’ pink
This should trace out three waves.
The 50% retracement level lies at about 1.3140
So that is the initial target for wave ‘ii’ pink.
For tomorrow;
Look for a completing wave ‘i’ at nearby lows and the beginning of a rally in wave ‘ii’.[/vc_column_text][/vc_column][/vc_row]
[/_s2If]
[_s2If current_user_can(access_s2member_ccap_usdjpy)]
[vc_row][vc_column][vc_separator border_width=”5″][/vc_column][/vc_row][vc_row][vc_column][vc_column_text]
USDJPY
[/vc_column_text][/vc_column][/vc_row][vc_row][vc_column][vc_separator border_width=”5″][/vc_column][/vc_row][vc_row][vc_column width=”2/3″][vc_custom_heading text=”30 min” use_theme_fonts=”yes”][vc_column_text] [/vc_column_text][/vc_column][vc_column width=”1/3″][vc_custom_heading text=”4 Hours” use_theme_fonts=”yes”][vc_column_text]
 [/vc_column_text][vc_custom_heading text=”Daily” use_theme_fonts=”yes”][vc_column_text]
 [/vc_column_text][/vc_column][/vc_row][vc_row][vc_column][vc_column_text]My Bias: LONG
Wave Structure: rally in wave [C]
Long term wave count: wave [C] is underway, upside to above 136.00
Important risk events: JPY: N/A. USD: JOLTS Job Openings.
USDJPY drifted sideways today and I have modified the wave count slightly to account for the inaction.
It is possible that wave ‘1’ is complete at fridays high of 111.05.
Wave ‘2’ pink may be tracing out a flat correction,
This should complete in three waves within a trend channel.
The price would meet the lower trendline again at about 110.40.
From that point I will be looking for wave ‘3’ pink to rally into resistance at 112.40.
For tomorrow;
watch for a reaction off the lower trendline.
If the price rallies above 111.05 again, it will signal the beginning of wave ‘3’.[/vc_column_text][/vc_column][/vc_row]
[/_s2If]
[_s2If current_user_can(access_s2member_ccap_dow_jones)]
[vc_row][vc_column][vc_separator][/vc_column][/vc_row][vc_row][vc_column][vc_column_text]
DOW JONES INDUSTRIALS
[/vc_column_text][/vc_column][/vc_row][vc_row][vc_column][vc_separator][/vc_column][/vc_row][vc_row][vc_column width=”2/3″][vc_custom_heading text=”30 min” use_theme_fonts=”yes”][vc_column_text] [/vc_column_text][/vc_column][vc_column width=”1/3″][vc_custom_heading text=”4 Hours” use_theme_fonts=”yes”][vc_column_text]
 [/vc_column_text][vc_custom_heading text=”Daily” use_theme_fonts=”yes”][vc_column_text]
 [/vc_column_text][/vc_column][/vc_row][vc_row][vc_column][vc_column_text]My Bias: market topping process ongoing
Wave Structure: Impulsive 5 wave structure, possibly topping in an all time high.
Long term wave count: Topping in wave (5)
Important risk events: USD: JOLTS Job Openings.
There is a chance that todays rally in stocks completed wave ‘3’ of that ending diagonal that I have been speaking about.
The declines this evening again look corrective in a possible wave ‘4’ blue.
So the outlook for the rest of the week is for a run up into 22200 in wave ‘5’ blue.
This rally is now looking pretty shaky.
The momentum indicators on the 4hr chart have diverged downwards off extreme highs for the last week.
Also on the 4hr chart,
Wave (v) is fast approaching equality with wave (i) grey.
That will happen at 22190.
The signals are lining up on the bearish side right now.
For tomorrow;
Support at 21980 should still hold.
watch for the price to again make a new high as wave ‘5’ blue starts.
The minimum target is now 21190.[/vc_column_text][/vc_column][/vc_row]
[/_s2If]
[_s2If current_user_can(access_s2member_ccap_gold)]
[vc_row][vc_column][vc_separator][/vc_column][/vc_row][vc_row][vc_column][vc_column_text]
GOLD
[/vc_column_text][/vc_column][/vc_row][vc_row][vc_column][vc_separator][/vc_column][/vc_row][vc_row][vc_column width=”2/3″][vc_custom_heading text=”30 min” use_theme_fonts=”yes”][vc_column_text] [/vc_column_text][/vc_column][vc_column width=”1/3″][vc_custom_heading text=”4 Hours” use_theme_fonts=”yes”][vc_column_text]
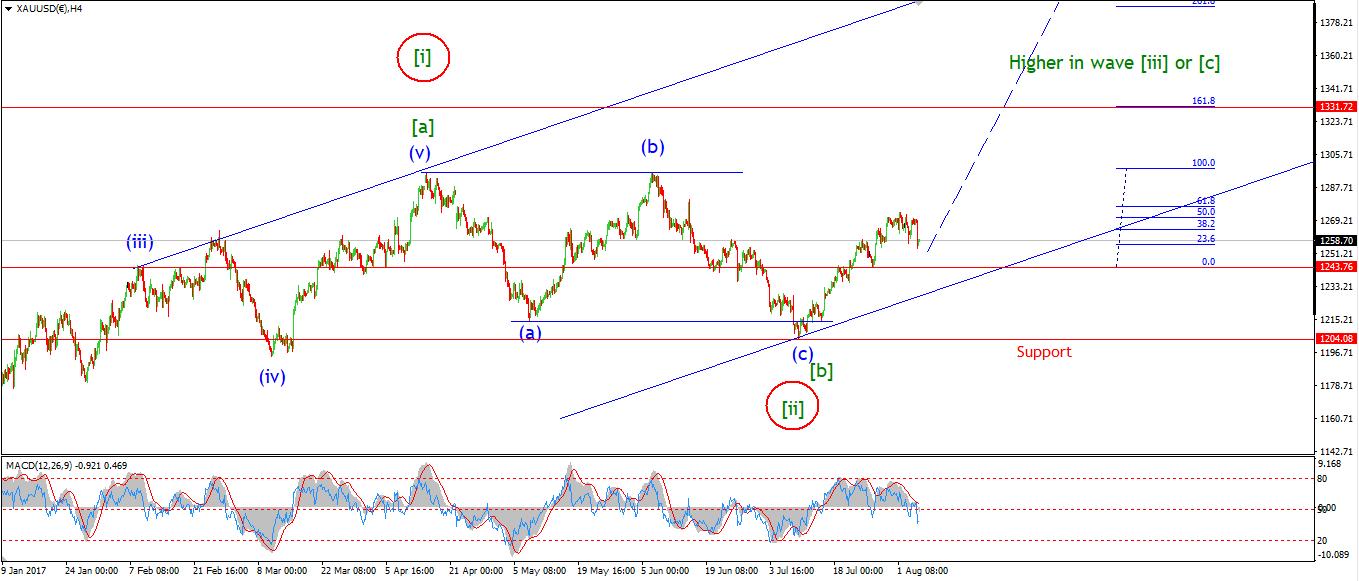 [/vc_column_text][vc_custom_heading text=”Daily” use_theme_fonts=”yes”][vc_column_text]
 [/vc_column_text][/vc_column][/vc_row][vc_row][vc_column][vc_column_text]My Bias: Long towards 1550
Wave Structure: ZigZag correction to the upside.
Long term wave count: Topping in wave (B) at 1550
Important risk events: USD: JOLTS Job Openings.
The action off Fridays low has been flat as a pancake!
This leads me to believe that the decline in wave ‘2’ pink is not quite complete.
Another decline into the lower trend line would happen at about 1250.
As I explained in this weeks video,
Both short term wave counts are very bullish,
But the alternate wave count shown allows for a decline below 1243 to complete wave (ii) blue.
This is a bullish setup at a higher degree of trend,
And the following rally in wave (iii) should be powerful.
For tomorrow;
I still await the completion of wave ‘2’ pink.
Watch for a decline into the lower trendline once more to do just that.
If the price rallies off that lower trendline, it will signal that wave ‘3’ pink has begun.[/vc_column_text][/vc_column][/vc_row]
[/_s2If][