
[_s2If current_user_can(access_s2member_ccap_eurusd)]
[vc_row][vc_column][vc_separator border_width=”5″][/vc_column][/vc_row][vc_row][vc_column][vc_column_text]
EURUSD
[/vc_column_text][/vc_column][/vc_row][vc_row][vc_column][vc_separator border_width=”5″][/vc_column][/vc_row][vc_row][vc_column width=”2/3″][vc_custom_heading text=”30 min” use_theme_fonts=”yes”][vc_column_text] [/vc_column_text][/vc_column][vc_column width=”1/3″][vc_custom_heading text=”4 Hours” use_theme_fonts=”yes”][vc_column_text]
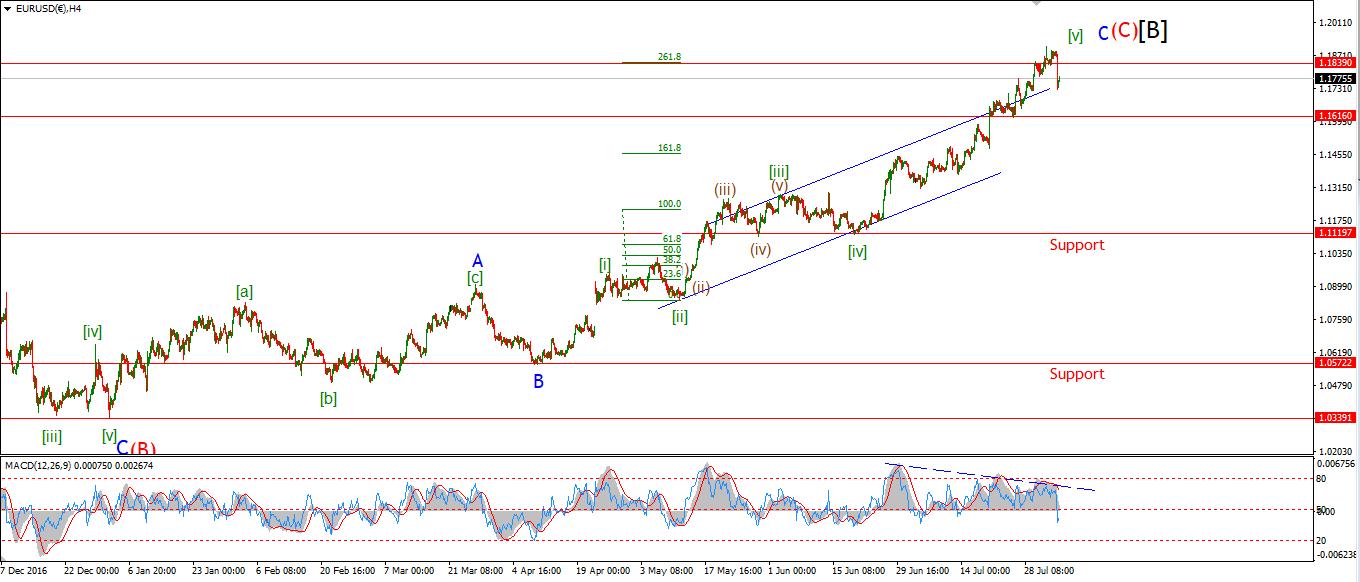 [/vc_column_text][vc_custom_heading text=”Daily” use_theme_fonts=”yes”][vc_column_text]
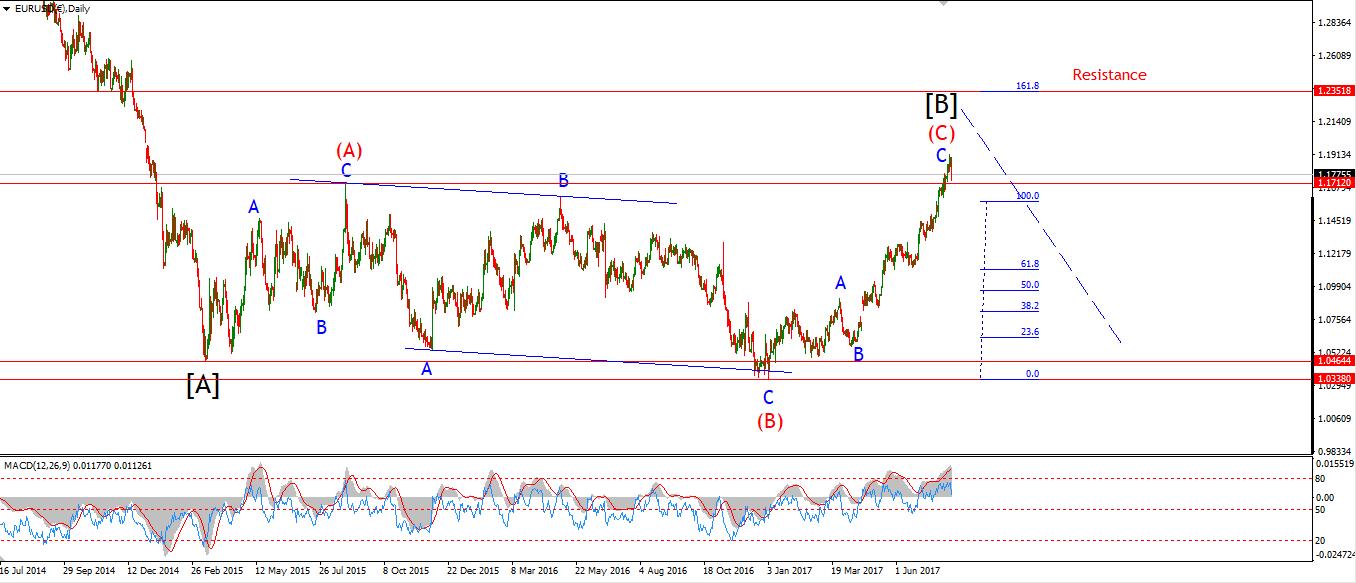 [/vc_column_text][/vc_column][/vc_row][vc_row][vc_column][vc_column_text]My Bias: long term bearish
Wave Structure: downward impulse wave
Long term wave count: lower in wave (3) red
Important risk events: EUR: N/A. USD: Mortgage Delinquencies, FOMC Member Kashkari Speaks.
Good evening to one and all!
In general yesterdays update was orientated towards a turning point for the USD,
Todays market action has followed that theme.
EURUSD continued its slide in a very impulsive manner today,
Down 150 points at the low of the day.
I have labelled this decline as the beginning of a five wave structure in wave ‘i’ pink.
We will see how this develops in the early trade next week,
But it is a good start, if the top is forming.
For Monday;
Watch for a correction higher in a possible wave ‘4’ grey,
This should complete below 1.1830,
which is the low of wave ‘1’ grey.
From this point on;
I will look for the completion of wave ‘i’ pink
followed by a corrective rally in wave ‘ii’ pink.
And that will form a clear Elliott wave sell signal that this market is turning back down into the long term trend
one day at a time though![/vc_column_text][/vc_column][/vc_row]
[/_s2If]
[_s2If current_user_can(access_s2member_ccap_gbpusd)]
[vc_row][vc_column][vc_separator border_width=”5″][/vc_column][/vc_row][vc_row][vc_column][vc_column_text]
GBPUSD
[/vc_column_text][/vc_column][/vc_row][vc_row][vc_column][vc_separator border_width=”5″][/vc_column][/vc_row][vc_row][vc_column width=”2/3″][vc_custom_heading text=”30 min” use_theme_fonts=”yes”][vc_column_text] [/vc_column_text][/vc_column][vc_column width=”1/3″][vc_custom_heading text=”4 Hours” use_theme_fonts=”yes”][vc_column_text]
 [/vc_column_text][vc_custom_heading text=”Daily” use_theme_fonts=”yes”][vc_column_text]
 [/vc_column_text][/vc_column][/vc_row][vc_row][vc_column][vc_column_text]My Bias: short below parity in wave (5).
Wave Structure: continuing impulsive structure to the downside in wave (5)
Long term wave count: decline in wave (5) blue, below parity
Important risk events: GBP: Halifax HPI m/m. USD: Mortgage Delinquencies, FOMC Member Kashkari Speaks.
Cable has a bloody nose after todays trade.
The pair is down 240 points off the recent high, wiping out 2 weeks of gains.
The trend channel in wave ‘2’ grey served well today.
The price rose to a high of 1.3164, and then sold off dramatically in a possible wave ‘3’.
The larger structure requires a correction in wave ‘iv’ grey,
And then a decline into wave ‘5’ to complete wave ‘i’ pink.
It is also possible that a series of 1,2 waves are forming off the recent high,
I have shown that count circled in red.
So;
The focus Monday,
is for a corrective rise in a possible wave ‘4’.
Wave ‘4’ should complete below the low of wave ‘1’ grey at 1.3112.[/vc_column_text][/vc_column][/vc_row]
[/_s2If]
[_s2If current_user_can(access_s2member_ccap_usdjpy)]
[vc_row][vc_column][vc_separator border_width=”5″][/vc_column][/vc_row][vc_row][vc_column][vc_column_text]
USDJPY
[/vc_column_text][/vc_column][/vc_row][vc_row][vc_column][vc_separator border_width=”5″][/vc_column][/vc_row][vc_row][vc_column width=”2/3″][vc_custom_heading text=”30 min” use_theme_fonts=”yes”][vc_column_text] [/vc_column_text][/vc_column][vc_column width=”1/3″][vc_custom_heading text=”4 Hours” use_theme_fonts=”yes”][vc_column_text]
 [/vc_column_text][vc_custom_heading text=”Daily” use_theme_fonts=”yes”][vc_column_text]
 [/vc_column_text][/vc_column][/vc_row][vc_row][vc_column][vc_column_text]My Bias: LONG
Wave Structure: rally in wave [C]
Long term wave count: wave [C] is underway, upside to above 136.00
Important risk events: JPY: N/A. USD: Mortgage Delinquencies, FOMC Member Kashkari Speaks.
USDJPY confirmed a bullish dollar stance across the three markets.
Last nights new count called for a decline into 109.70 and a turn up form there.
The low of the days reached 109.84 and the then rebounded to a high of 111.04.
The price action looks encouraging as the beginnings of a turn up.
I have labelled the rise as a possible wave ‘1’ pink.
That structure does not look fully complete at the moment,
So another push above 111.04 will create a clear impulsive structure.
At that point a minor correction in wave ‘2’ pink will create a bullish Elliott wave signal
for a rally in wave ‘3’ of ‘i’ of (iii) of [iii].
If you can chew on that!!
For next week;
The outlook is for a higher low to form above 109.84,
And a rally back into the longer term trend.[/vc_column_text][/vc_column][/vc_row]
[/_s2If]
[_s2If current_user_can(access_s2member_ccap_dow_jones)]
[vc_row][vc_column][vc_separator][/vc_column][/vc_row][vc_row][vc_column][vc_column_text]
DOW JONES INDUSTRIALS
[/vc_column_text][/vc_column][/vc_row][vc_row][vc_column][vc_separator][/vc_column][/vc_row][vc_row][vc_column width=”2/3″][vc_custom_heading text=”30 min” use_theme_fonts=”yes”][vc_column_text] [/vc_column_text][/vc_column][vc_column width=”1/3″][vc_custom_heading text=”4 Hours” use_theme_fonts=”yes”][vc_column_text]
 [/vc_column_text][vc_custom_heading text=”Daily” use_theme_fonts=”yes”][vc_column_text]
 [/vc_column_text][/vc_column][/vc_row][vc_row][vc_column][vc_column_text]My Bias: market topping process ongoing
Wave Structure: Impulsive 5 wave structure, possibly topping in an all time high.
Long term wave count: Topping in wave (5)
Important risk events: USD: Mortgage Delinquencies, FOMC Member Kashkari Speaks.
Another day another new all time high for stocks.
Seems like the future cash flows of these companies is set to grow forever!
Even though;
The ratio of the ‘Market cap of non-financial stocks’ to ‘Gross value added’ is now above 150%,
This is the second higest level ever recorded.
And,
this requires at least a 60% decline
just to bring the ratio back to normal long run levels!!!!
So, everything is rosy in the garden folks, nothing to worry about.
back to the wave count.
The price did rise again today but without the impulsive form.
The rise has a very narrow range and overlapping structure.
With this price action,
Wave ‘v’ pink may be tracing out an ending diagonal formation.
Which would involve five waves of three,
In a narrowing channel to complete at the target,
As shown on the chart.
This is of course an idealized model,
So we will see how it works out.
For next week,
The outlook is for a continued rise into 22200.
21980 should hold for this short term count to remain valid.[/vc_column_text][/vc_column][/vc_row]
[/_s2If]
[_s2If current_user_can(access_s2member_ccap_gold)]
[vc_row][vc_column][vc_separator][/vc_column][/vc_row][vc_row][vc_column][vc_column_text]
GOLD
[/vc_column_text][/vc_column][/vc_row][vc_row][vc_column][vc_separator][/vc_column][/vc_row][vc_row][vc_column width=”2/3″][vc_custom_heading text=”30 min” use_theme_fonts=”yes”][vc_column_text] [/vc_column_text][/vc_column][vc_column width=”1/3″][vc_custom_heading text=”4 Hours” use_theme_fonts=”yes”][vc_column_text]
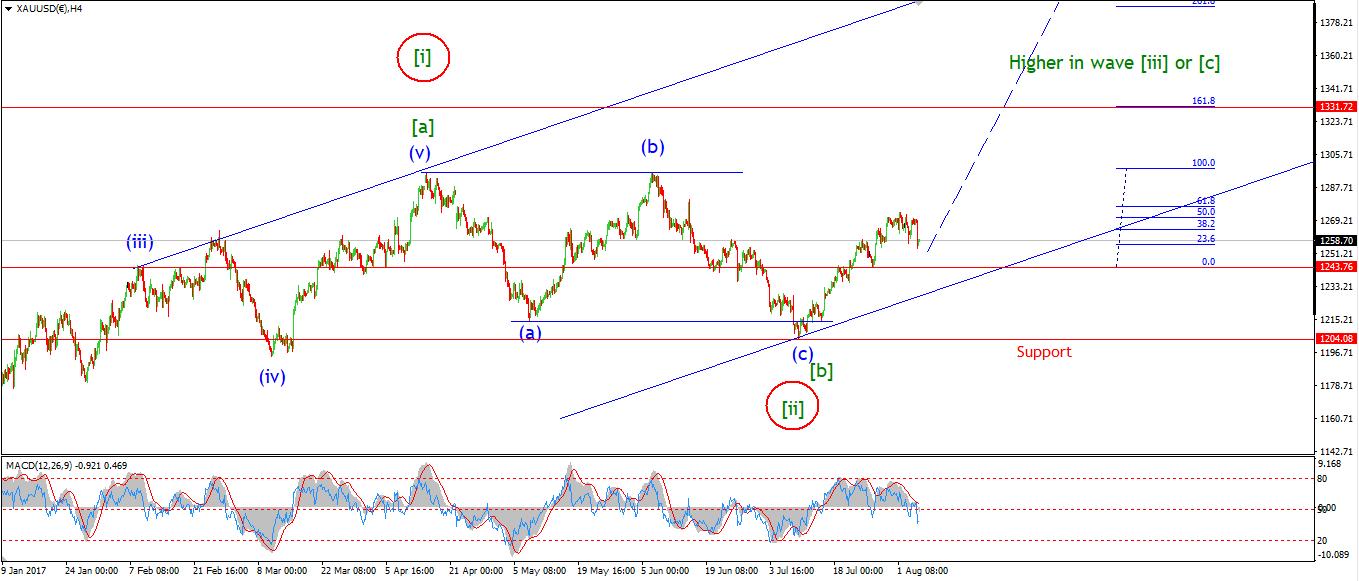 [/vc_column_text][vc_custom_heading text=”Daily” use_theme_fonts=”yes”][vc_column_text]
 [/vc_column_text][/vc_column][/vc_row][vc_row][vc_column][vc_column_text]My Bias: Long towards 1550
Wave Structure: ZigZag correction to the upside.
Long term wave count: Topping in wave (B) at 1550
Important risk events: USD: Mortgage Delinquencies, FOMC Member Kashkari Speaks.
GOLD dropped again today to a lower high in wave ‘2’ at 1254.
Wave ‘2’ pink has extended to a more complex structure
And now looks to have completed a flat correction,
with a 3,3,5 internal structure.
The price must remain above 1243.58 for this interpretation to remain valid.
The alternate wave count has been revised slightly
It now shows a rise in wave (i) blue into the recent high,
With the possibility for a decline in wave (ii) blue still a threat.
This is a valid interpretation until the price accelerates higher in either wave ‘iii’ brown, or wave (iii) blue.
So;
Mondays trade should sort out which wave count is the best interpretation to go with from here.
An immediate rally above 1274 will add weight to the operating wave count.
Either way,
Both interpretations are very bullish for the rest of the year at least.[/vc_column_text][/vc_column][/vc_row]
[/_s2If]