
[_s2If current_user_can(access_s2member_ccap_eurusd)]
[vc_row][vc_column][vc_separator border_width=”5″][/vc_column][/vc_row][vc_row][vc_column][vc_column_text]
EURUSD
[/vc_column_text][/vc_column][/vc_row][vc_row][vc_column][vc_separator border_width=”5″][/vc_column][/vc_row][vc_row][vc_column width=”2/3″][vc_custom_heading text=”30 min” use_theme_fonts=”yes”][vc_column_text] [/vc_column_text][/vc_column][vc_column width=”1/3″][vc_custom_heading text=”4 Hours” use_theme_fonts=”yes”][vc_column_text]
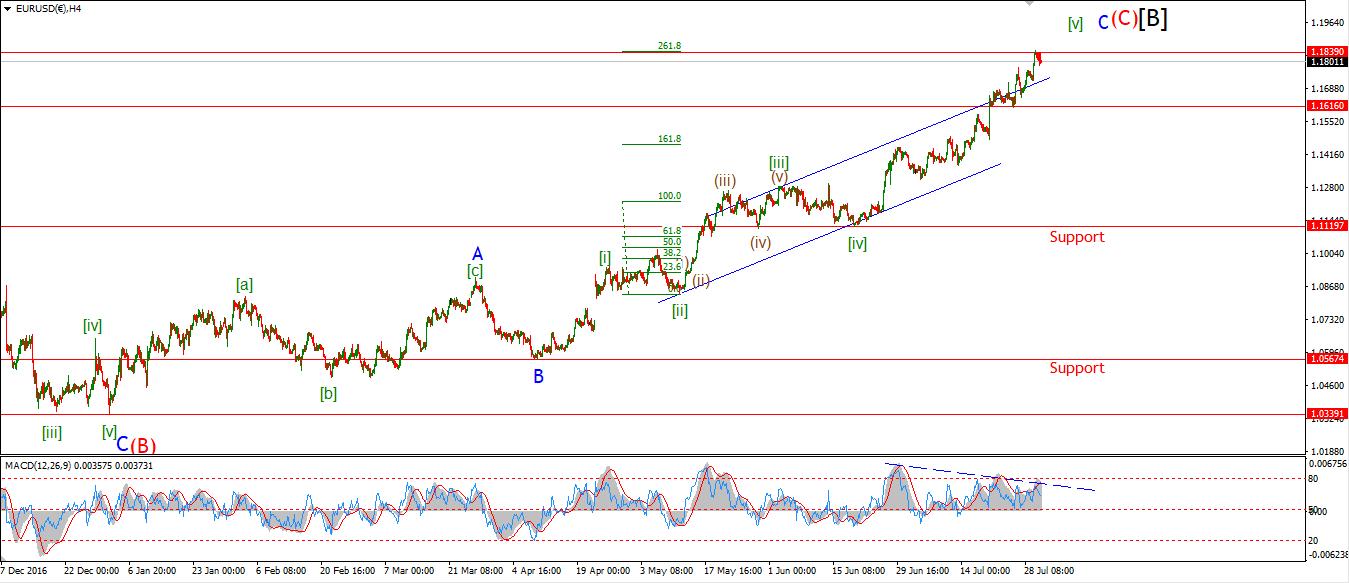 [/vc_column_text][vc_custom_heading text=”Daily” use_theme_fonts=”yes”][vc_column_text]
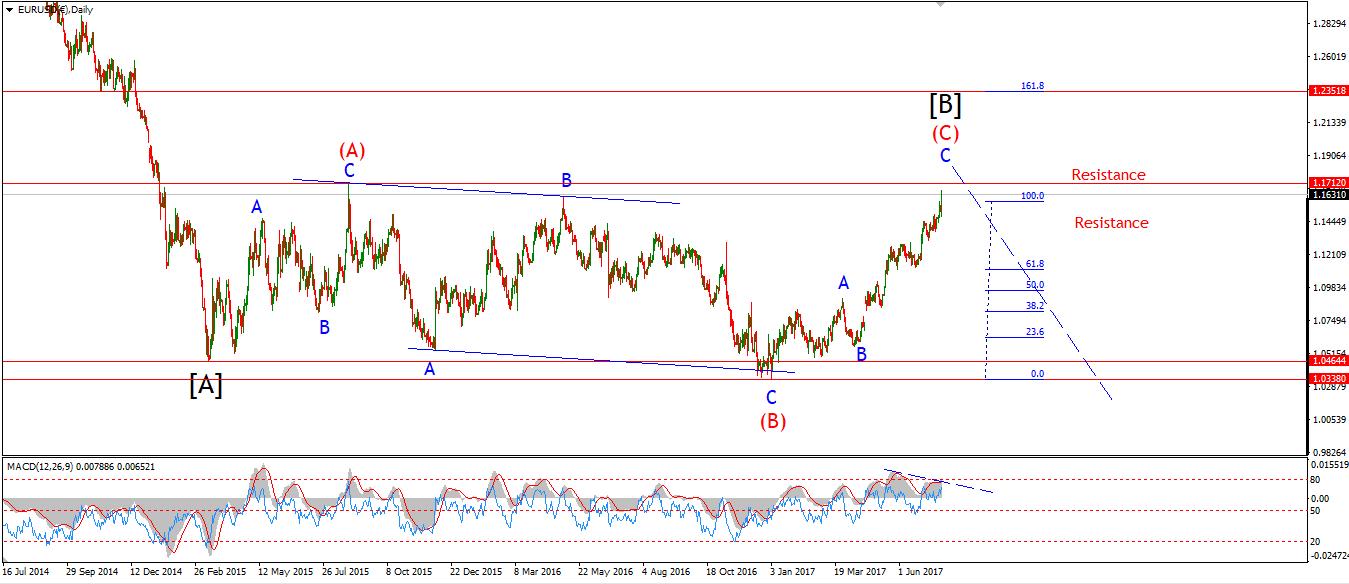 [/vc_column_text][/vc_column][/vc_row][vc_row][vc_column][vc_column_text]My Bias: long term bearish
Wave Structure: downward impulse wave
Long term wave count: lower in wave (3) red
Important risk events: EUR: N/A. USD: Unemployment Claims, ISM Non-Manufacturing PMI, Factory Orders m/m.
Good evening everyone.
I hope you all had a great day!
EURUSD rallied to the upper trendline today, as expected.
Although it is uncertain if the structure in wave ‘v’ pink is complete at todays high.
The current preferred count has been fulfilled at todays high.
However,
I have shown an alternate wave count circled in red,
This views todays high as the top of wave ‘3’ grey, with another high left to complete the larger wave structure.
Both interpretations are equally viable from here.
For tomorrow;
If the price declines in an impulsive fashion below 1.1776,
That will add weight to the preferred count.
If the declines are corrective in nature,
Then we can switch to the alternate wave count.[/vc_column_text][/vc_column][/vc_row]
[/_s2If]
[_s2If current_user_can(access_s2member_ccap_gbpusd)]
[vc_row][vc_column][vc_separator border_width=”5″][/vc_column][/vc_row][vc_row][vc_column][vc_column_text]
GBPUSD
[/vc_column_text][/vc_column][/vc_row][vc_row][vc_column][vc_separator border_width=”5″][/vc_column][/vc_row][vc_row][vc_column width=”2/3″][vc_custom_heading text=”30 min” use_theme_fonts=”yes”][vc_column_text] [/vc_column_text][/vc_column][vc_column width=”1/3″][vc_custom_heading text=”4 Hours” use_theme_fonts=”yes”][vc_column_text]
 [/vc_column_text][vc_custom_heading text=”Daily” use_theme_fonts=”yes”][vc_column_text]
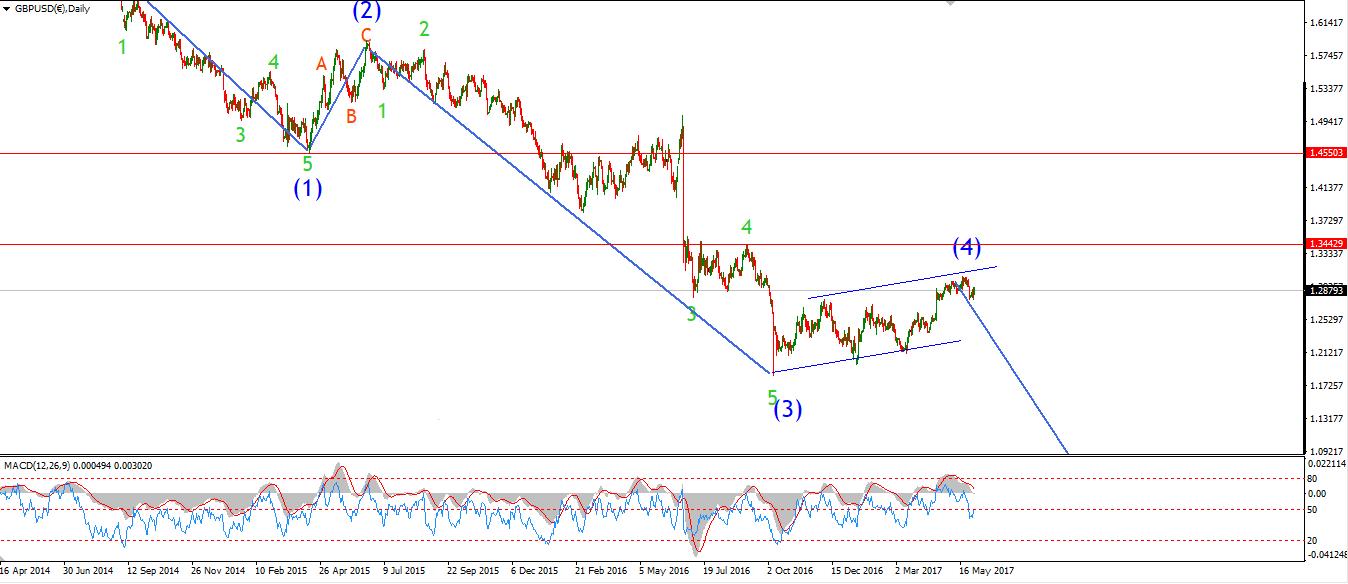 [/vc_column_text][/vc_column][/vc_row][vc_row][vc_column][vc_column_text]My Bias: short below parity in wave (5).
Wave Structure: continuing impulsive structure to the downside in wave (5)
Long term wave count: decline in wave (5) blue, below parity
Important risk events: GBP: BOE Inflation Report, Monetary Policy Summary, Official Bank Rate, BOE Gov Carney Speaks. USD: Unemployment Claims, ISM Non-Manufacturing PMI, Factory Orders m/m.
Cable hit the target at 1.3250 today, this creates a slightly higher high for a possible wave ‘c’ pink.
Todays rise does not look complete just yet,
There is a real possibility that wave the rally will meet the upper trendline of the trend channel before completing.
That could happen at about 1.3310, so I will wait and see on this front.
The 4hr RSI has remained below the declining trendline,
Which tells me that bearish divergence continues to grow ever larger.
For tomorrow;
Watch for a short rally to meet the trendline.
Also on the lower end,
1.3124 forms the immediate support,
any decline below that point will indicate that a top could be forming.[/vc_column_text][/vc_column][/vc_row]
[/_s2If]
[_s2If current_user_can(access_s2member_ccap_usdjpy)]
[vc_row][vc_column][vc_separator border_width=”5″][/vc_column][/vc_row][vc_row][vc_column][vc_column_text]
USDJPY
[/vc_column_text][/vc_column][/vc_row][vc_row][vc_column][vc_separator border_width=”5″][/vc_column][/vc_row][vc_row][vc_column width=”2/3″][vc_custom_heading text=”30 min” use_theme_fonts=”yes”][vc_column_text] [/vc_column_text][/vc_column][vc_column width=”1/3″][vc_custom_heading text=”4 Hours” use_theme_fonts=”yes”][vc_column_text]
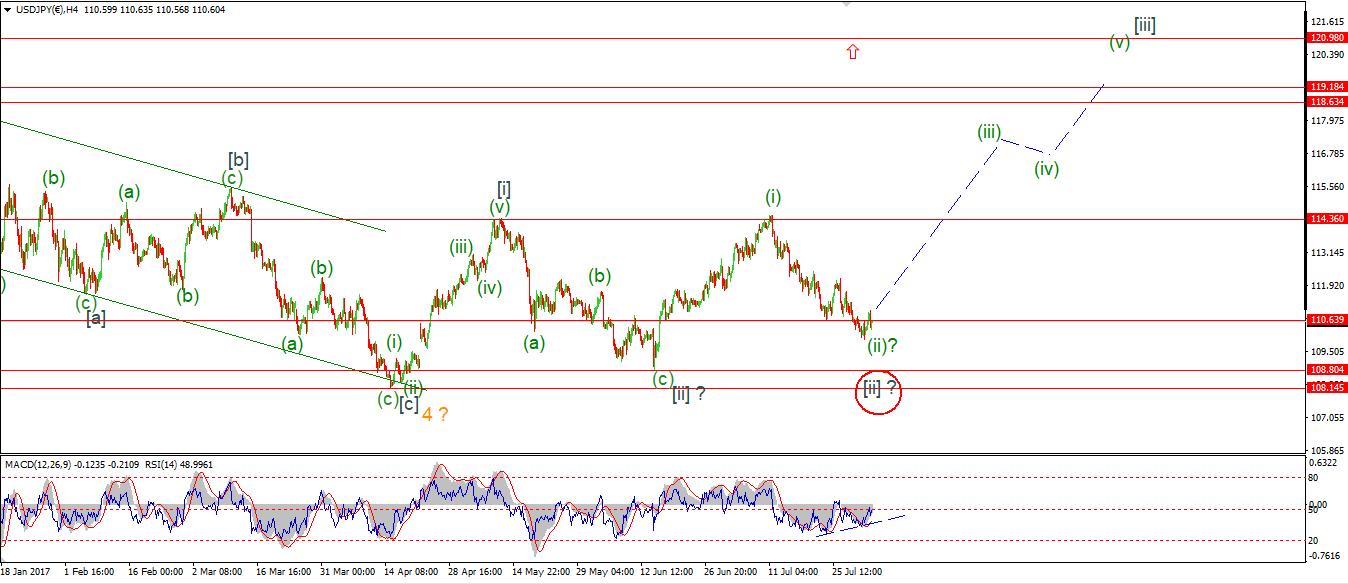 [/vc_column_text][vc_custom_heading text=”Daily” use_theme_fonts=”yes”][vc_column_text]
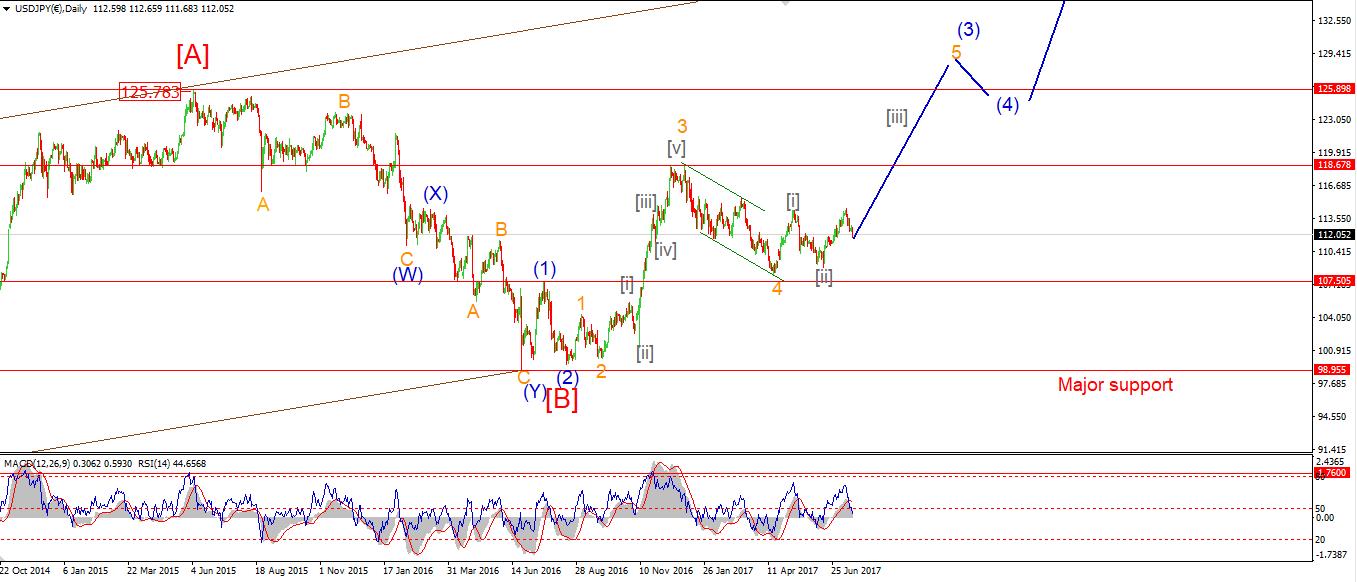 [/vc_column_text][/vc_column][/vc_row][vc_row][vc_column][vc_column_text]My Bias: LONG
Wave Structure: rally in wave [C]
Long term wave count: wave [C] is underway, upside to above 136.00
Important risk events: JPY: N/A. USD: Unemployment Claims, ISM Non-Manufacturing PMI, Factory Orders m/m.
USDJPY moved higher today in a possible turning point wave (ii) green.
The low of the day was at 109.91,
So this low must hold in order to turn bullish again.
If we see a five wave structure develop off that low which breaks 112.43,
The probability will be much higher that a turn higher is in place at that point.
The 4hr RSI pushed to the centreline today, whch is a positive sign also.
For tomorrow;
109.91 must hold from here.[/vc_column_text][/vc_column][/vc_row]
[/_s2If]
[_s2If current_user_can(access_s2member_ccap_dow_jones)]
[vc_row][vc_column][vc_separator][/vc_column][/vc_row][vc_row][vc_column][vc_column_text]
DOW JONES INDUSTRIALS
[/vc_column_text][/vc_column][/vc_row][vc_row][vc_column][vc_separator][/vc_column][/vc_row][vc_row][vc_column width=”2/3″][vc_custom_heading text=”30 min” use_theme_fonts=”yes”][vc_column_text] [/vc_column_text][/vc_column][vc_column width=”1/3″][vc_custom_heading text=”4 Hours” use_theme_fonts=”yes”][vc_column_text]
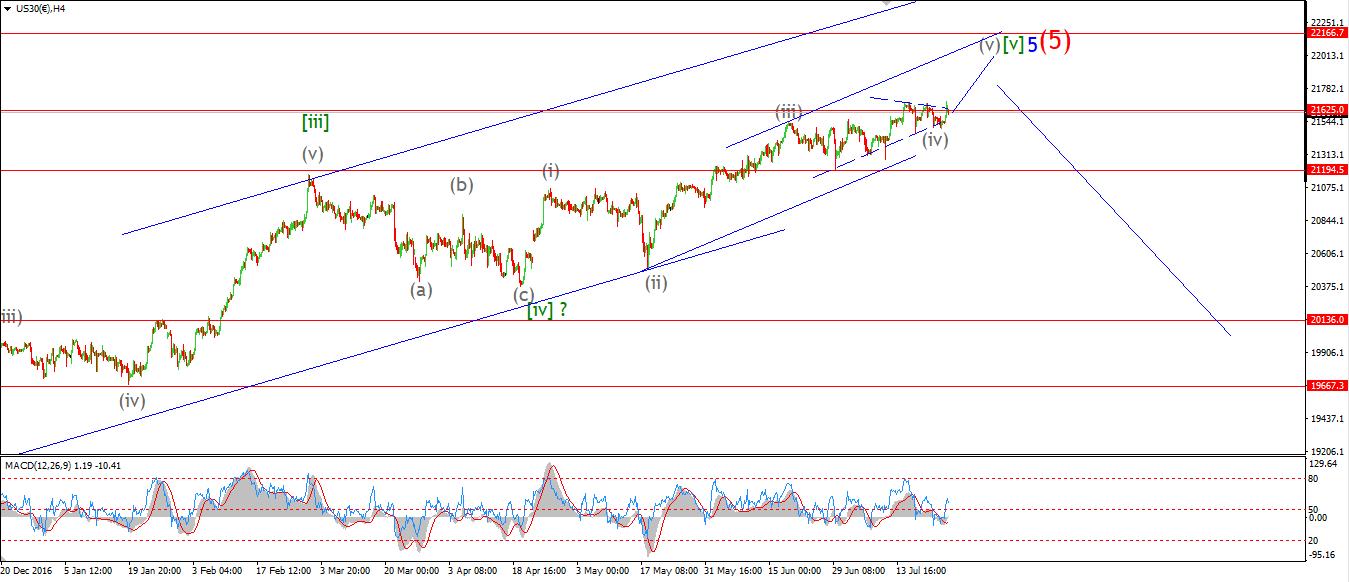 [/vc_column_text][vc_custom_heading text=”Daily” use_theme_fonts=”yes”][vc_column_text]
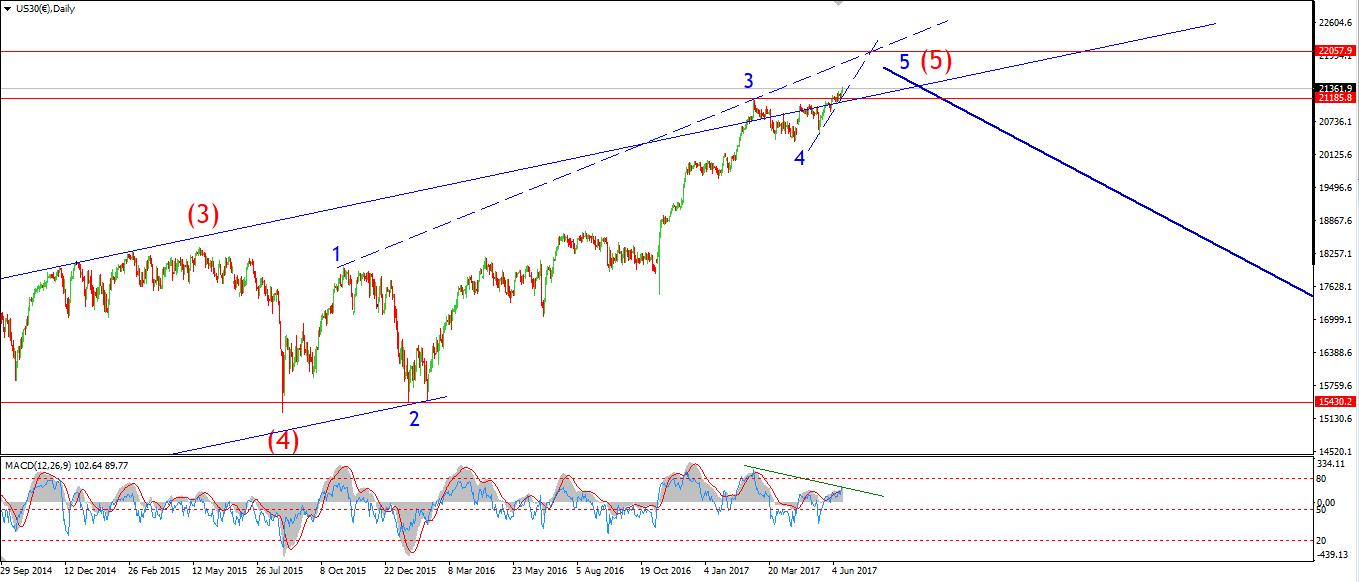 [/vc_column_text][/vc_column][/vc_row][vc_row][vc_column][vc_column_text]My Bias: market topping process ongoing
Wave Structure: Impulsive 5 wave structure, possibly topping in an all time high.
Long term wave count: Topping in wave (5)
Important risk events: USD: Unemployment Claims, ISM Non-Manufacturing PMI, Factory Orders m/m.
The DOW cash market broke the 22000 level today but the day has ended flat.
It now looks more likely that wave ‘iv’ pink is complete.
I have labelled the rally and decline today as waves ‘1’ and ‘2’ blue,
A rally in wave ‘3’ blue is now expected to carry the price up towards that upper trend channel line.
Both the MACD and RSI have now turned down from extreme levels and this divergence should grow over the coming days.
So;
For the rest of this week I will be watching this push up towards 22200,
In a possible historic top to remember.[/vc_column_text][/vc_column][/vc_row]
[/_s2If]
[_s2If current_user_can(access_s2member_ccap_gold)]
[vc_row][vc_column][vc_separator][/vc_column][/vc_row][vc_row][vc_column][vc_column_text]
GOLD
[/vc_column_text][/vc_column][/vc_row][vc_row][vc_column][vc_separator][/vc_column][/vc_row][vc_row][vc_column width=”2/3″][vc_custom_heading text=”30 min” use_theme_fonts=”yes”][vc_column_text] [/vc_column_text][/vc_column][vc_column width=”1/3″][vc_custom_heading text=”4 Hours” use_theme_fonts=”yes”][vc_column_text]
 [/vc_column_text][vc_custom_heading text=”Daily” use_theme_fonts=”yes”][vc_column_text]
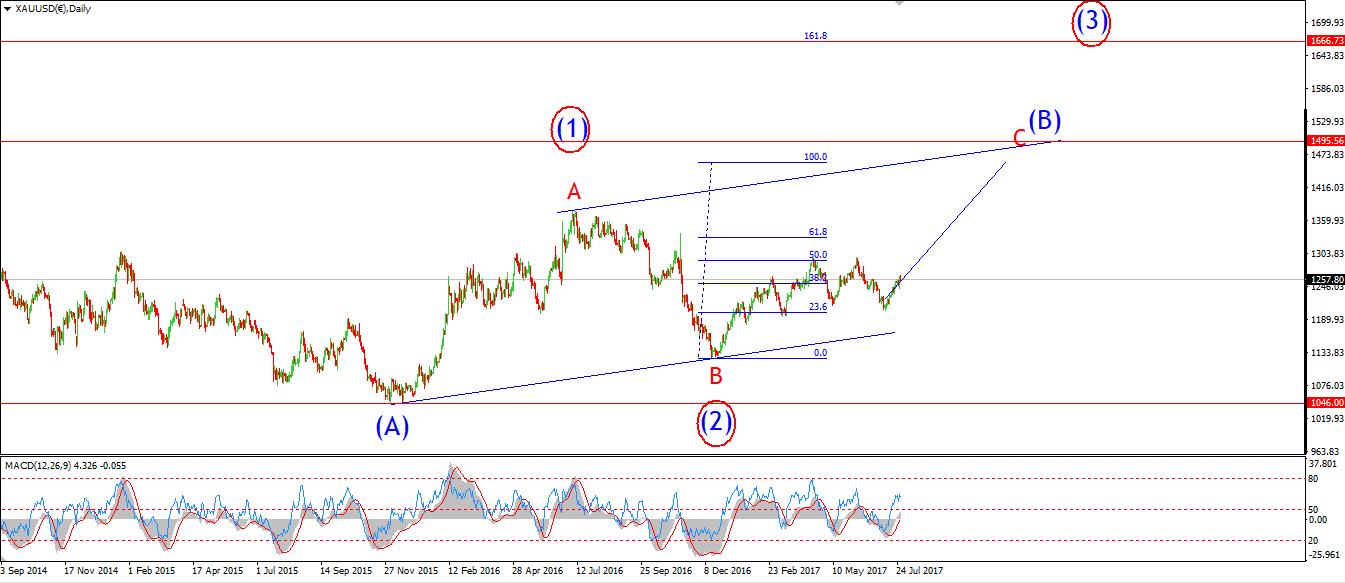 [/vc_column_text][/vc_column][/vc_row][vc_row][vc_column][vc_column_text]My Bias: Long towards 1550
Wave Structure: ZigZag correction to the upside.
Long term wave count: Topping in wave (B) at 1550
Important risk events: USD: Unemployment Claims, ISM Non-Manufacturing PMI, Factory Orders m/m.
The low of 1262 has held so far in wave ‘2’ pink.
Although there is a possibility that a more complex wave ‘2’ could be developing.
If 1262 holds,
Then the Fibonacci extension of wave ‘1’ pink,
projects a high for wave ‘3’ pink at 1306
as shown on the short term chart.
The short term action has still not ruled out the alternate wave count shown.
So that is another scenario to be aware of.
The wave count is still very bullish in general,
But we have not seen any acceleration phase yet,
Wave ‘iii’ brown could bring with it that long awaited acceleration.
For tomorrow;
Watch for a rise to the upper trend channel line which will confirm the current preferred count.[/vc_column_text][/vc_column][/vc_row]
[/_s2If]