
[vc_row][vc_column][vc_column_text]
GOLD flashing bullish signals again, USDJPY contracting triangle in play.
[/vc_column_text][/vc_column][/vc_row][vc_row][vc_column][vc_separator border_width=”5″][/vc_column][/vc_row][vc_row][vc_column][vc_column_text]
USDJPY
[/vc_column_text][/vc_column][/vc_row][vc_row][vc_column][vc_separator border_width=”5″][/vc_column][/vc_row][vc_row][vc_column width=”2/3″][vc_custom_heading text=”30 min” use_theme_fonts=”yes”][vc_column_text]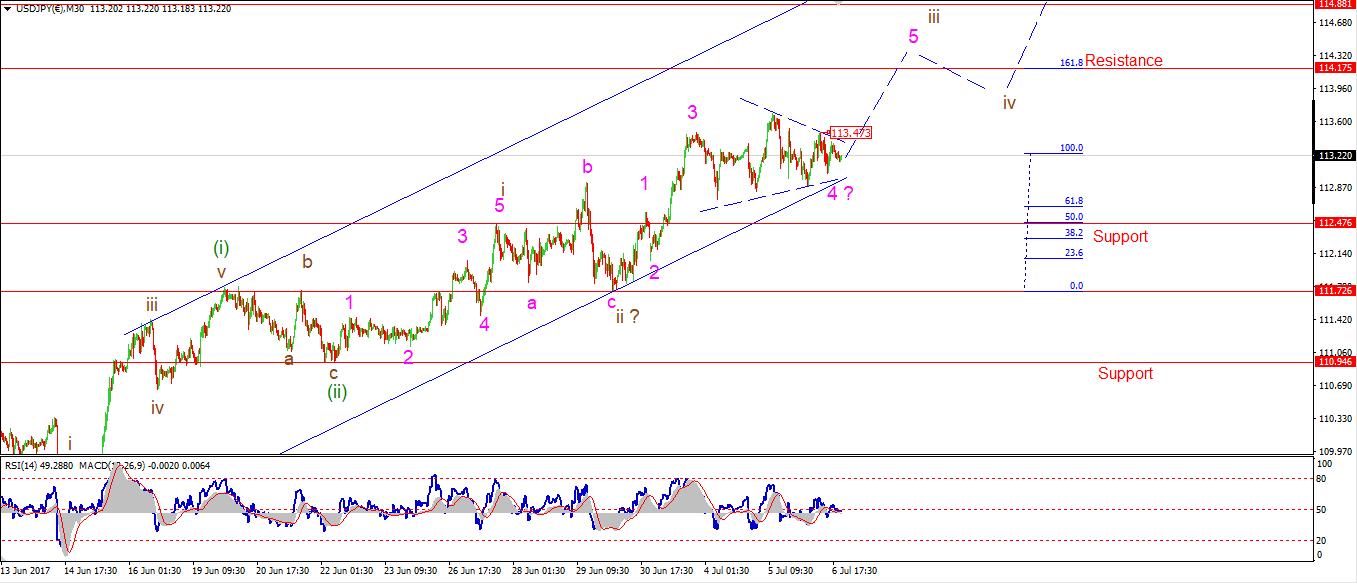 [/vc_column_text][/vc_column][vc_column width=”1/3″][vc_custom_heading text=”4 Hours” use_theme_fonts=”yes”][vc_column_text]
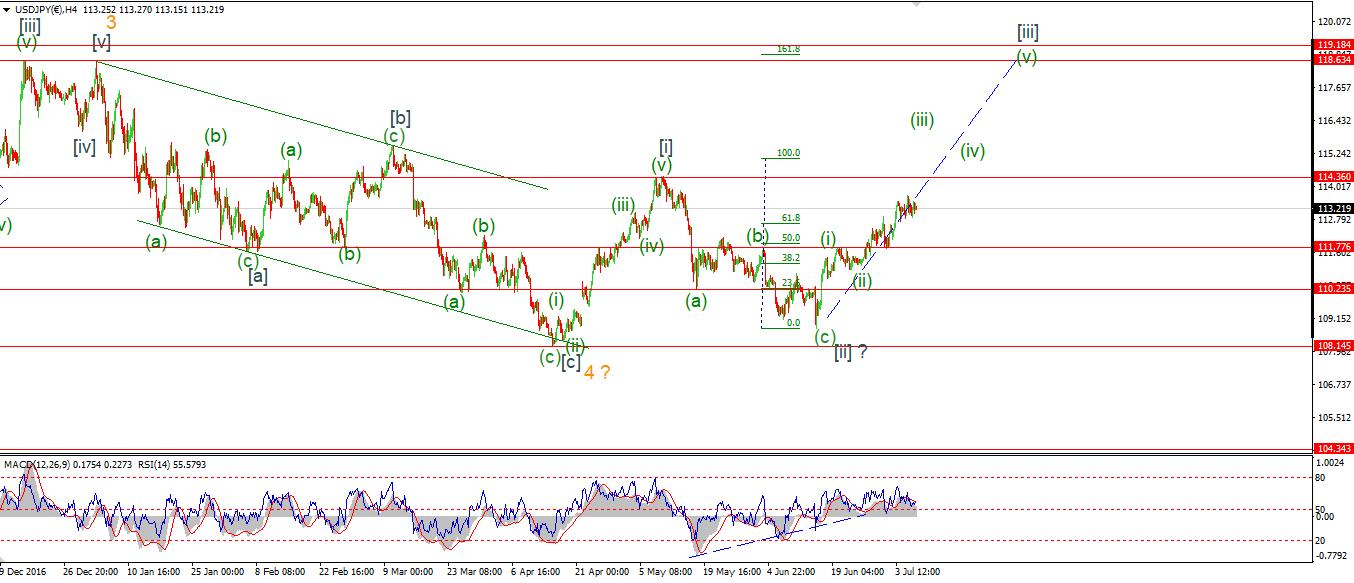 [/vc_column_text][vc_custom_heading text=”Daily” use_theme_fonts=”yes”][vc_column_text]
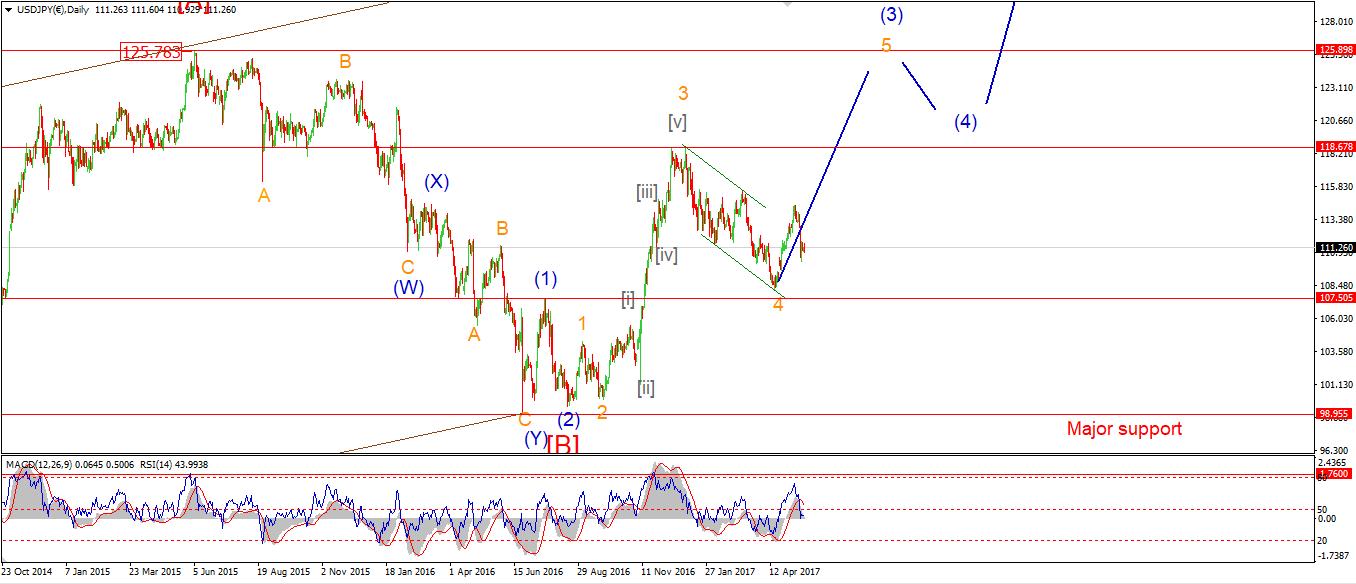 [/vc_column_text][/vc_column][/vc_row][vc_row][vc_column][vc_column_text]My Bias: LONG
Wave Structure: rally in wave [C]
Long term wave count: wave [C] is underway, upside to above 136.00
Important risk events: JPY: N/A. USD: Non-Farm Employment Change, Unemployment Rate, Fed Monetary Policy Report.
USDJPY has spent the week going sideways in a contracting range.
This price action is beginning to look like a contracting triangle,
Possibly within wave ‘4’ pink.
If this interpretation is correct, then we should get a sharp move up in wave ‘5’ pink very soon.
This triangle structure is very close to completion at the moment.
with possibly one more decline into the lower trend line to complete.
The larger wave count continues to call for more sharp rises to come.
For tomorrow,
watch for a break above above 1.1347 to indicate that wave ‘5’ is underway.[/vc_column_text][/vc_column][/vc_row][vc_row][vc_column][vc_separator][/vc_column][/vc_row][vc_row][vc_column][vc_column_text]
GOLD
[/vc_column_text][/vc_column][/vc_row][vc_row][vc_column][vc_separator][/vc_column][/vc_row][vc_row][vc_column width=”2/3″][vc_custom_heading text=”30 min” use_theme_fonts=”yes”][vc_column_text]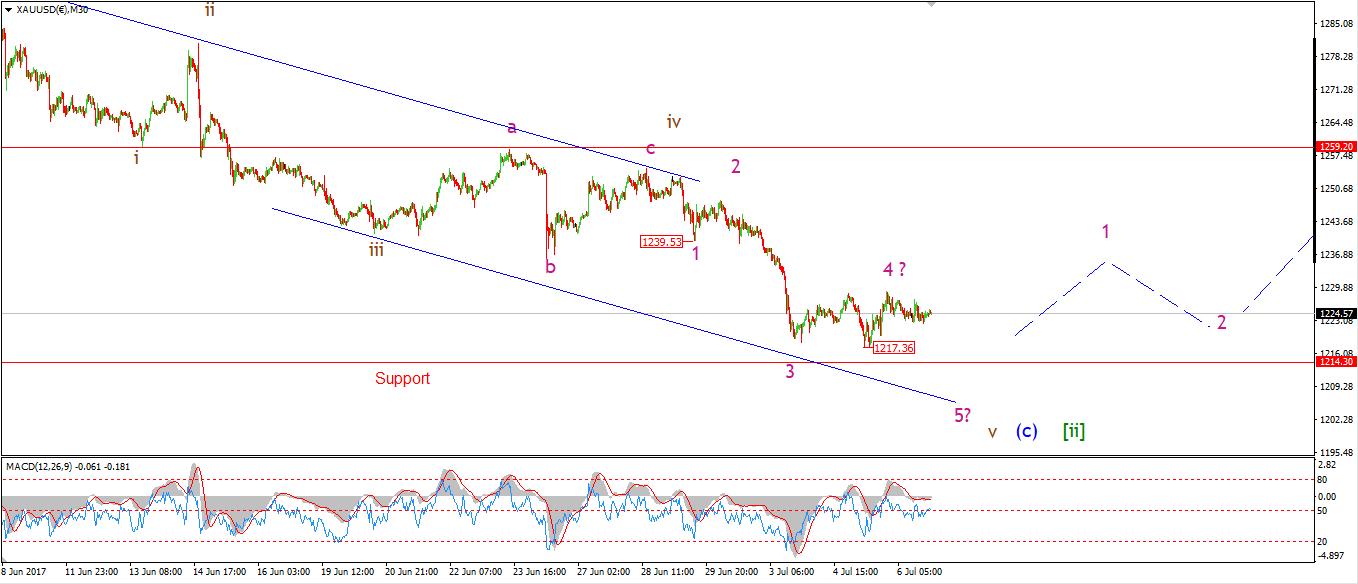 [/vc_column_text][/vc_column][vc_column width=”1/3″][vc_custom_heading text=”4 Hours” use_theme_fonts=”yes”][vc_column_text]
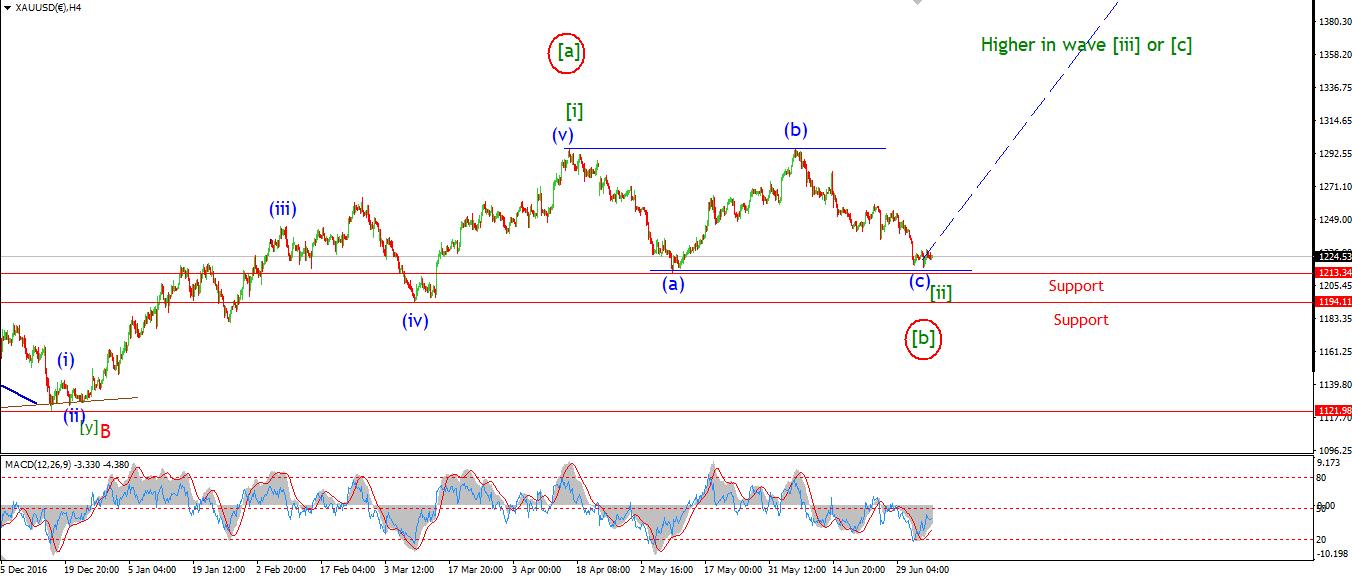 [/vc_column_text][vc_custom_heading text=”Daily” use_theme_fonts=”yes”][vc_column_text]
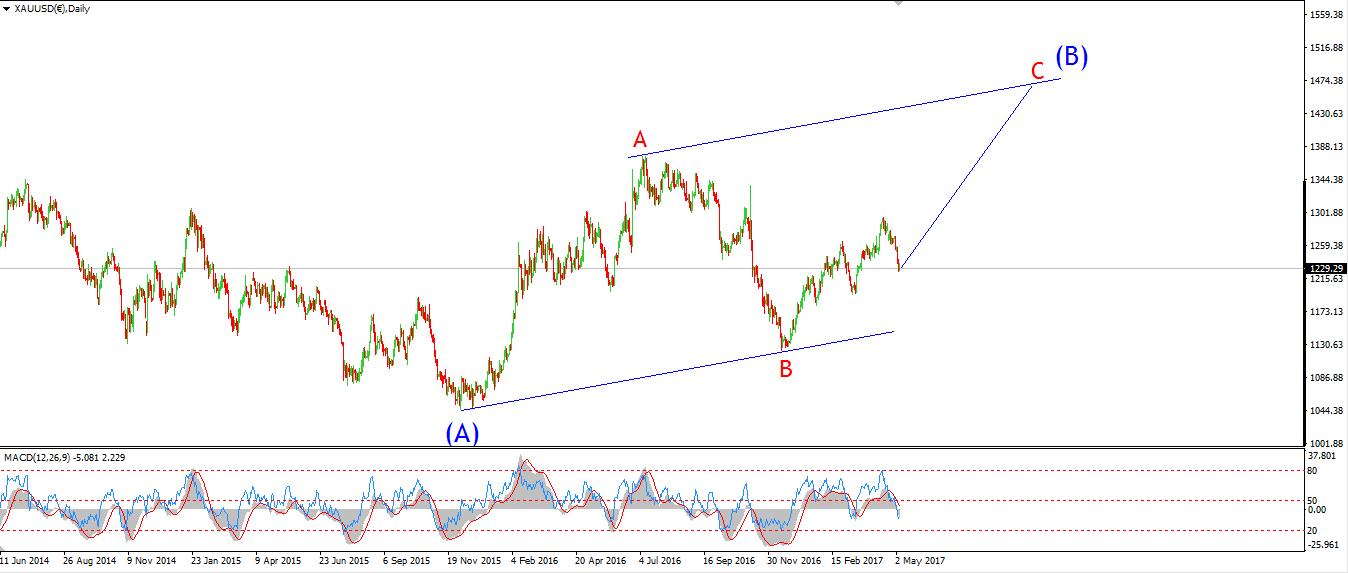 [/vc_column_text][/vc_column][/vc_row][vc_row][vc_column][vc_column_text]My Bias: Long towards 1550
Wave Structure: ZigZag correction to the upside.
Long term wave count: Topping in wave (B) at 1550
Important risk events: USD: Non-Farm Employment Change, Unemployment Rate, Fed Monetary Policy Report.
The price action in GOLD today looks suspiciously like we could possibly have a bottom in place.
It is still too early to say,
But the failure to break 1217.36 to create a new low, does raise my interest here.
I have not altered the labeling to a bullish stance just yet,
But we are very close to that point.
The 4hr chart sports a very bullish momentum setup,
Both RSI and MACD are on the verge of a momentum buy signal.
So watch out for that over the next few days.
The low at 1239.53 remains my initial focus for a bullish price action signal.
The current wave count still calls for one last drop into the trend line
below 1214.30 to complete the large flat correction.
From that point I am looking way higher in wave [iii] green.[/vc_column_text][/vc_column][/vc_row]