
[vc_row][vc_column][vc_column_text]
Weighing the probabilities for EURUSD GOLD and the DOW.
[/vc_column_text][/vc_column][/vc_row][vc_row][vc_column][vc_separator border_width=”5″][/vc_column][/vc_row][vc_row][vc_column][vc_column_text]
EURUSD
[/vc_column_text][/vc_column][/vc_row][vc_row][vc_column][vc_separator border_width=”5″][/vc_column][/vc_row][vc_row][vc_column width=”2/3″][vc_custom_heading text=”30 min” use_theme_fonts=”yes”][vc_column_text]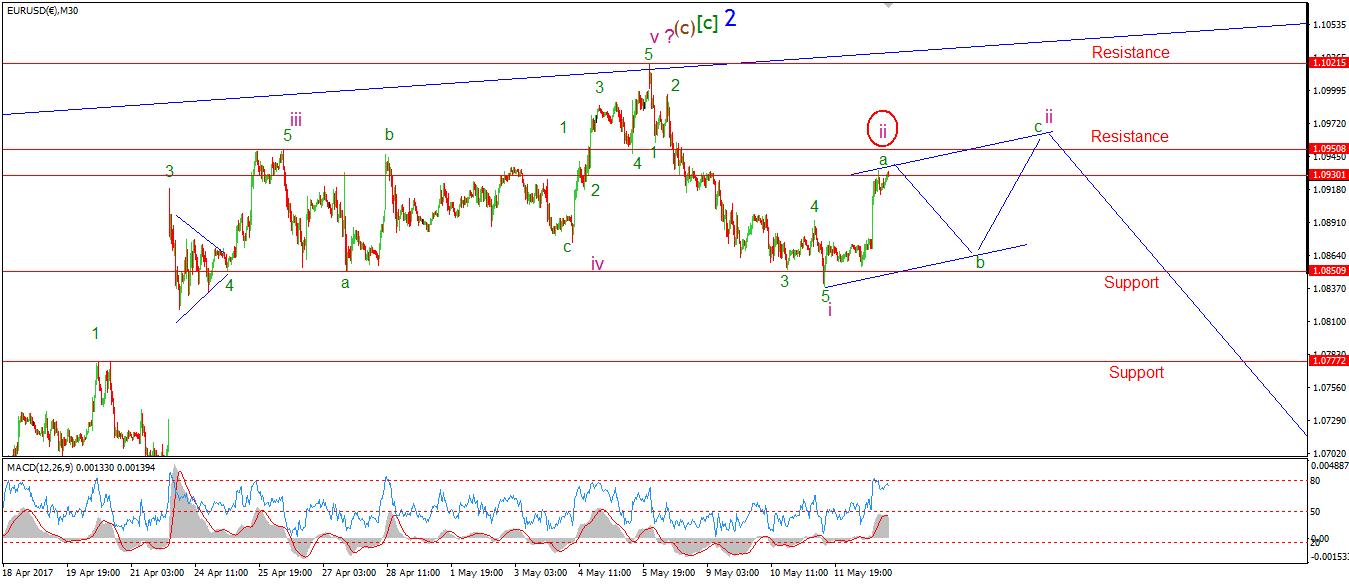 [/vc_column_text][/vc_column][vc_column width=”1/3″][vc_custom_heading text=”4 Hours” use_theme_fonts=”yes”][vc_column_text]
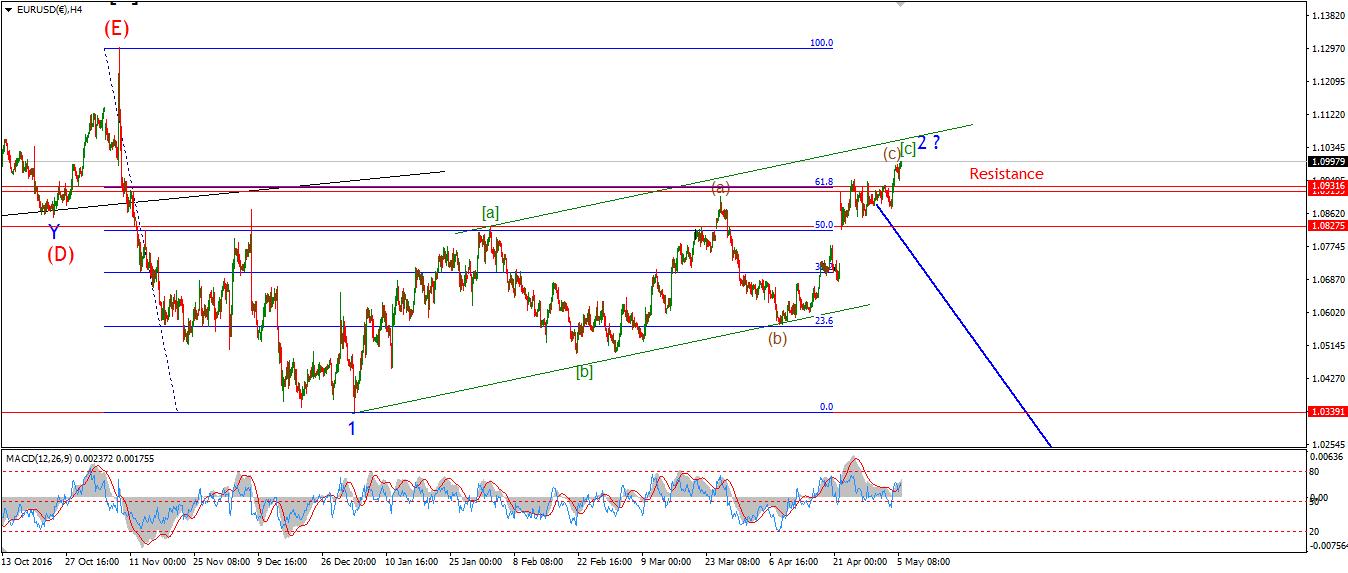 [/vc_column_text][vc_custom_heading text=”Daily” use_theme_fonts=”yes”][vc_column_text]
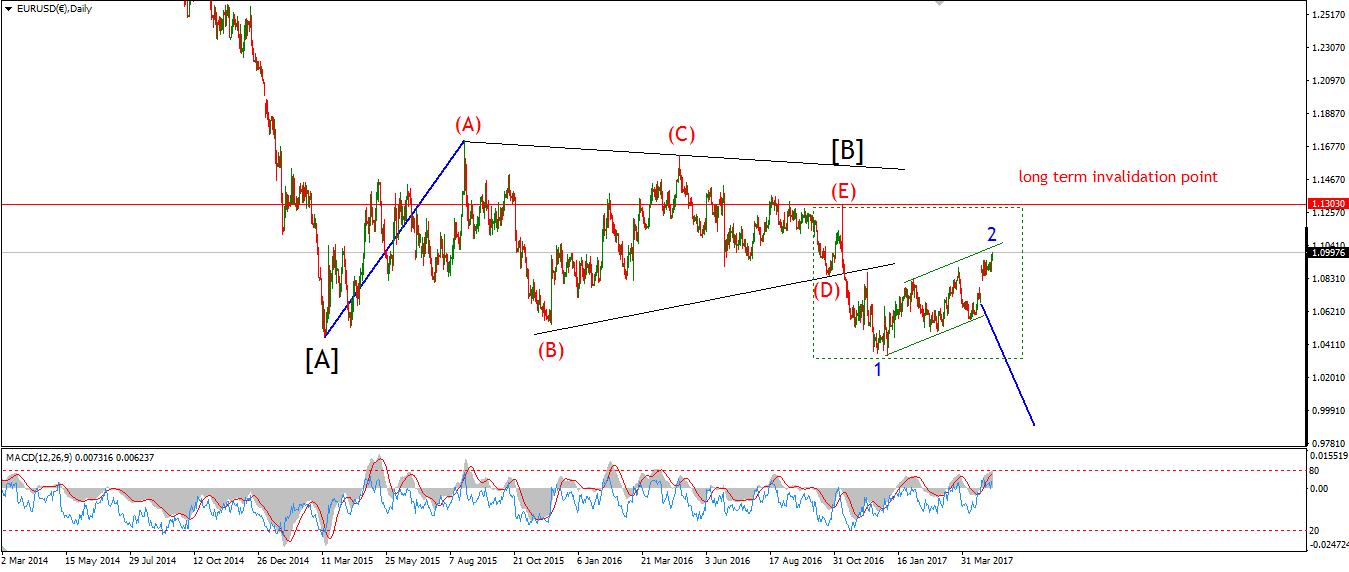 [/vc_column_text][/vc_column][/vc_row][vc_row][vc_column][vc_column_text]My Bias: short in wave 3 blue.
Wave Structure: downward impulse wave 1, 2 blue
Long term wave count: lower in wave 3 blue
Important risk events: EUR: G7 Meetings. USD: Empire State Manufacturing Index,
Welcome to another weekend.
The time is ticking by!
And these price structures are developing slowly, but nicely all the same.
Lets dig into it!
EURUSD has traced out a possible five waves to the downside this week.
The price broke support at 1.0850 for a brief moment and has rallied back strongly in a possible wave ‘a’ green today.
The price has reached the first resistance level this evening at 1.0930,
This is the 50% retracement level of wave ‘i’ pink.
So if this is the beginning of a corrective rise in wave ‘ii’ pink,
then we need to see wave ‘b’ and ‘c’ happen early next week.
price must stay below the upper resistance at 1.1021 in order for this immediately bearish wave count to remain valid.
A break of the high will merely postpone the turn down for another week or so.
I have shown an idealized path for a zigzag correction to take, so lets concentrate on that next week,[/vc_column_text][/vc_column][/vc_row][vc_row][vc_column][vc_separator border_width=”5″][/vc_column][/vc_row][vc_row][vc_column][vc_column_text]
GBPUSD
[/vc_column_text][/vc_column][/vc_row][vc_row][vc_column][vc_separator border_width=”5″][/vc_column][/vc_row][vc_row][vc_column width=”2/3″][vc_custom_heading text=”30 min” use_theme_fonts=”yes”][vc_column_text]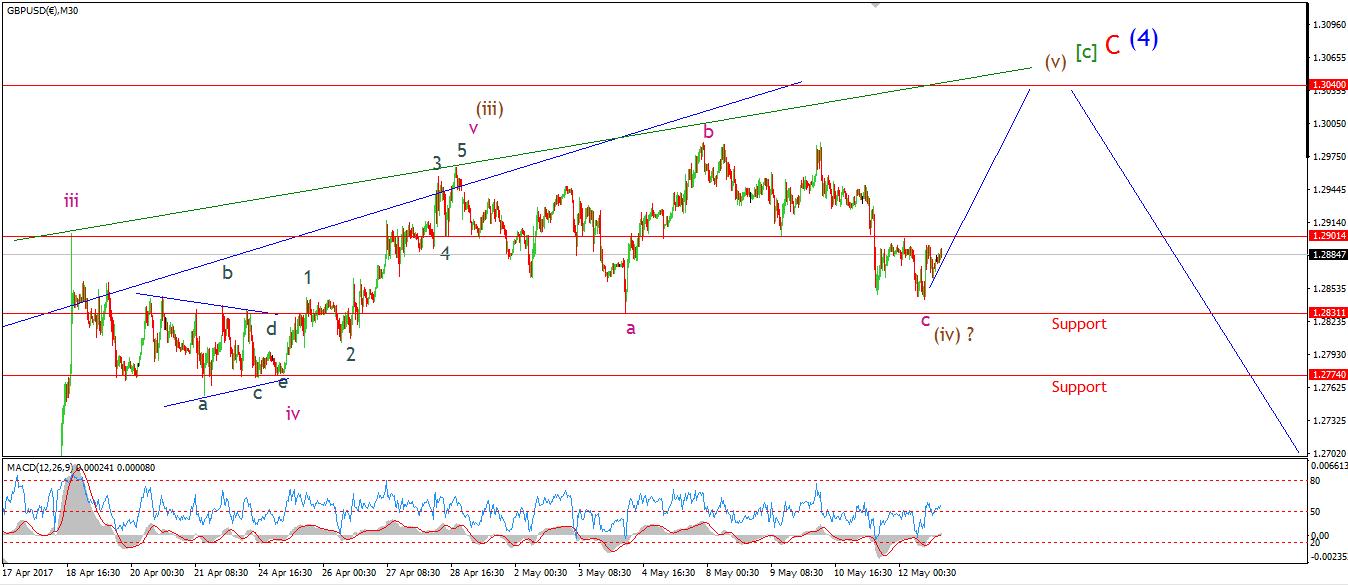 [/vc_column_text][/vc_column][vc_column width=”1/3″][vc_custom_heading text=”4 Hours” use_theme_fonts=”yes”][vc_column_text]
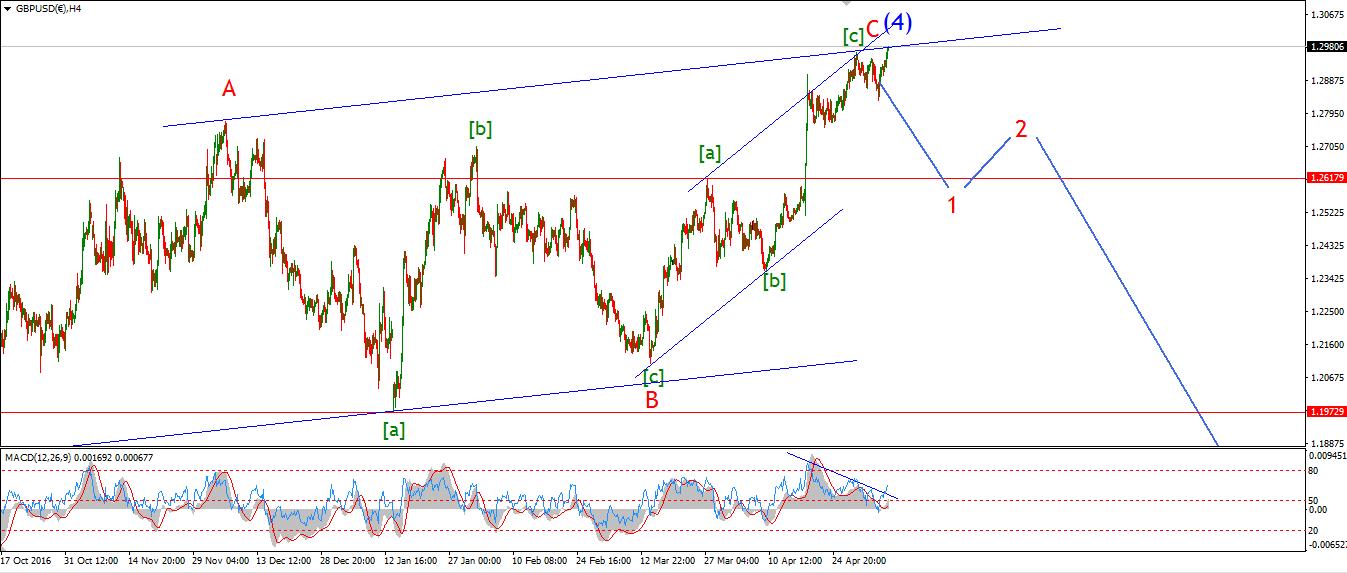 [/vc_column_text][vc_custom_heading text=”Daily” use_theme_fonts=”yes”][vc_column_text]
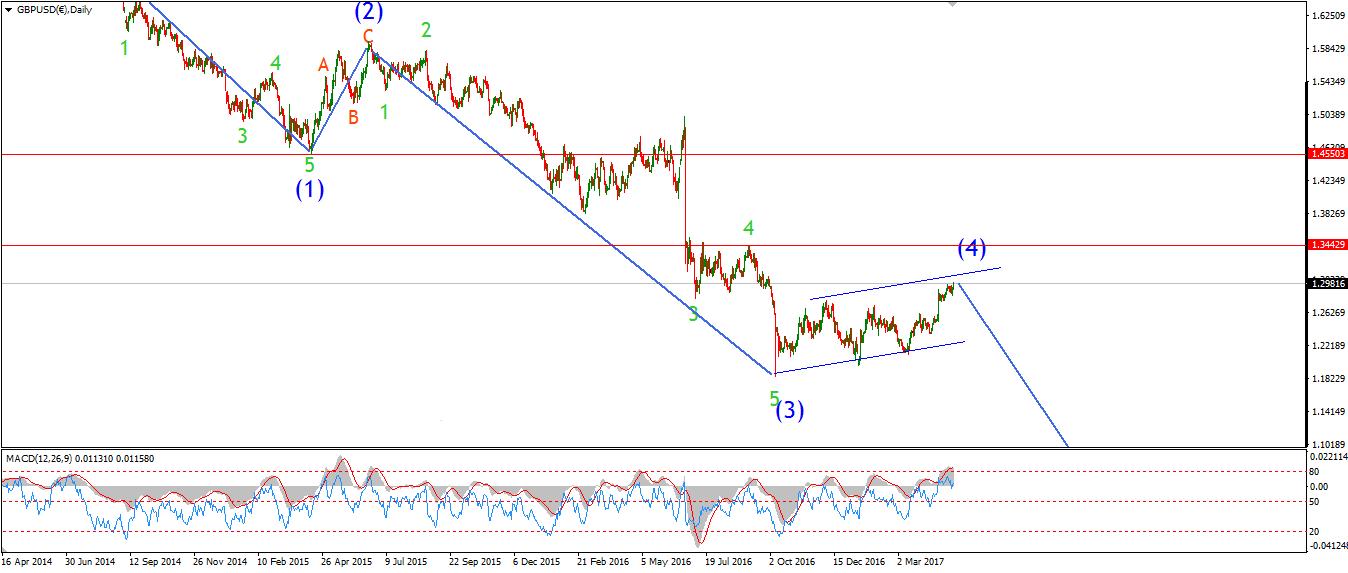 [/vc_column_text][/vc_column][/vc_row][vc_row][vc_column][vc_column_text]My Bias: short below parity.
Wave Structure: continuing impulsive structure to the downside in wave (5)
Long term wave count: decline in wave (5) blue, below parity
Important risk events: GBP: G7 Meetings. USD: Empire State Manufacturing Index,
The sideways action has continued today in cable.
The wave count calls for one more rally into wave (v) brown to complete the larger corrective structure in wave (4) blue.
This remains the focus next week.
The upper target lies at 1.3050, where the price will tag the upper trendline one last time.
So there is the potential for a cheeky long position into that high!
A break of 1.2900 will signal the final rally is underway.
From a larger perspective,
The 4hr momentum indicators have already given a general sell signal
With a centreline cross to the downside yesterday, any new high will be short lived.
For next week, watch for a major top to form,
This one will be remembered for a while.[/vc_column_text][/vc_column][/vc_row][vc_row][vc_column][vc_separator border_width=”5″][/vc_column][/vc_row][vc_row][vc_column][vc_column_text]
USDJPY
[/vc_column_text][/vc_column][/vc_row][vc_row][vc_column][vc_separator border_width=”5″][/vc_column][/vc_row][vc_row][vc_column width=”2/3″][vc_custom_heading text=”30 min” use_theme_fonts=”yes”][vc_column_text]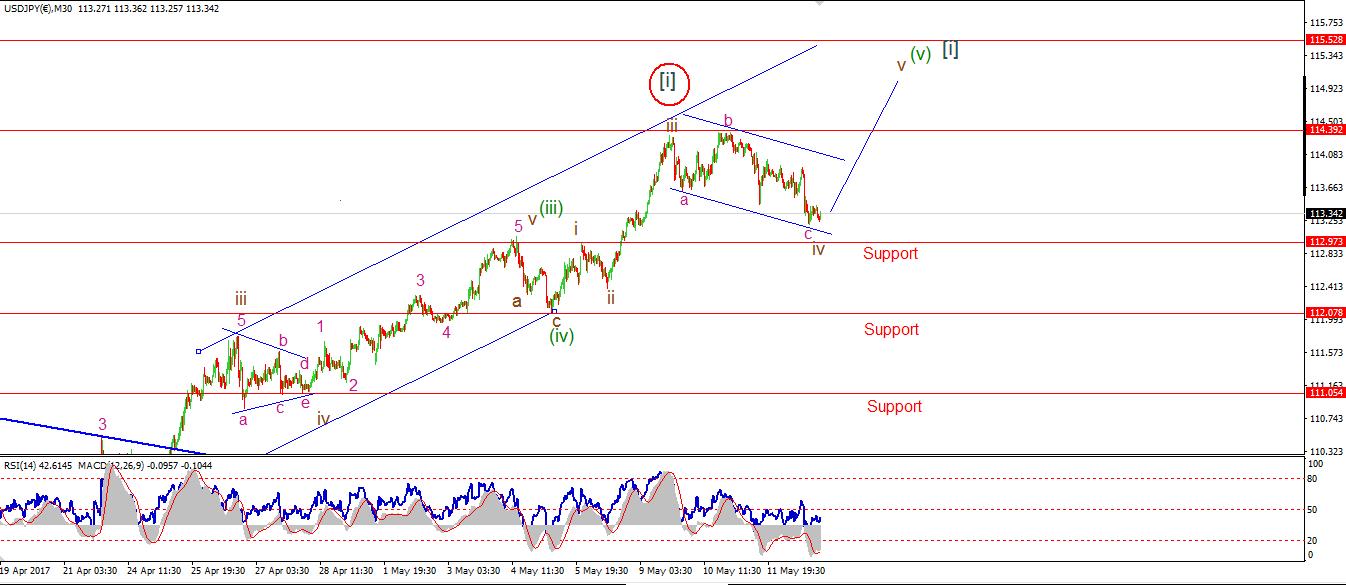 [/vc_column_text][/vc_column][vc_column width=”1/3″][vc_custom_heading text=”4 Hours” use_theme_fonts=”yes”][vc_column_text]
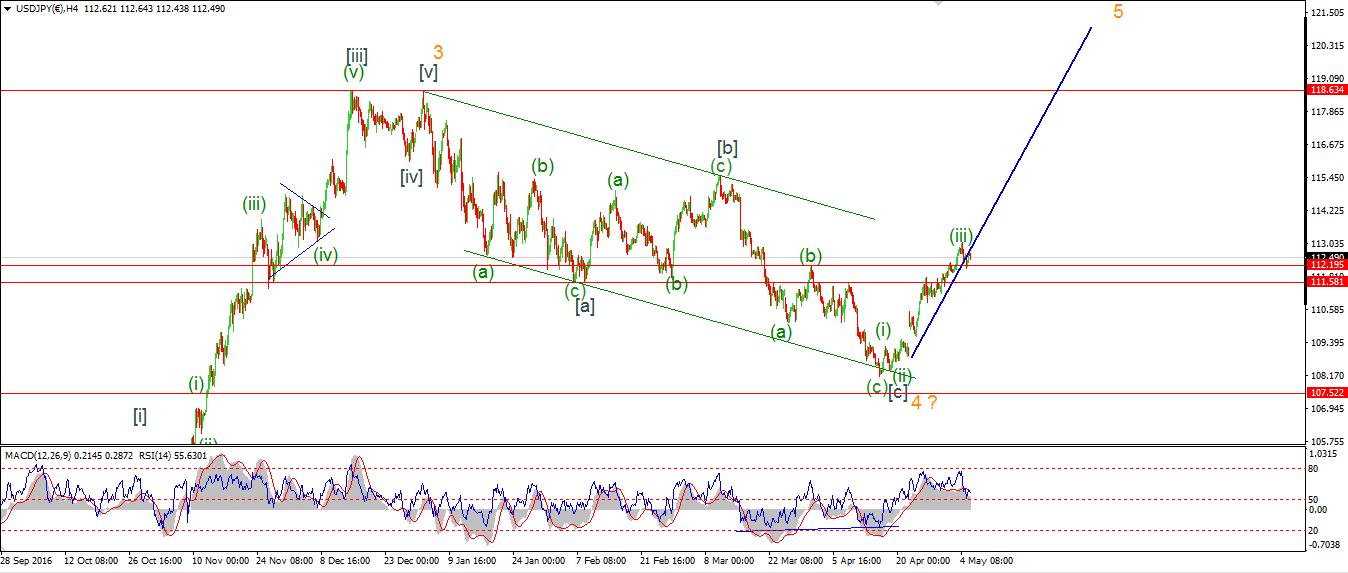 [/vc_column_text][vc_custom_heading text=”Daily” use_theme_fonts=”yes”][vc_column_text]
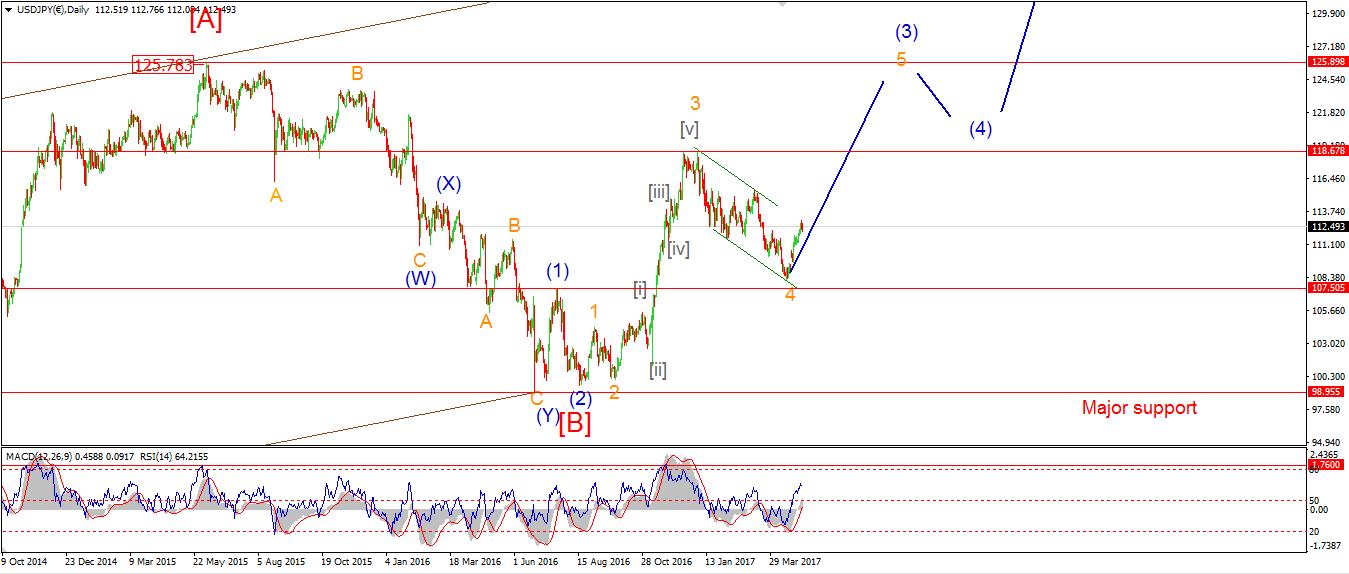 [/vc_column_text][/vc_column][/vc_row][vc_row][vc_column][vc_column_text]My Bias: LONG
Wave Structure: rally in wave [C]
Long term wave count: wave [C] is underway, upside to above 136.00
Important risk events: JPY: G7 Meetings. USD: Empire State Manufacturing Index,
The lows of the days trade seem to have closed out wave ‘c’ pink.
The correction in wave ‘iv’ brown has traced out an expanded flat so far.
The support at 112.95 must not be crossed in this wave count.
Wave ‘iv’ should not cross into the price territory of wave ‘i’ brown.
So that high is important in the early trade next week.
watch for the formation of a higher low off 113.19.
A break of the wave ‘i’ high will trigger the alternate count shown circled in red.
This views wave [ii] grey as already underway.
At the moment 112.95 is the price to watch.[/vc_column_text][/vc_column][/vc_row][vc_row][vc_column][vc_separator][/vc_column][/vc_row][vc_row][vc_column][vc_column_text]
DOW JONES INDUSTRIALS
[/vc_column_text][/vc_column][/vc_row][vc_row][vc_column][vc_separator][/vc_column][/vc_row][vc_row][vc_column width=”2/3″][vc_custom_heading text=”30 min” use_theme_fonts=”yes”][vc_column_text]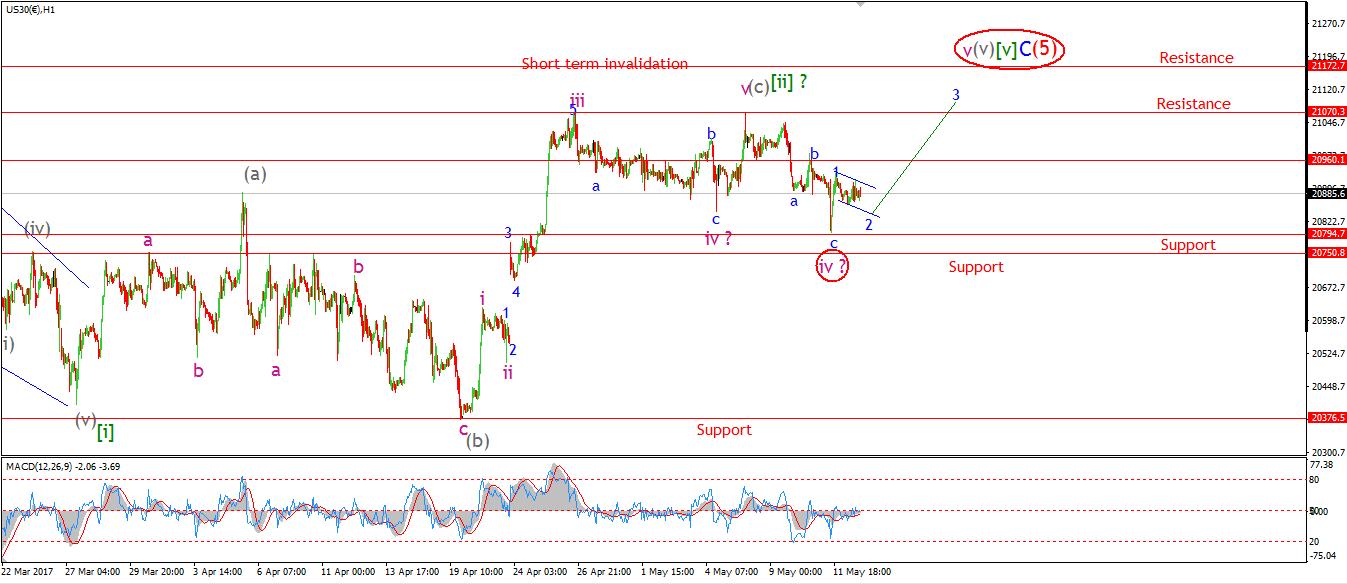 [/vc_column_text][/vc_column][vc_column width=”1/3″][vc_custom_heading text=”4 Hours” use_theme_fonts=”yes”][vc_column_text]
 [/vc_column_text][vc_custom_heading text=”Daily” use_theme_fonts=”yes”][vc_column_text]
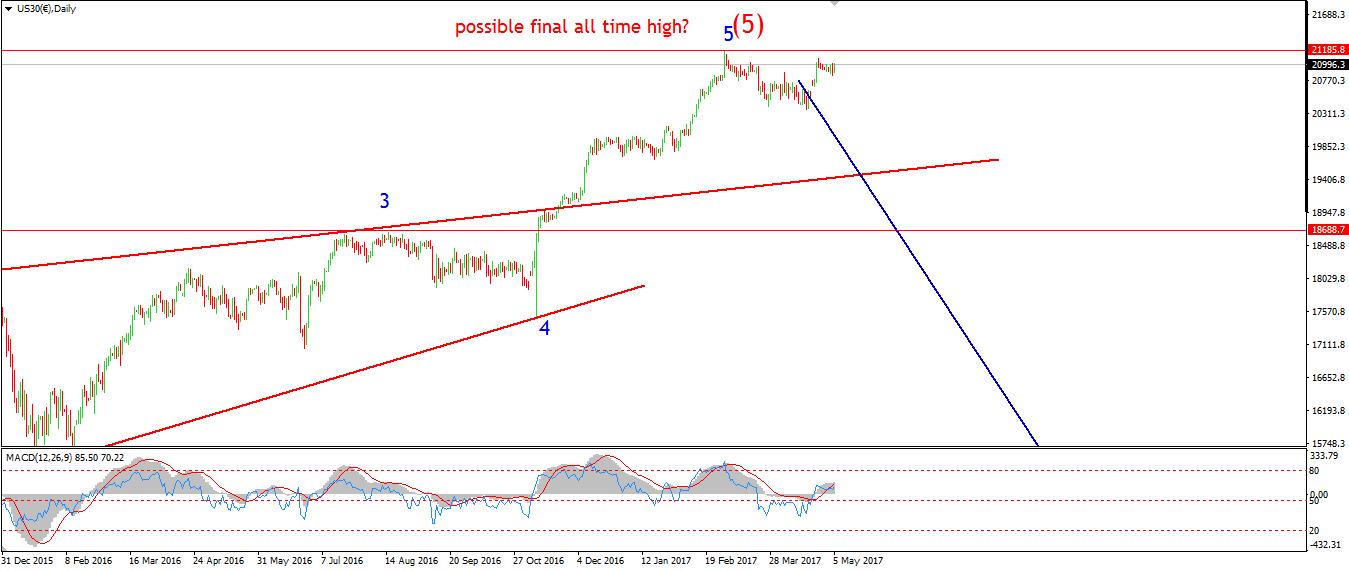 [/vc_column_text][/vc_column][/vc_row][vc_row][vc_column][vc_column_text]My Bias: market top is in.
Wave Structure: Impulsive 5 wave structure, possibly topping in an all time high.
Long term wave count: Topped in wave (5)
Important risk events: USD: Empire State Manufacturing Index, G7 Meetings
I have shown both operating and the alternate wave counts in the short term chart tonight.
The reason being,
They are both equally likely at this stage!
The action over the last few days has lifted the probability of one last high in the DOW to 50% right now,
The action off yesterdays high has tipped the scales alot.
This decline looks corrective and sits in a nice trend channel shown in blue.
So, the action off this weeks low looks like a wave ‘1’ and ‘2’ combination.
This is bullish in the short term as it is calling for a rally next week in wave ‘3’ blue.
this rally has the potential to carry the the market to a new all time high and one last party on wall street.
Do not confuse this short term bullish view as a shift into a completely bullish stance.
Oh, no no no no no!
What we are witnessing in slow motion is a multi decade cycle coming to and end.
This takes time, but the larger degree wave count has not changed one iota!
The next big move in the stock market is to the downside,
And almost certainly in the form of a massive crash.
I have no doubt in my mind about that.
But a market top is a process, not a moment in time.
Each new iteration of the wave count draws us inevitably closer to the actual top.
The wave count will catch it first, the rest of world will catch on after the ATM ques form!
You wont find me standing in line.
For next week 20798 is the focus.
If that line holds and wave ‘2’ blue completes in a three wave fashion,
This will lead to a large move up in wave ‘3’ blue.[/vc_column_text][/vc_column][/vc_row][vc_row][vc_column][vc_separator][/vc_column][/vc_row][vc_row][vc_column][vc_column_text]
GOLD
[/vc_column_text][/vc_column][/vc_row][vc_row][vc_column][vc_separator][/vc_column][/vc_row][vc_row][vc_column width=”2/3″][vc_custom_heading text=”30 min” use_theme_fonts=”yes”][vc_column_text]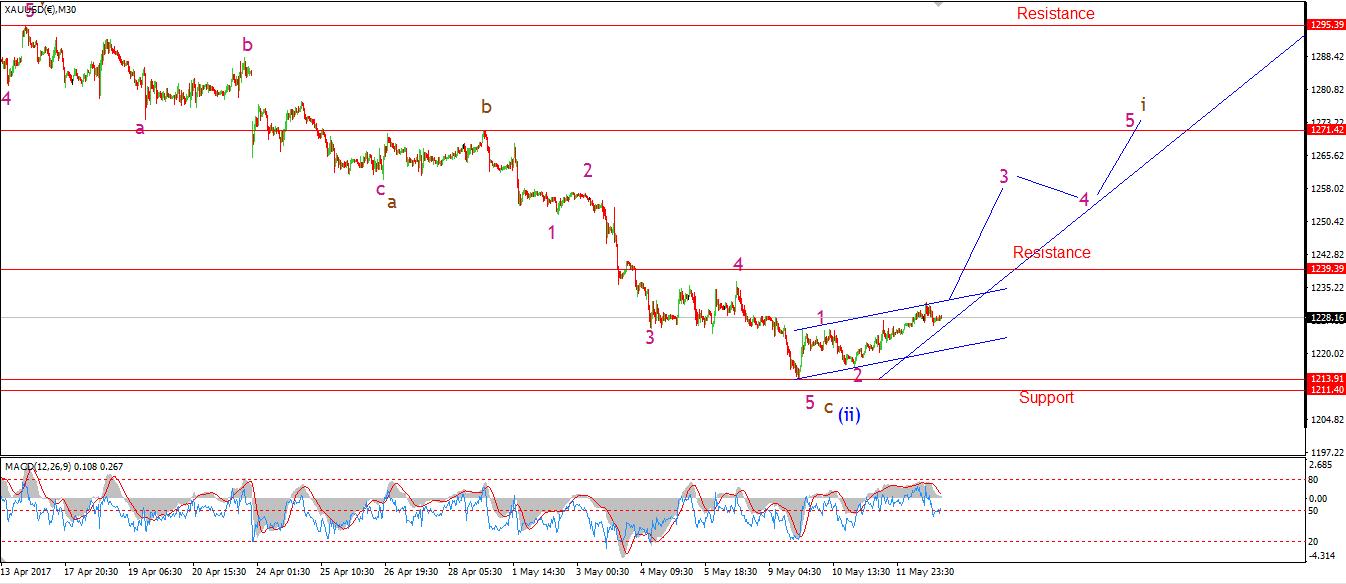 [/vc_column_text][/vc_column][vc_column width=”1/3″][vc_custom_heading text=”4 Hours” use_theme_fonts=”yes”][vc_column_text]
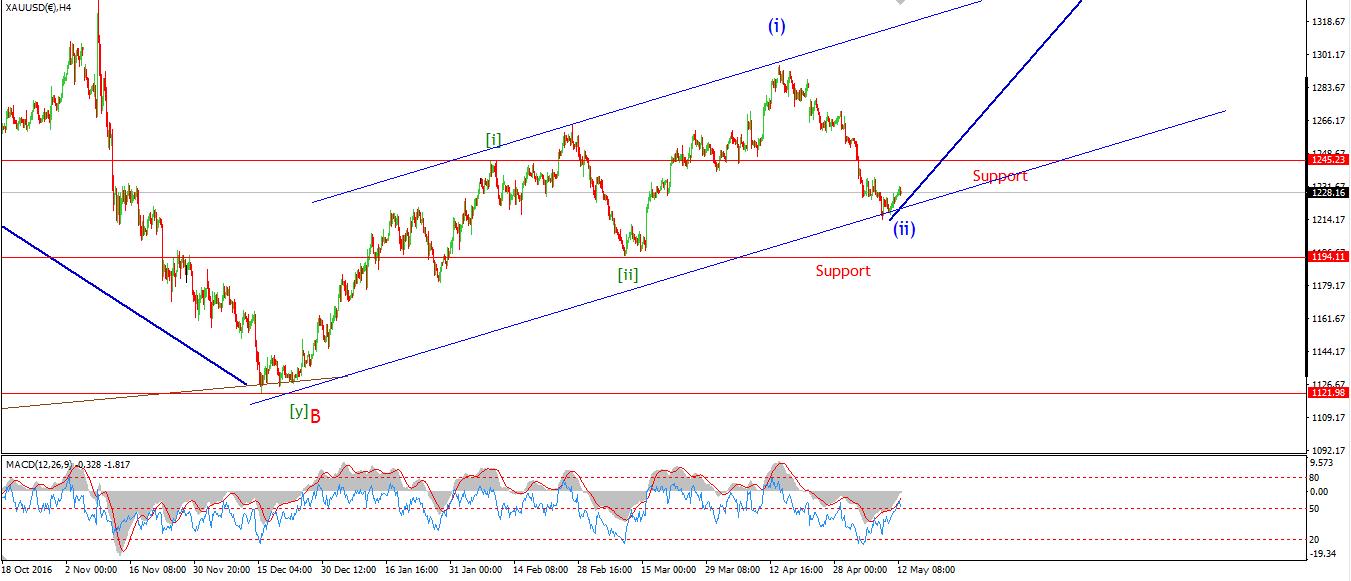 [/vc_column_text][vc_custom_heading text=”Daily” use_theme_fonts=”yes”][vc_column_text]
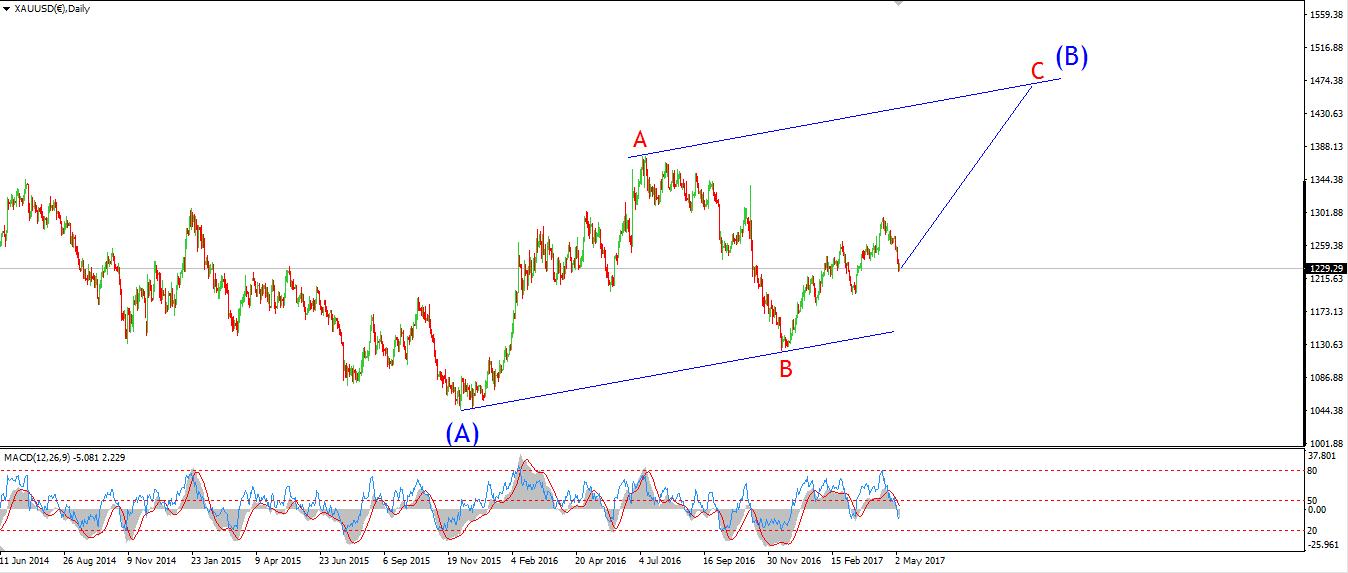 [/vc_column_text][/vc_column][/vc_row][vc_row][vc_column][vc_column_text]My Bias: Long towards 1550
Wave Structure: ZigZag correction to the upside.
Long term wave count: Topping in wave (B) at 1550
Important risk events: USD: Empire State Manufacturing Index, G7 Meetings
The message from the market this week is that GOLD is turning up,
and the market internals that I follow are looking far better and pointing to a rally phase beginning presently.
We have a definite BUY signal in place in the 4HR chart,
Both the RSI and the MACD have crossed up above the centreline from a bearish extreme
The price action is looking positive,
And the elliott wave pattern is showing a completed correction
and the beginnings of an elliott wave bullish signal forming.
The final hold out in the puzzle is the lack of a few bullish price candles to lift the price above resistance.
I have no doubt that sort of price action is on its way.
The trend channel is the first leg to clear, price must lift out of the channel in wave ‘3’ pink.
A break of resistance at 1239 may be enough to shift the momentum back in favor of the wave count.
Thats all for this week,
See you all again on Monday, hope you all have a great weekend![/vc_column_text][/vc_column][/vc_row]