
In December 2019 USDJPY was suck in a ranging stagnation and most analysts read that as a sign that the USD had topped out for good.
BUT;
The wave count at that time painted a completely different Bullish picture though!
I was looking at the completing moves within a very large contracting triangle pattern.
This pattern was calling for a rally out of the lows,
to begin a new bull move in the USD.
Here is how that played out on the charts at the time.
USDJPY Daily chart December 2019:

USDJPY 4HR chart December 2019:

As you can see from the charts above,
the triangle pattern was due to complete a very large [B] wave in the area of 107.00,
and then the price should rally off the lows of wave [B] to begin wave [C].
On January 3rd I released this chart showing the final waves of that triangle almost complete.

The alternate count allowed for one more low to be created to complete the decline.
But this chart was very bullish indeed,
and the wave count called for a rally to begin in wave [i] up very soon.
The price was hovering at about 107.70 that evening and the turn higher was imminent.
The Following Monday saw the turn higher begin:

The price did trigger the alternate count over the coming days,
but the rally was now in place off the wave [B] low.

That rally continued higher in wave [i] green over the following weeks,
and the price reached initial resistance the next week, before showing signs of a correction developing.

After calling the the rally in wave [i],
the pattern was then looking for a decline into wave [ii] to begin.
And here is the latest chart to show how that developed.
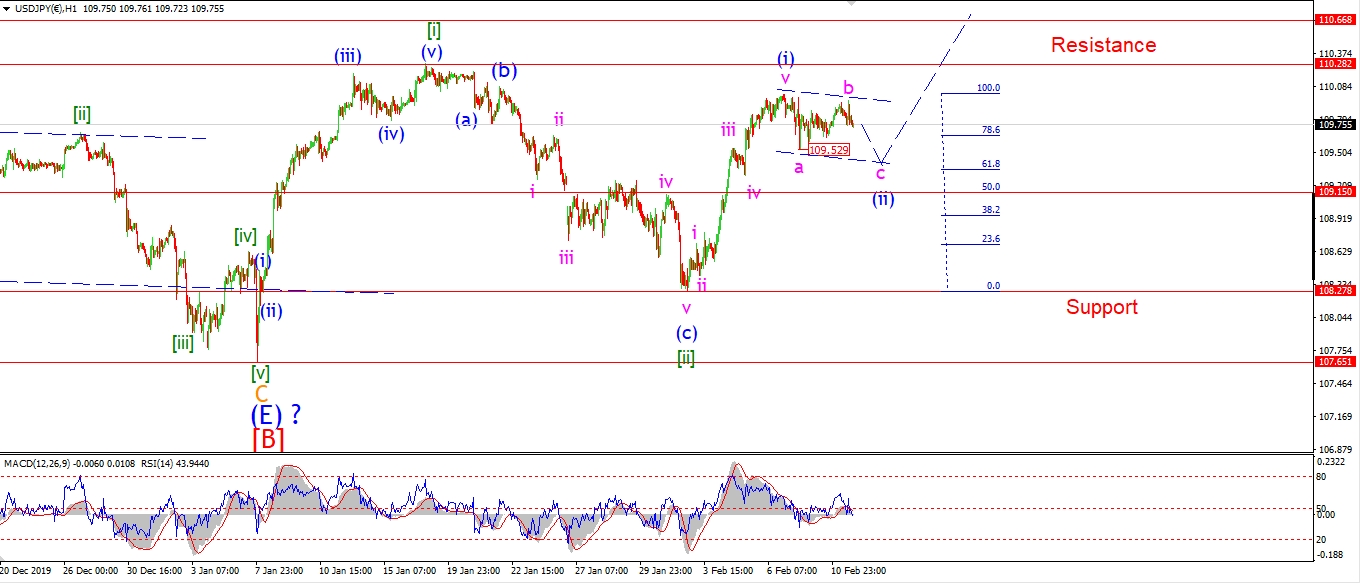
USDJPY rallied 270 pips into the wave [i] high before correcting.
But the wave count is not finished yet!!
To Find out whats next for USDJPY,
Check out bullwaves.org membership,

Join Risk free today,
and see our predictions for the biggest markets in the world.