
Hi there everyone, the calamity in the stock market continues today, and the world is still surprised that this kind of thing can happen at all!
But the wave count was looking for exactly this action to occur!
Last week, on Thursday the 20th I put out this chart:
The wave count was calling the top in place for the bull market.
And here we are 7 days later and the DOW is down 4000 points!
Where do we go next, that is the question.
DOW JONES.
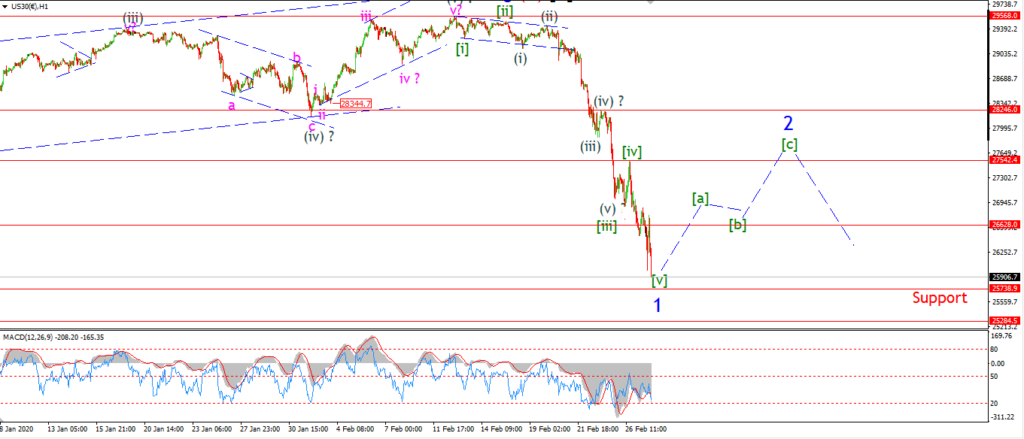
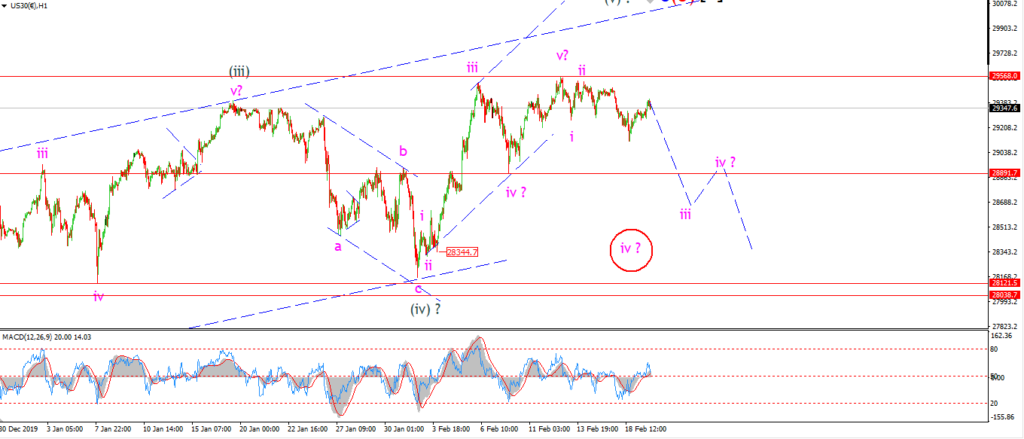
DOW 1hr.
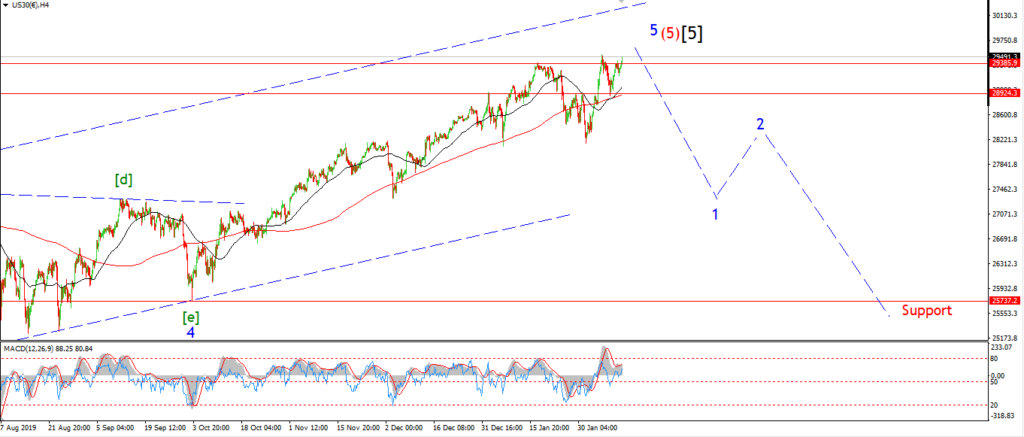
DOW 4hr
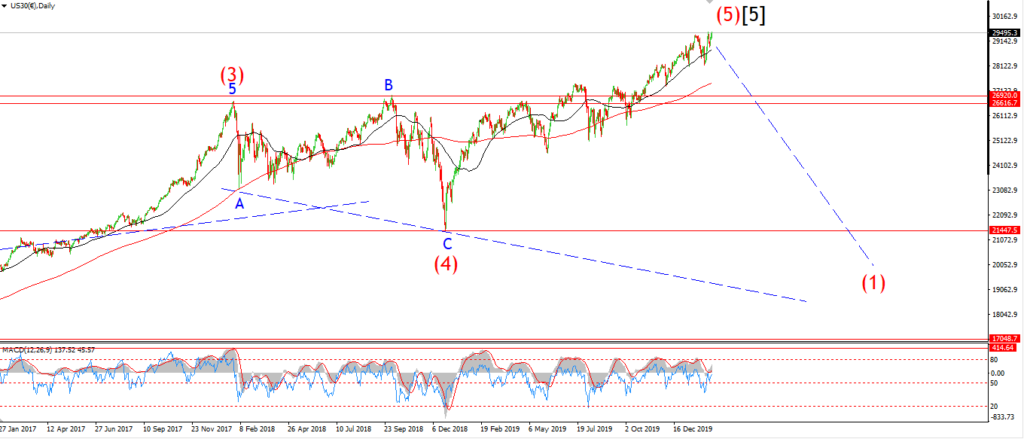
DOW daily.
Another day and another selloff in the stock market!
Boy doesn’t the scene change from rose tinted to complete blood bath in very short order!
The extent of the selloff this week requires me to move up the degree of the wave count once again!
The decline off the high is now viewed as wave ‘1’ blue.
The reason for this change,
is because this decline has almost fully retraced the previous rally in wave ‘5’ blue.
Wave ‘5’ blue began back last October, and rallied for almost 4 months.
This decline in wave ‘1’ is going for about ten days in total!
Now that is what I call progress!
Tomorrow;
I expect that wave ‘1’ is near to completion now.
there may be one final low in wave [v] of ‘1’.
And wave [ii] will begin next week.
25738 is the most significant level of support below us now.
That level marks the low of wave ‘4’ seen on the 4hr chart.
A break of that level will confirm the bearmarket,
and should lead to a corrective rally in wave ‘2’ to begin.