
[vc_row][vc_column][vc_separator border_width="5"][/vc_column][/vc_row]
[vc_row][vc_column][vc_column_text]
Bon soir mes amis.
The DOW bit back today with another new high.
So that means you are completely wrong about everything Enda,
Why are you worrying so much?
All is Kosher,
The world is fine and dandy.
Just buy stocks and go to sleep..........
Hold on there a minute.
I have not changed my mind one single bit.
This market is a catastrophe waiting to happen.
This market will destroy a generation worth of wealth, value and savings in a very short period of time.
This trend is not your friend in any way shape or form.
I am working to find the final high,
to find a signal off that high to the downside.
and to track the development of the next depression as it happens.
So the short term pattern will chop and change,
and it is difficult to call in real time.
But,
The end result will be the same.
I will be there to catch the top when it does come.
And I still believe we are only days away from that top!
Ok,
Enough of the pep talk.
Down to business.
[/vc_column_text][/vc_column][/vc_row]
[vc_row][vc_column][vc_separator border_width="5"][/vc_column][/vc_row]
[vc_row][vc_column][vc_column_text]
EURUSD
[/vc_column_text][/vc_column][/vc_row]
[vc_row][vc_column][vc_separator border_width="5"][/vc_column][/vc_row][vc_row][vc_column width="2/3"][vc_custom_heading text="30 min" use_theme_fonts="yes"][vc_column_text]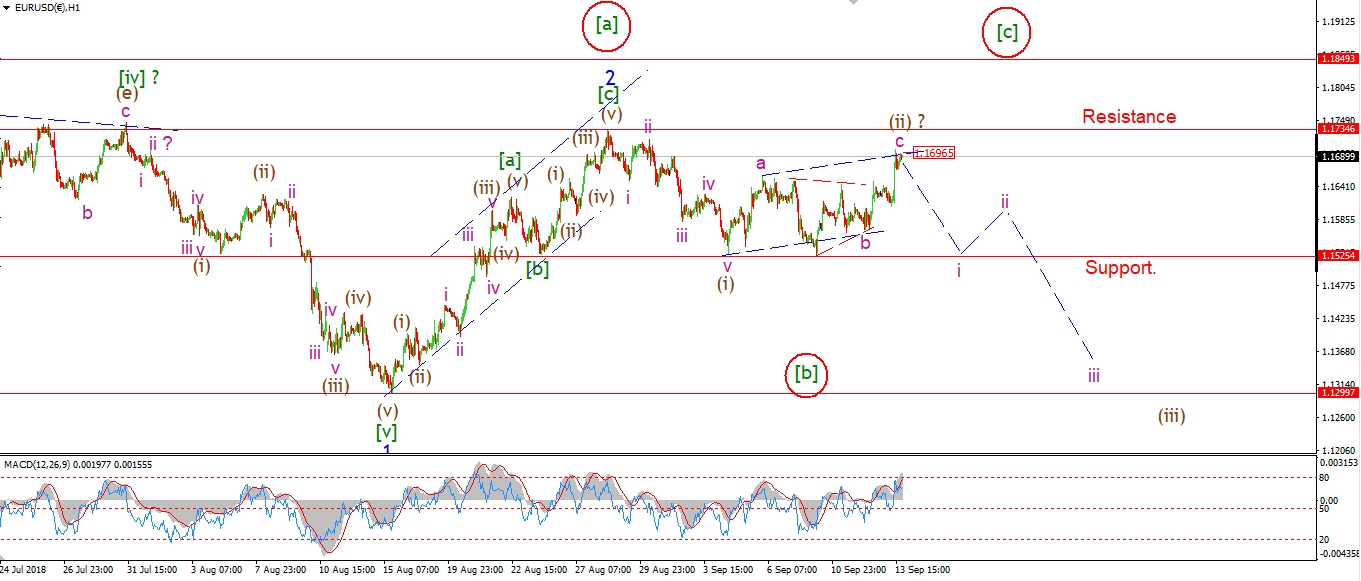 [/vc_column_text][/vc_column][vc_column width="1/3"][vc_custom_heading text="4 Hours" use_theme_fonts="yes"][vc_column_text]
 [/vc_column_text][vc_custom_heading text="Daily" use_theme_fonts="yes"][vc_column_text]
 [/vc_column_text][/vc_column][/vc_row]
[vc_row][vc_column][vc_column_text]
We are at a decision point between both short term counts right now.
EURUSD has hit the upper trend channel line this evening.
todays high reached 1.1700,
whit initial resistance at 1.1734.
Prices must hold below that level for the current count to remain valid.
A break of 1.1734 will trigger the alternate wave count.
Tomorrow;
1.1700 should hold.
Watch for a first decline in wave (iii) brown.
[/vc_column_text][/vc_column][/vc_row]
[vc_row][vc_column][vc_separator border_width="5"][/vc_column][/vc_row][vc_row][vc_column][vc_column_text]
GBPUSD
[/vc_column_text][/vc_column][/vc_row][vc_row][vc_column][vc_separator border_width="5"][/vc_column][/vc_row][vc_row][vc_column width="2/3"][vc_custom_heading text="30 min" use_theme_fonts="yes"][vc_column_text]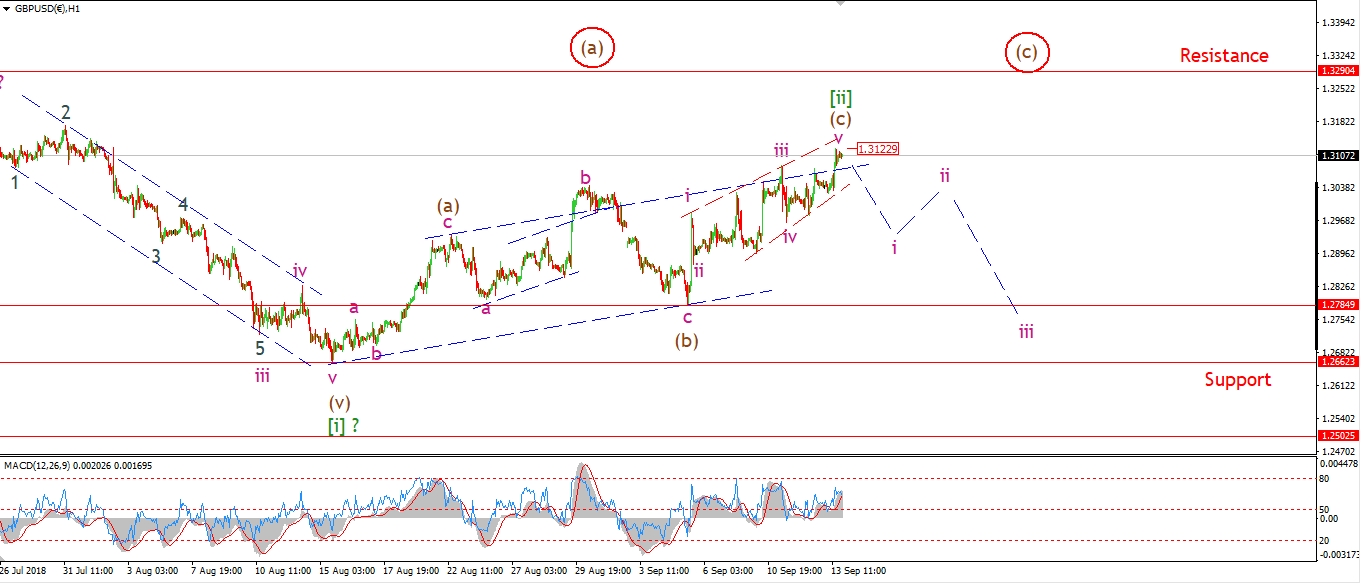 [/vc_column_text][/vc_column][vc_column width="1/3"][vc_custom_heading text="4 Hours" use_theme_fonts="yes"][vc_column_text]
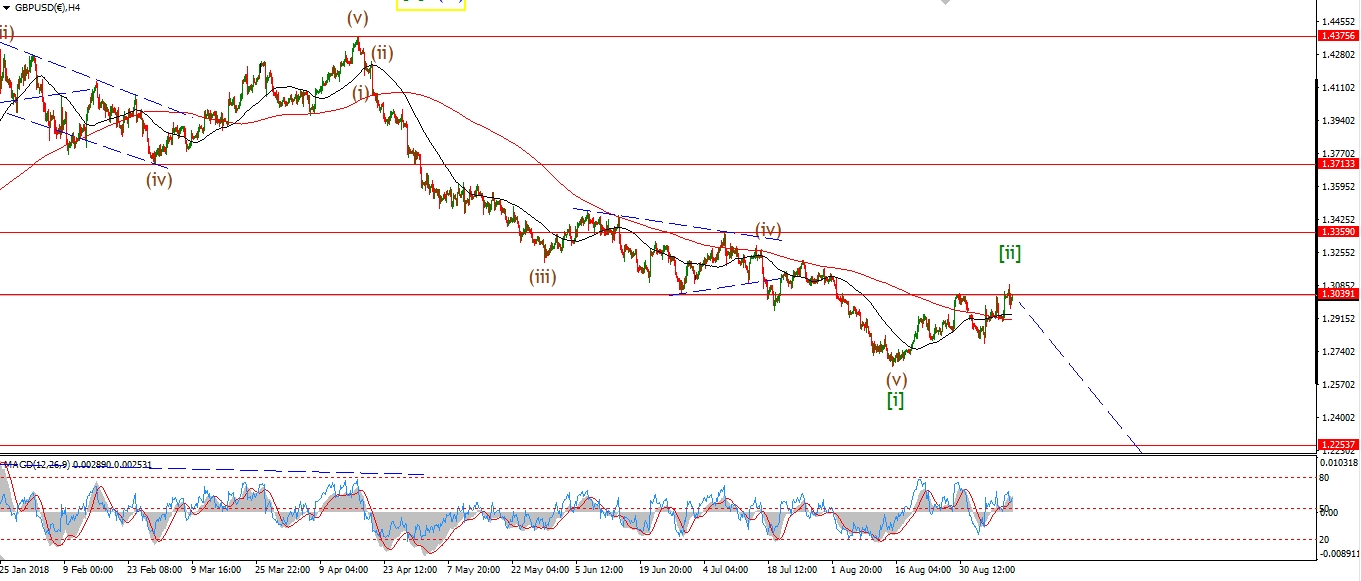 [/vc_column_text][vc_custom_heading text="Daily" use_theme_fonts="yes"][vc_column_text]
 [/vc_column_text][/vc_column][/vc_row]
[vc_row][vc_column][vc_column_text]
Cable is running close to that contracting trendline in red.
Wave (c) still counts well as an ending diagonal which is coming to an end.
Initial resistance lies at 1.3290 which is the previous wave (iv).
So it is still possible that wave (c) will venture higher,
as shown by the alternate count.
But the price action is definitely running out of steam at the moment.
And we have two trend channels hanging onto the price at the moment.
So I am in favor of wave [iv] ending sooner rather than later.
Tomorrow;
Watch for an initial decline off the trend line in wave 'i' pink.
[/vc_column_text][/vc_column][/vc_row]
[vc_row][vc_column][vc_separator border_width="5"][/vc_column][/vc_row][vc_row][vc_column][vc_column_text]
USDJPY
[/vc_column_text][/vc_column][/vc_row][vc_row][vc_column][vc_separator border_width="5"][/vc_column][/vc_row][vc_row][vc_column width="2/3"][vc_custom_heading text="30 min" use_theme_fonts="yes"][vc_column_text]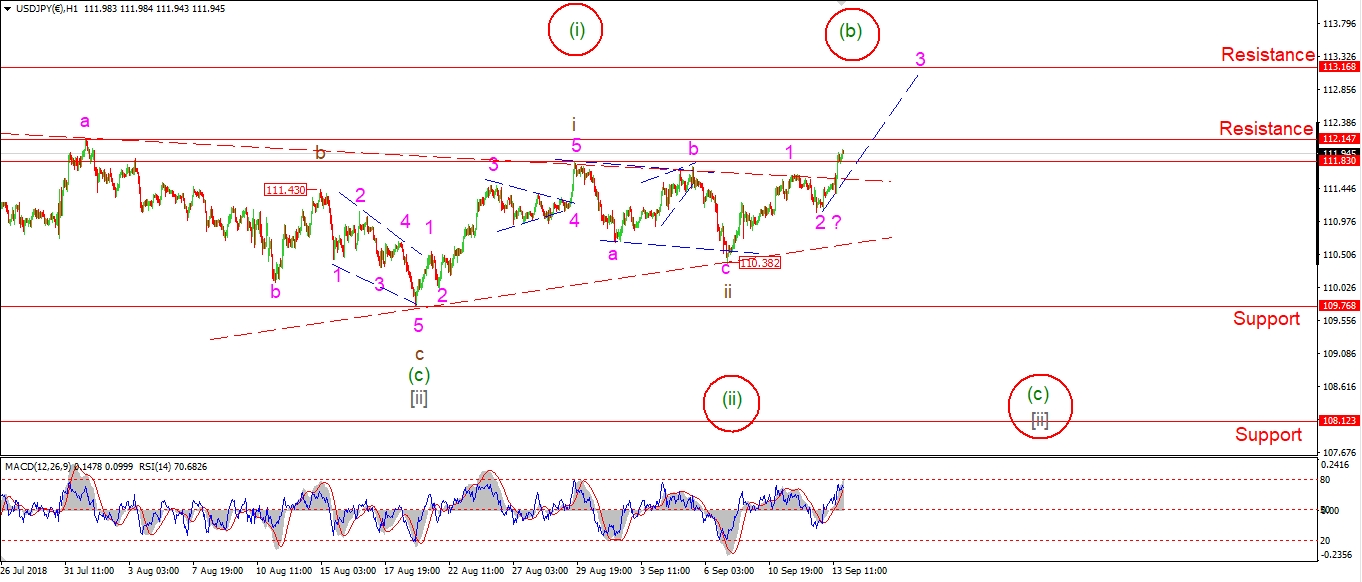 [/vc_column_text][/vc_column][vc_column width="1/3"][vc_custom_heading text="4 Hours" use_theme_fonts="yes"][vc_column_text]
 [/vc_column_text][vc_custom_heading text="Daily" use_theme_fonts="yes"][vc_column_text]
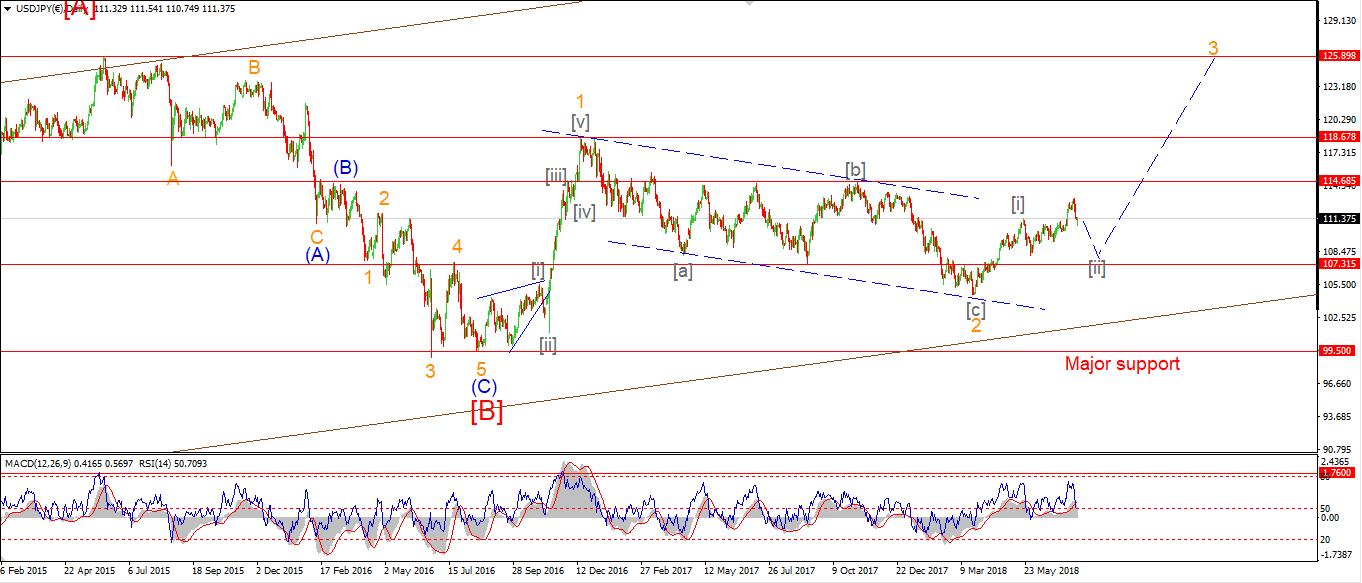 [/vc_column_text][/vc_column][/vc_row]
[vc_row][vc_column][vc_column_text]
USDJPY broke 111.83 this evening.
This is a good sign that wave '3' of 'iii' of (i) of [iii] is now underway.
If that is correct, then we should see a continued acceleration over the few weeks in wave [iii].
There is another way to view the short term bullish pattern.
And I have shown that circled in red on the hourly chart.
This shows the wave structure at one degree higher off the recent low.
Lets see how the rally develops,
I may switch to that view if needs be.
Tomorrow;
Watch for 111.10 to hold and a further rally in wave '3' of 'iii'.
[/vc_column_text][/vc_column][/vc_row]
[vc_row][vc_column][vc_separator border_width="5"][/vc_column][/vc_row][vc_row][vc_column][vc_column_text]
DOW JONES INDUSTRIALS
[/vc_column_text][/vc_column][/vc_row][vc_row][vc_column][vc_separator border_width="5"][/vc_column][/vc_row][vc_row][vc_column width="2/3"][vc_custom_heading text="30 min" use_theme_fonts="yes"][vc_column_text]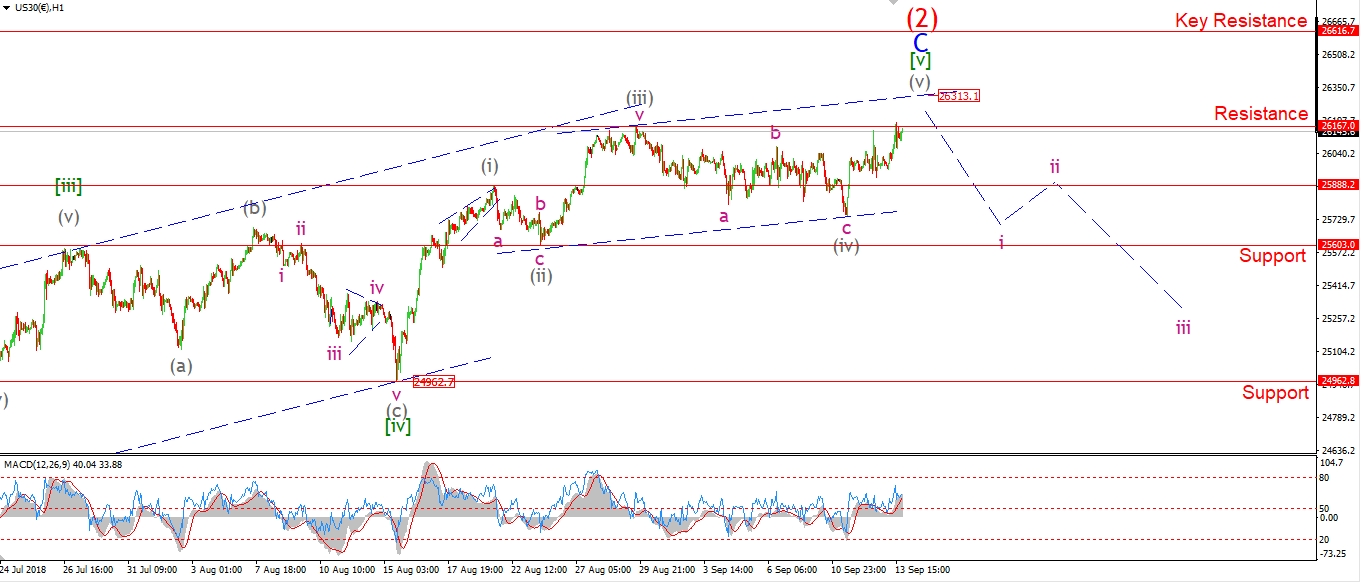 [/vc_column_text][/vc_column][vc_column width="1/3"][vc_custom_heading text="4 Hours" use_theme_fonts="yes"][vc_column_text]
 [/vc_column_text][vc_custom_heading text="Daily" use_theme_fonts="yes"][vc_column_text]
 [/vc_column_text][/vc_column][/vc_row]
[vc_row][vc_column][vc_column_text]
My word,
the buying just never stops does it!
The DOW pipped above the recent high at 26167 today reaching 26187.
This changes the structure of wave [v] green to a possible ending diagonal.
where wave (i) grey is the longest wave,
wave (iii) and (v) are progressively shorter.
And wave (v) is approaching the upper trendline again.
This trendline suggests a top at 26300.
And at that point we are at the very end of the line for wave (2) red.
The current wave count shows this rally as a correction in wave (2).
I believe this is still the best way to interpret the action.
The downside risk far outweighs any upside potential now.
And;
I think this market could break lower in a hard way to begin a large third wave down.
Tomorrow;
I am back on the hunt for an impulse wave down off the final wave (2) high.
[/vc_column_text][/vc_column][/vc_row]
[vc_row][vc_column][vc_separator border_width="5"][/vc_column][/vc_row][vc_row][vc_column][vc_column_text]
GOLD
[/vc_column_text][/vc_column][/vc_row][vc_row][vc_column][vc_separator border_width="5"][/vc_column][/vc_row][vc_row][vc_column width="2/3"][vc_custom_heading text="30 min" use_theme_fonts="yes"][vc_column_text] [/vc_column_text][/vc_column][vc_column width="1/3"][vc_custom_heading text="4 Hours" use_theme_fonts="yes"][vc_column_text]
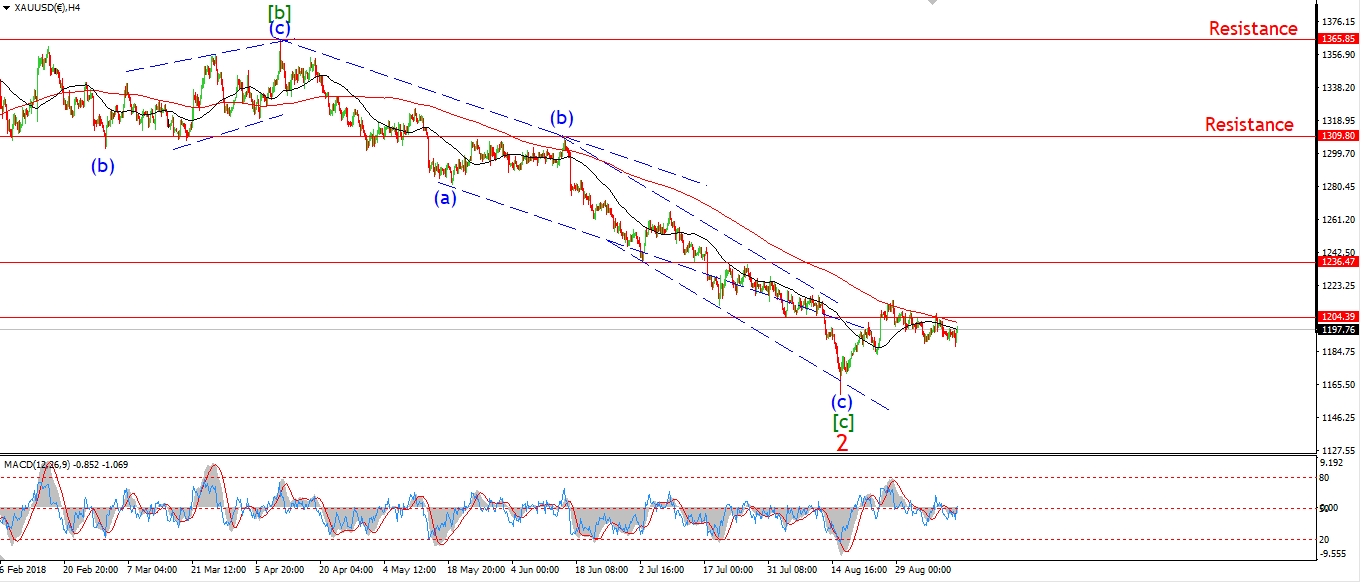 [/vc_column_text][vc_custom_heading text="Daily" use_theme_fonts="yes"][vc_column_text]
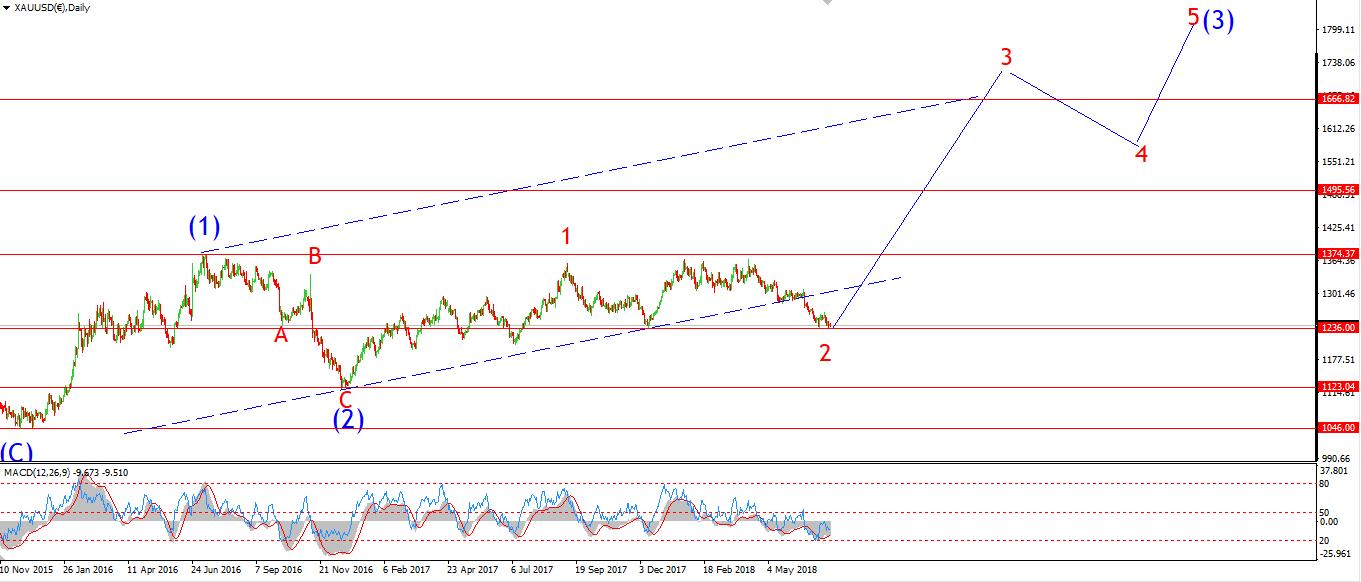 [/vc_column_text][/vc_column][/vc_row]
[vc_row][vc_column][vc_column_text]
GOLD has created a five wave pattern higher in wave '1' of 'iii' at todays high.
the price did not break 1217 as expected.
We will have to wait for wave '3' of 'iii' to do that.
Tomorrow;
Wave '2' pink is now underway and should trace out three waves.
Prices should hold above 1187 in wave '2' before turning higher again in wave '3'.
[/vc_column_text][/vc_column][/vc_row]
[vc_row][vc_column][vc_separator border_width="5"][/vc_column][/vc_row][vc_row][vc_column][vc_column_text]
U.S CRUDE OIL
[/vc_column_text][/vc_column][/vc_row][vc_row][vc_column][vc_separator border_width="5"][/vc_column][/vc_row][vc_row][vc_column width="2/3"][vc_custom_heading text="30 min" use_theme_fonts="yes"][vc_column_text]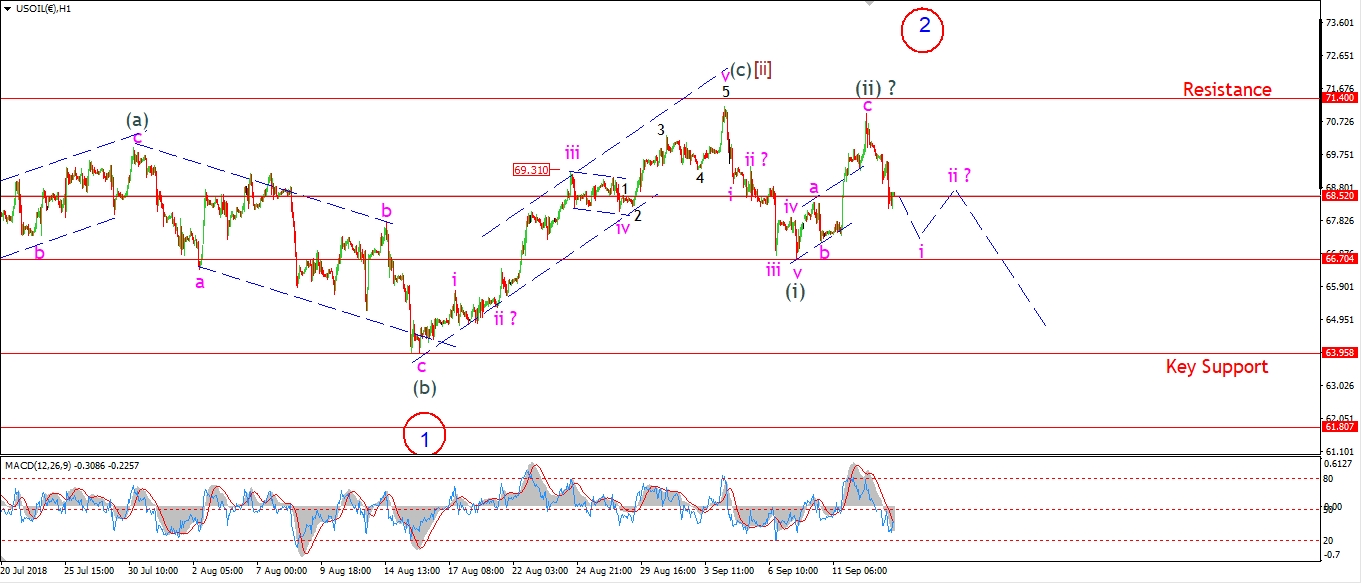 [/vc_column_text][/vc_column][vc_column width="1/3"][vc_custom_heading text="4 Hours" use_theme_fonts="yes"][vc_column_text]
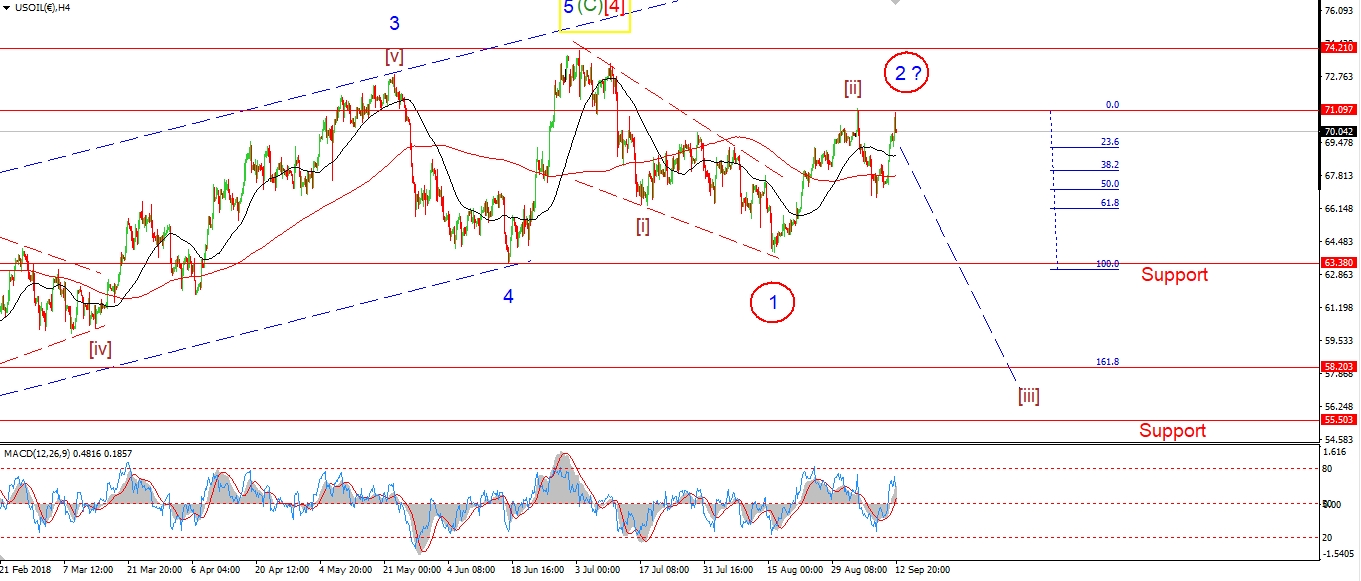 [/vc_column_text][vc_custom_heading text="Daily" use_theme_fonts="yes"][vc_column_text]
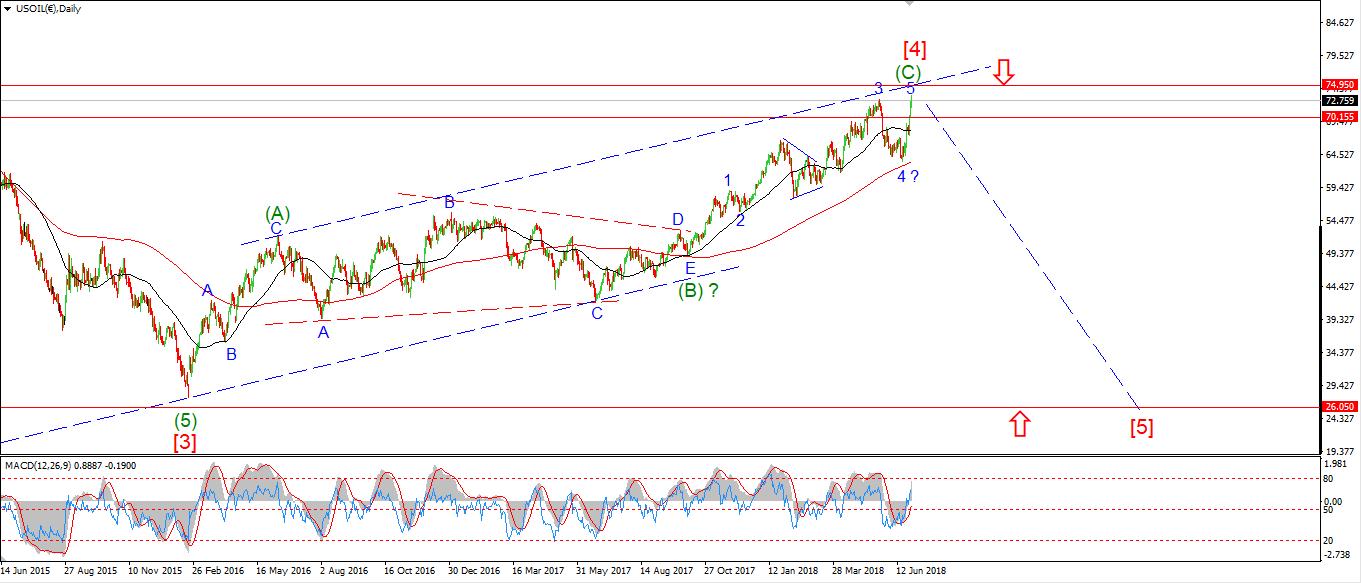 [/vc_column_text][/vc_column][/vc_row]
[vc_row][vc_column][vc_column_text]
Again another sharp spike lower in crude today.
Its a bit early to say if a complete fives down has occurred in wave 'i' pink today.
But the price action definitely favors the bearish outlook.
At this point we should look for another impulse wave down to begin wave (iii) of [iii].
While wave (iii) will not be confirmed until 66.70 is broken again.
I would prefer if wave 'i' pink broke that level before completing.
Tomorrow;
Watch for further declines in wave 'i' and a possible break of 66.70.
[/vc_column_text][/vc_column][/vc_row]
[vc_row][vc_column][vc_separator border_width="5"][/vc_column][/vc_row][vc_row][vc_column][vc_column_text]
US 10 yr Treasuries.
[/vc_column_text][/vc_column][/vc_row][vc_row][vc_column][vc_separator border_width="5"][/vc_column][/vc_row][vc_row][vc_column width="2/3"][vc_custom_heading text="30 min" use_theme_fonts="yes"][vc_column_text]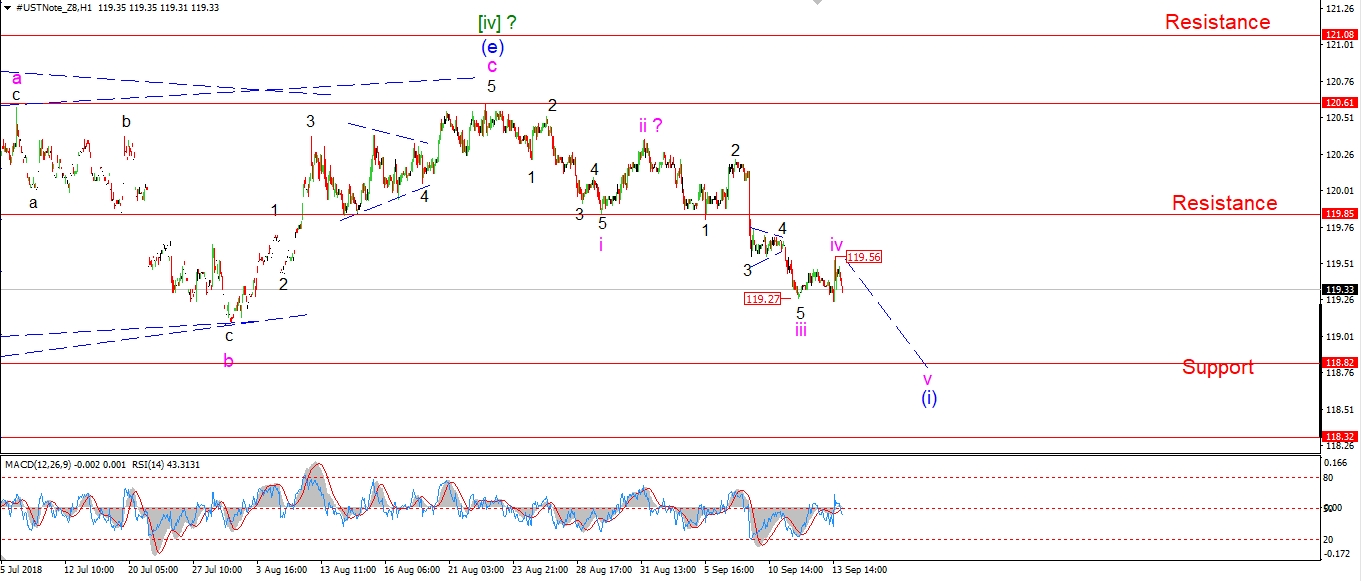 [/vc_column_text][/vc_column][vc_column width="1/3"][vc_custom_heading text="4 Hours" use_theme_fonts="yes"][vc_column_text]
 [/vc_column_text][vc_custom_heading text="Daily" use_theme_fonts="yes"][vc_column_text]
 [/vc_column_text][/vc_column][/vc_row]
[vc_row][vc_column][vc_column_text]
There is a good chance that wave 'iv' pink has completed at todays high.
The pattern fits the form of an expanded flat off the wave 'iii' low.
Wave 'v' pink should now carry the price lower towards support at 118.80 to complete five waves down in wave (i) blue.
Tomorrow;
watch for 119.56 to hold in wave 'iv' pink and five waves down in wave 'v' to continue.
[/vc_column_text][/vc_column][/vc_row]
[vc_row][vc_column][vc_separator border_width="5"][/vc_column][/vc_row][vc_row][vc_column][vc_column_text]
SILVER
[/vc_column_text][/vc_column][/vc_row][vc_row][vc_column][vc_separator border_width="5"][/vc_column][/vc_row][vc_row][vc_column width="2/3"][vc_custom_heading text="30 min" use_theme_fonts="yes"][vc_column_text]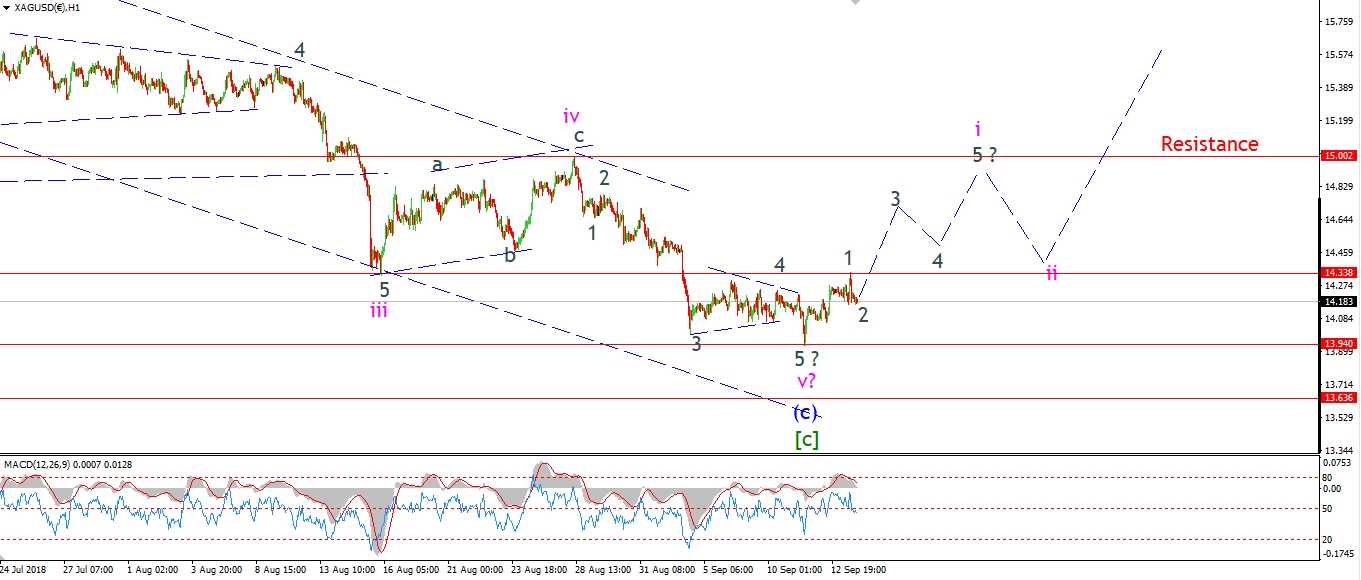 [/vc_column_text][/vc_column][vc_column width="1/3"][vc_custom_heading text="4 Hours" use_theme_fonts="yes"][vc_column_text]
 [/vc_column_text][vc_custom_heading text="Daily" use_theme_fonts="yes"][vc_column_text]
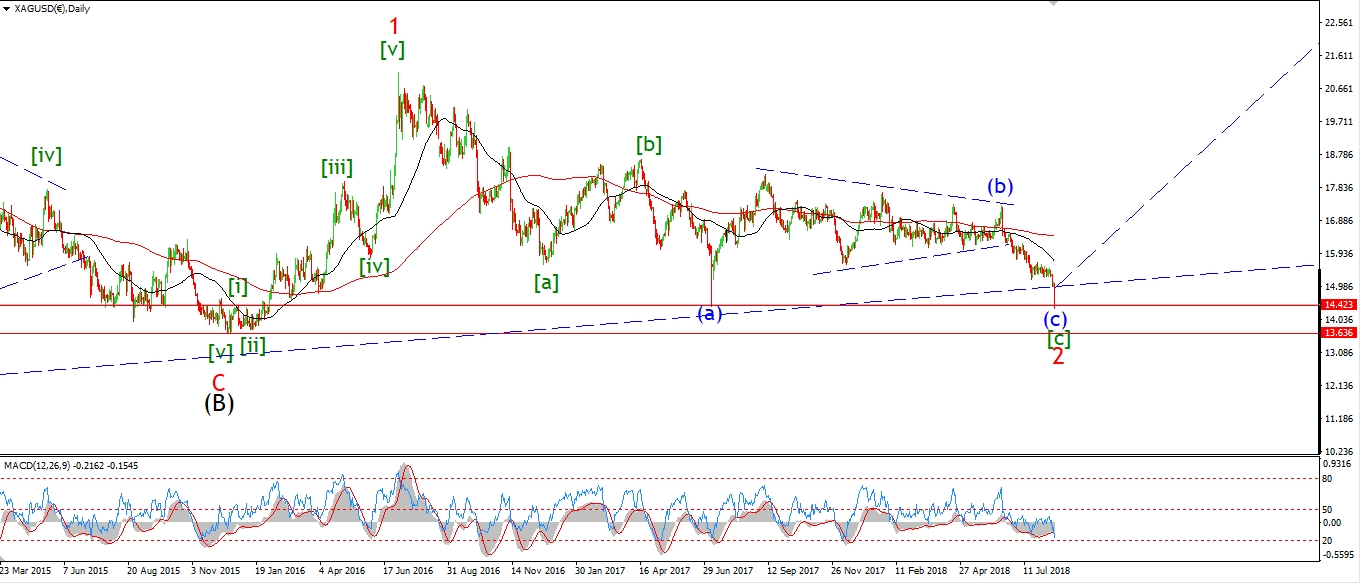 [/vc_column_text][/vc_column][/vc_row]
[vc_row][vc_column][vc_column_text]
Silver has pushed higher again today in a possible wave 'i' turnaround.
It is possible that wave '1' of 'i' completed at todays high.
That suggests that wave '2' grey is now underway.
The action off the low at 13.94 is as yet unconvincing.
We need to see a clear impulse pattern up to finally put an end to the correction.
Tomorrow;
Watch for wave '2' to complete above 13.94 and a rally in wave '3' of 'i' to begin.
[/vc_column_text][/vc_column][/vc_row]
[vc_row][vc_column][vc_separator border_width="5"][/vc_column][/vc_row][vc_row][vc_column][vc_column_text]
S&P 500.
[/vc_column_text][/vc_column][/vc_row][vc_row][vc_column][vc_separator border_width="5"][/vc_column][/vc_row][vc_row][vc_column width="2/3"][vc_custom_heading text="30 min" use_theme_fonts="yes"][vc_column_text]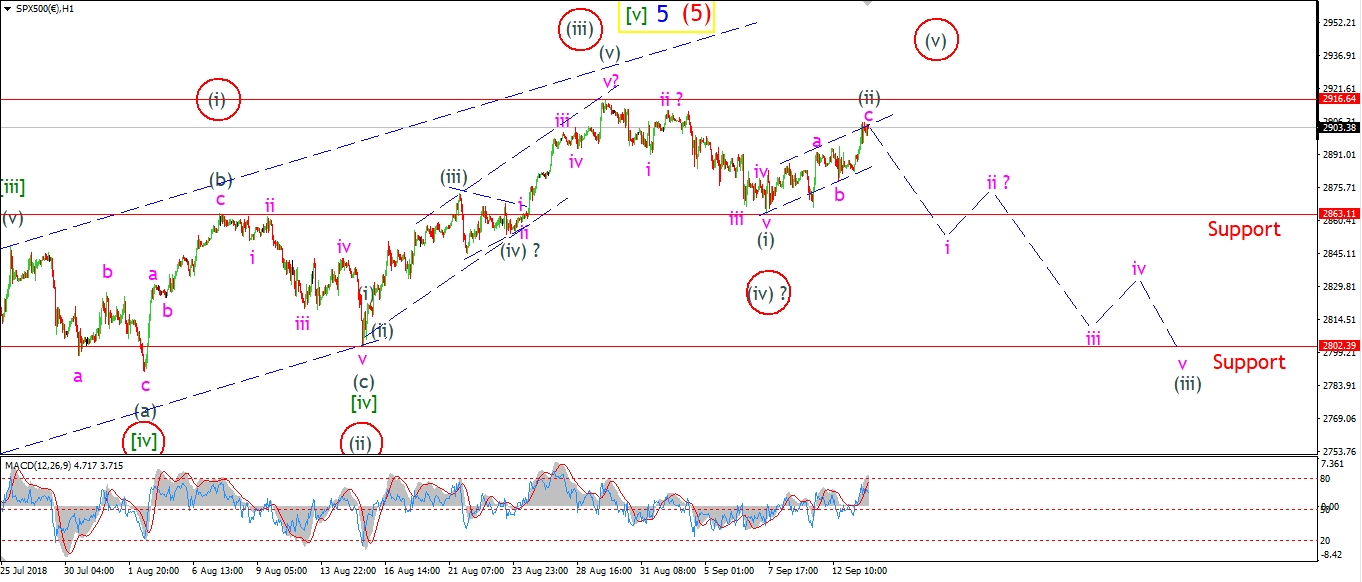 [/vc_column_text][/vc_column][vc_column width="1/3"][vc_custom_heading text="4 Hours" use_theme_fonts="yes"][vc_column_text]
 [/vc_column_text][vc_custom_heading text="Daily" use_theme_fonts="yes"][vc_column_text]
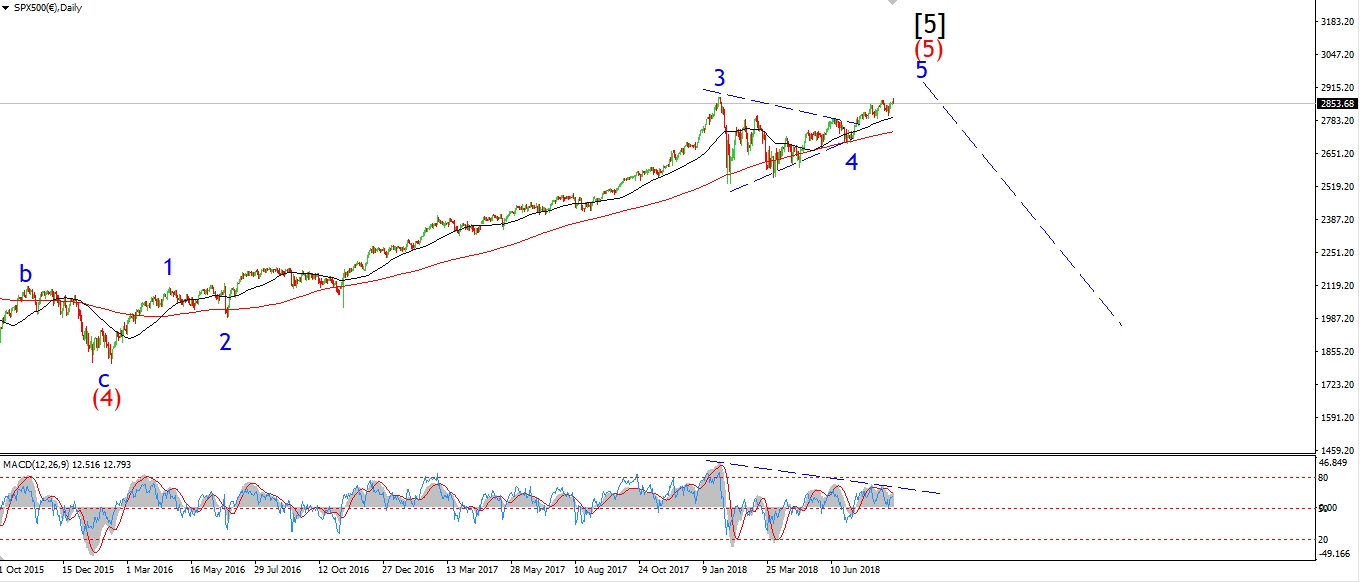 [/vc_column_text][/vc_column][/vc_row]
[vc_row][vc_column][vc_column_text]
The pattern in the S&P is a 50/50 split between the current count and the alternate shown circled in red.
Both interpretations are equally valid right now.
With that alternate count calling for another slight new high in the 2950 area.
but not much more than that I expect.
The current wave count shows a corrective rise in a possible wave (ii).
The action off 2863 is certainly very corrective looking,
with overlap after overlap favoring the corrective count.
Tomorrow;
I am sticking with the bearish outlook for now.
Look for another decline towards 2863 to confirm wave (iii) down.
[/vc_column_text][/vc_column][/vc_row]
[vc_row][vc_column][vc_column_text]
[/vc_column_text][/vc_column][/vc_row]
[vc_row][vc_column][vc_separator border_width="5"][/vc_column][/vc_row]