
[vc_row][vc_column][vc_column_text]
Momentum extremes all round!
[/vc_column_text][/vc_column][/vc_row][vc_row][vc_column][vc_separator border_width=”5″][/vc_column][/vc_row][vc_row][vc_column][vc_column_text]
EURUSD
[/vc_column_text][/vc_column][/vc_row][vc_row][vc_column][vc_separator border_width=”5″][/vc_column][/vc_row][vc_row][vc_column width=”2/3″][vc_custom_heading text=”30 min” use_theme_fonts=”yes”][vc_column_text]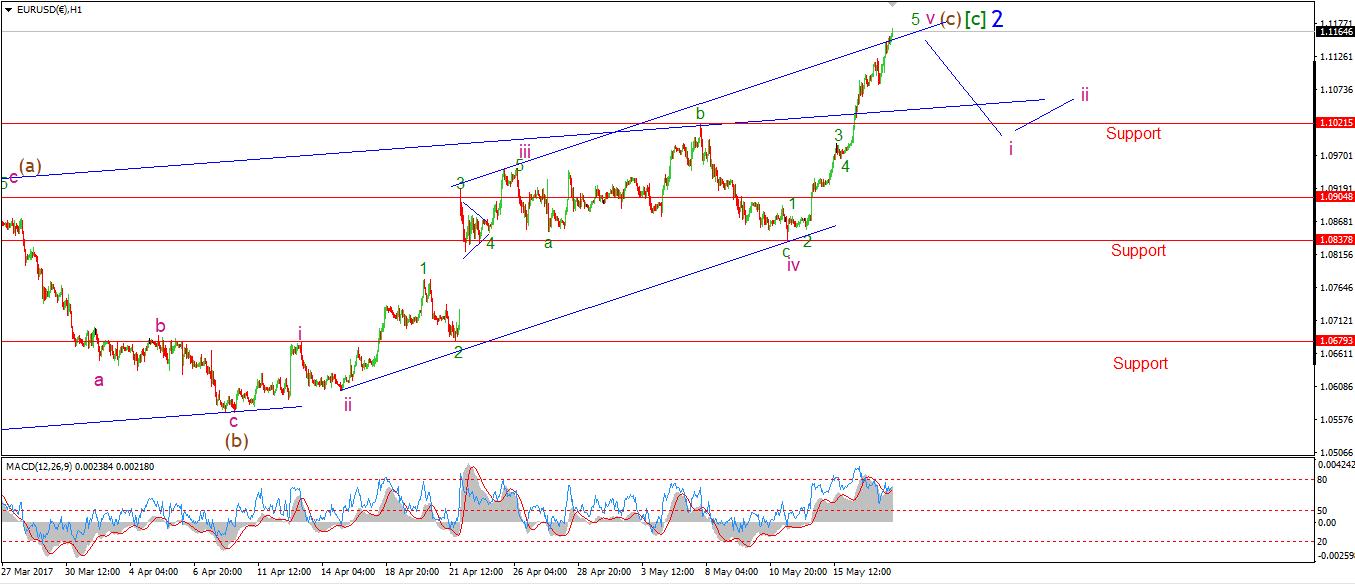 [/vc_column_text][/vc_column][vc_column width=”1/3″][vc_custom_heading text=”4 Hours” use_theme_fonts=”yes”][vc_column_text]
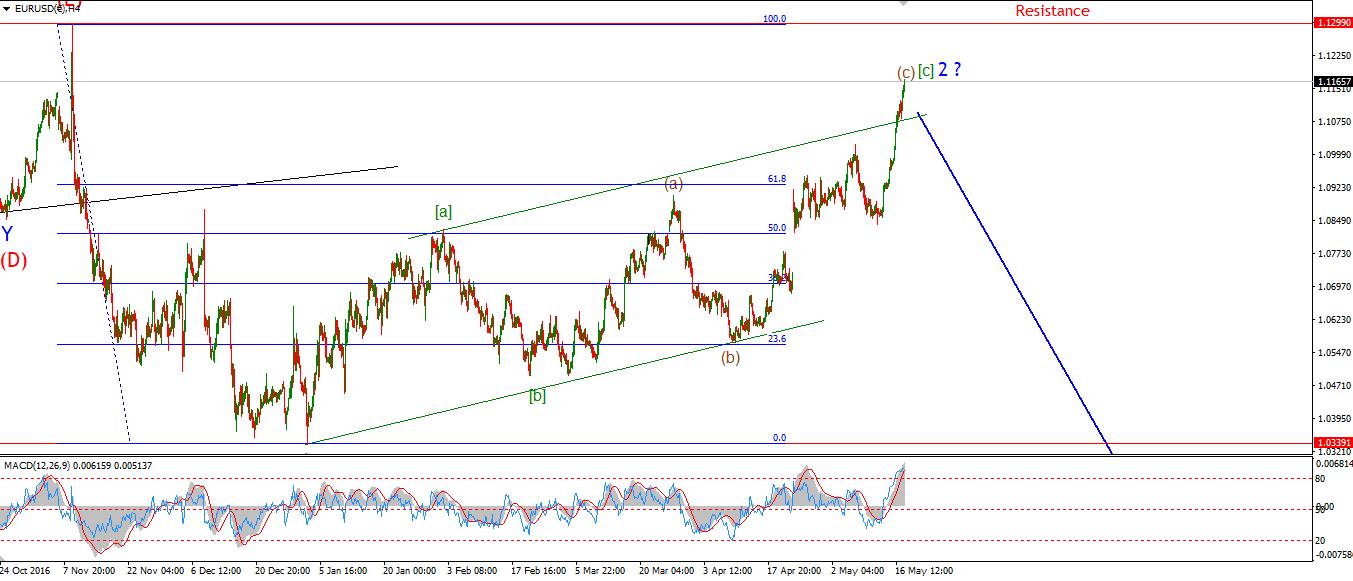 [/vc_column_text][vc_custom_heading text=”Daily” use_theme_fonts=”yes”][vc_column_text]
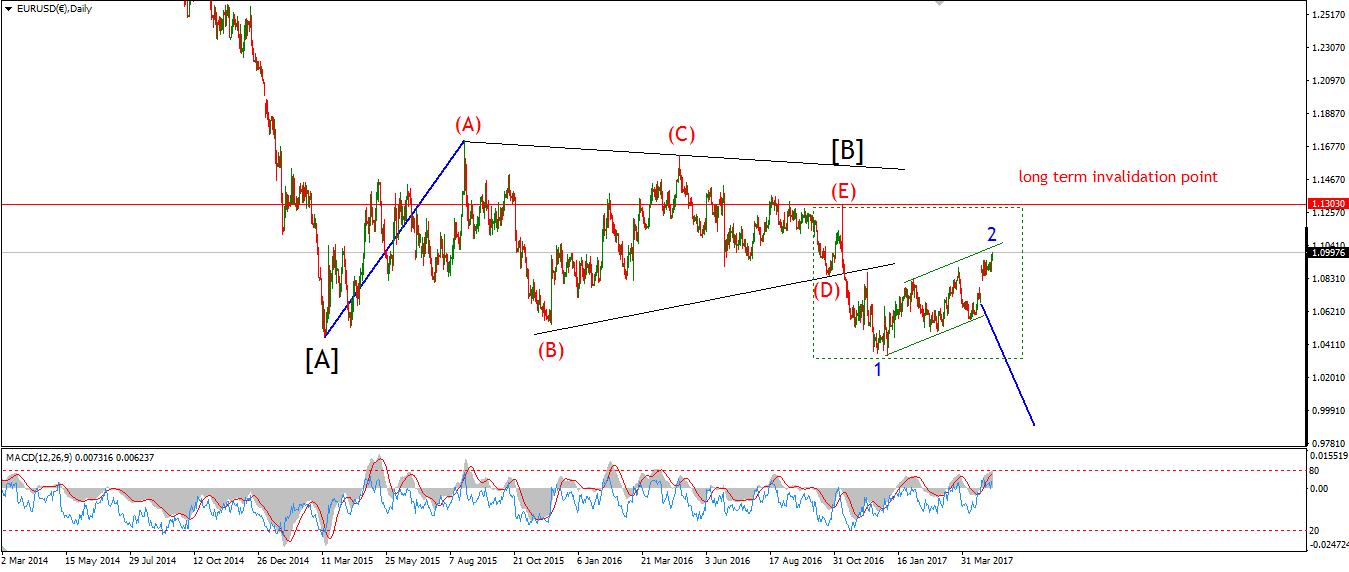 [/vc_column_text][/vc_column][/vc_row][vc_row][vc_column][vc_column_text]My Bias: short in wave 3 blue.
Wave Structure: downward impulse wave 1, 2 blue
Long term wave count: lower in wave 3 blue
Important risk events: EUR: ECB President Draghi Speaks. USD: Unemployment Claims, Philly Fed Manufacturing Index.
Good evening to you all, hope you had a great day.
Well, If you ever wanted to witness what an overbought extreme looks like,
Todays EURUSD action is a prime example.
I have been surprised by the severity of the rally over the last few days, but it has done very little to change my mind on the wave count.
What you are witnessing here, may well be the final high in EURUSD for many years to come.
We have had extension after extension in this wave [c], but every indicator is boiling right now!
The 4hr RSI reached a 1 year high today, at 90.41,
The price also tagged the upper trendline of the rising trend channel in wave (c) brown.
The price looks like it is going to drop like a stone very soon.
Of course it is almost impossible to resist the urge to buy when the herd is charging like this.
But,
When I step back, and take in all the information on display,
I reach the exact same conclusion,
EURUSD is now a bubble looking for a pin.
I am actively on the lookout for an impulsive decline and the formation of a lower high as the sign the market has turned.
The high at 1.1299 is the invalidation line for the current immediately bearish view.[/vc_column_text][/vc_column][/vc_row][vc_row][vc_column][vc_separator][/vc_column][/vc_row][vc_row][vc_column][vc_column_text]
DOW JONES INDUSTRIALS
[/vc_column_text][/vc_column][/vc_row][vc_row][vc_column][vc_separator][/vc_column][/vc_row][vc_row][vc_column width=”2/3″][vc_custom_heading text=”30 min” use_theme_fonts=”yes”][vc_column_text]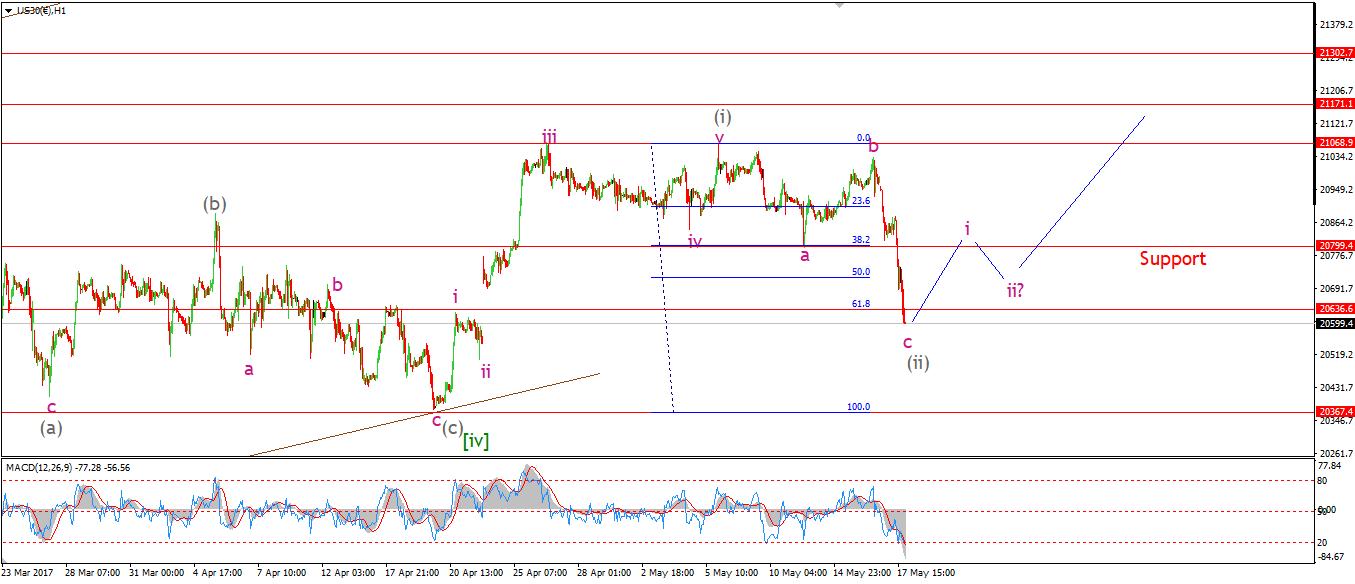 [/vc_column_text][/vc_column][vc_column width=”1/3″][vc_custom_heading text=”4 Hours” use_theme_fonts=”yes”][vc_column_text]
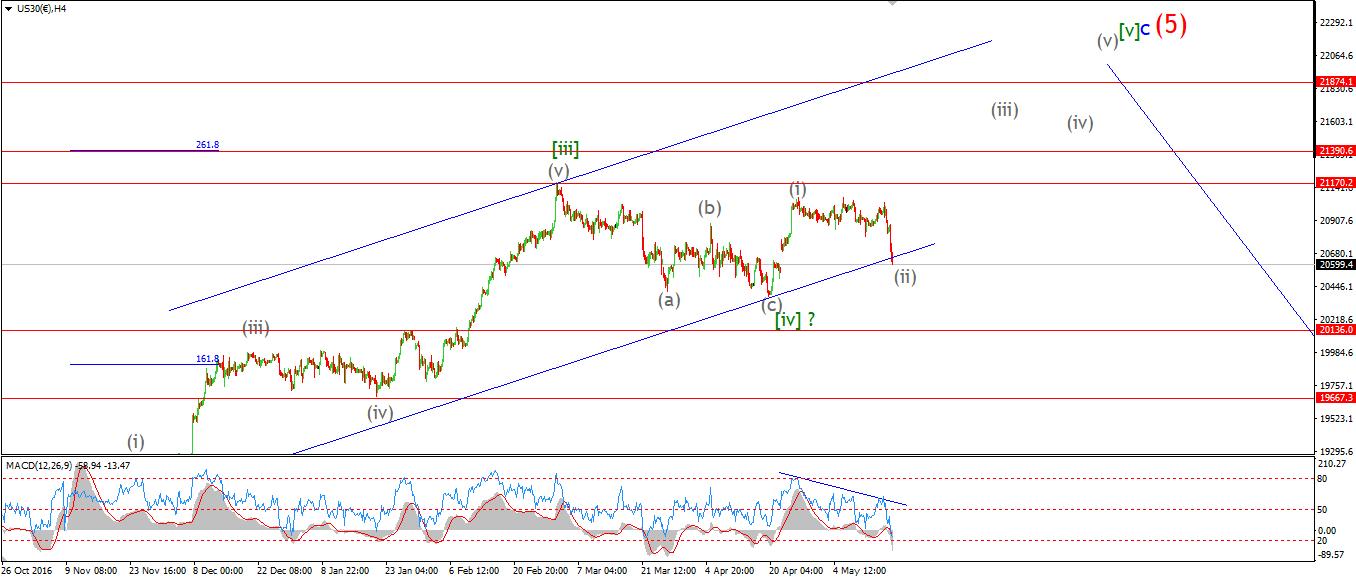 [/vc_column_text][vc_custom_heading text=”Daily” use_theme_fonts=”yes”][vc_column_text]
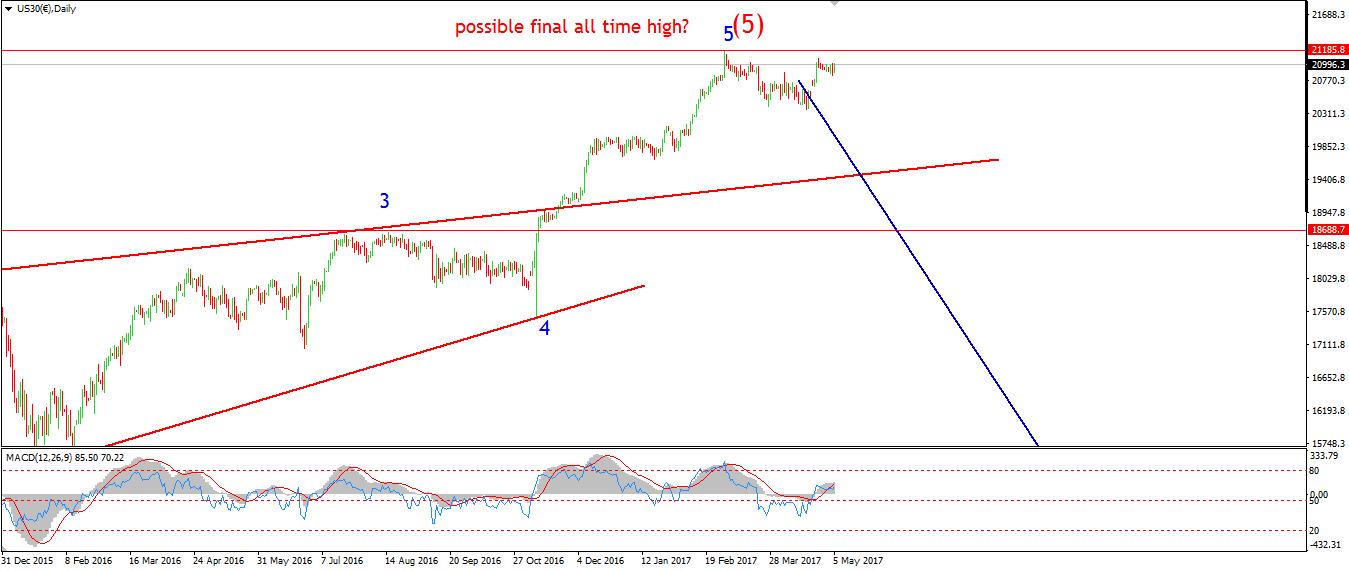 [/vc_column_text][/vc_column][/vc_row][vc_row][vc_column][vc_column_text]My Bias: market topping process ongoing
Wave Structure: Impulsive 5 wave structure, possibly topping in an all time high.
Long term wave count: Topping in wave (5)
Important risk events: USD: Unemployment Claims, Philly Fed Manufacturing Index.
Another rip-roaring day in the stock market! I was expecting a decline today,
But not to that degree!
I have relabelled the action with my next best interpretation,
That is;
the rally off wave [iv] green has now traced out a five waves up in wave [i] grey,
and three waves down in wave [ii] grey.
This opens up the possibility for a serious advance in wave (iii) grey to come our way soon.
20636 was the 61.8% retracement of wave [i] grey, so we are right about the area for a typical second wave retracement.
I will be watching for tomorrows reaction to the unemployment claims figures,
If I am correct here.
A higher low off wave [ii] will create a nice opportunity to ride wave [iii] to new highs[/vc_column_text][/vc_column][/vc_row][vc_row][vc_column][vc_separator][/vc_column][/vc_row][vc_row][vc_column][vc_column_text]
GOLD
[/vc_column_text][/vc_column][/vc_row][vc_row][vc_column][vc_separator][/vc_column][/vc_row][vc_row][vc_column width=”2/3″][vc_custom_heading text=”30 min” use_theme_fonts=”yes”][vc_column_text]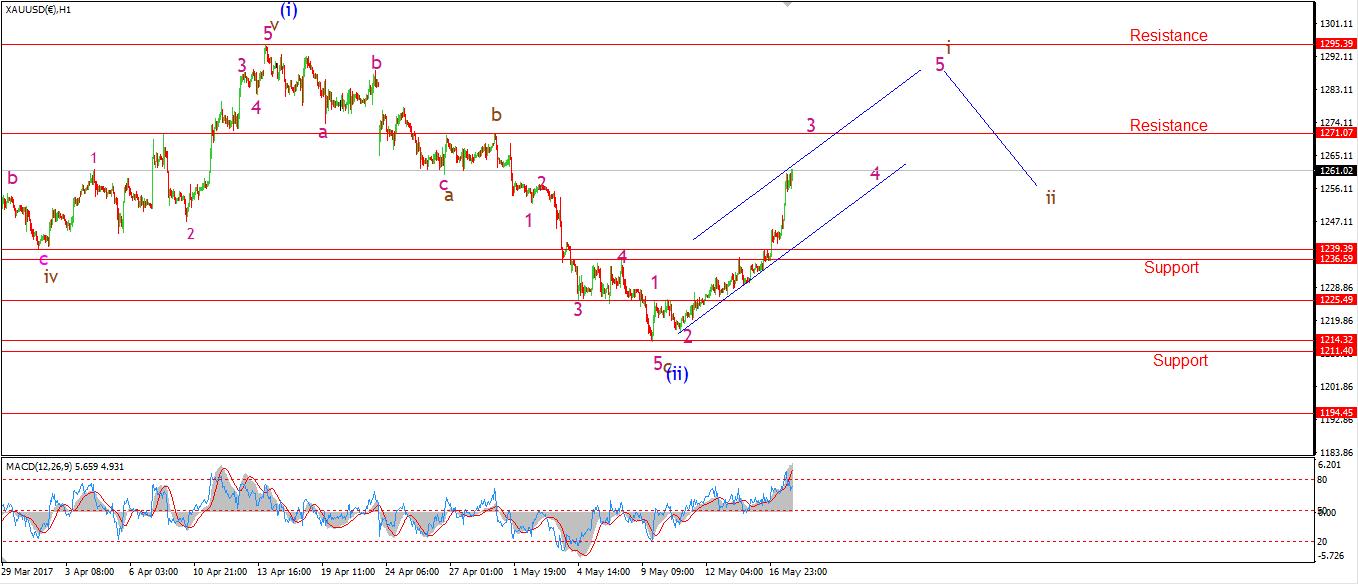 [/vc_column_text][/vc_column][vc_column width=”1/3″][vc_custom_heading text=”4 Hours” use_theme_fonts=”yes”][vc_column_text]
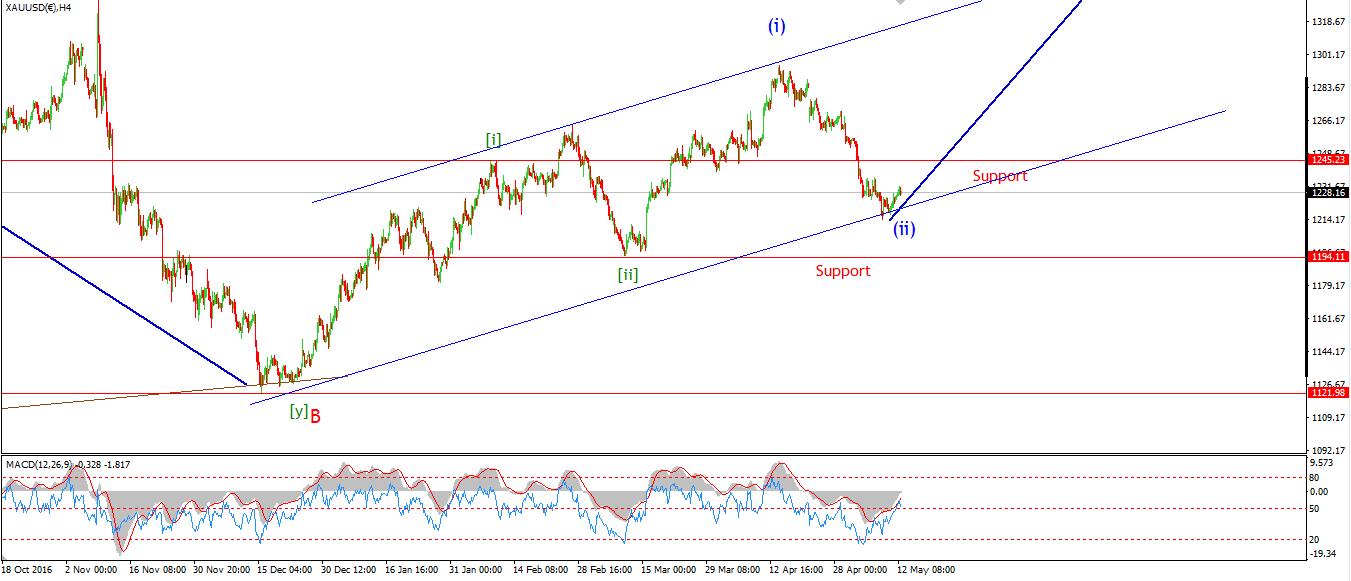 [/vc_column_text][vc_custom_heading text=”Daily” use_theme_fonts=”yes”][vc_column_text]
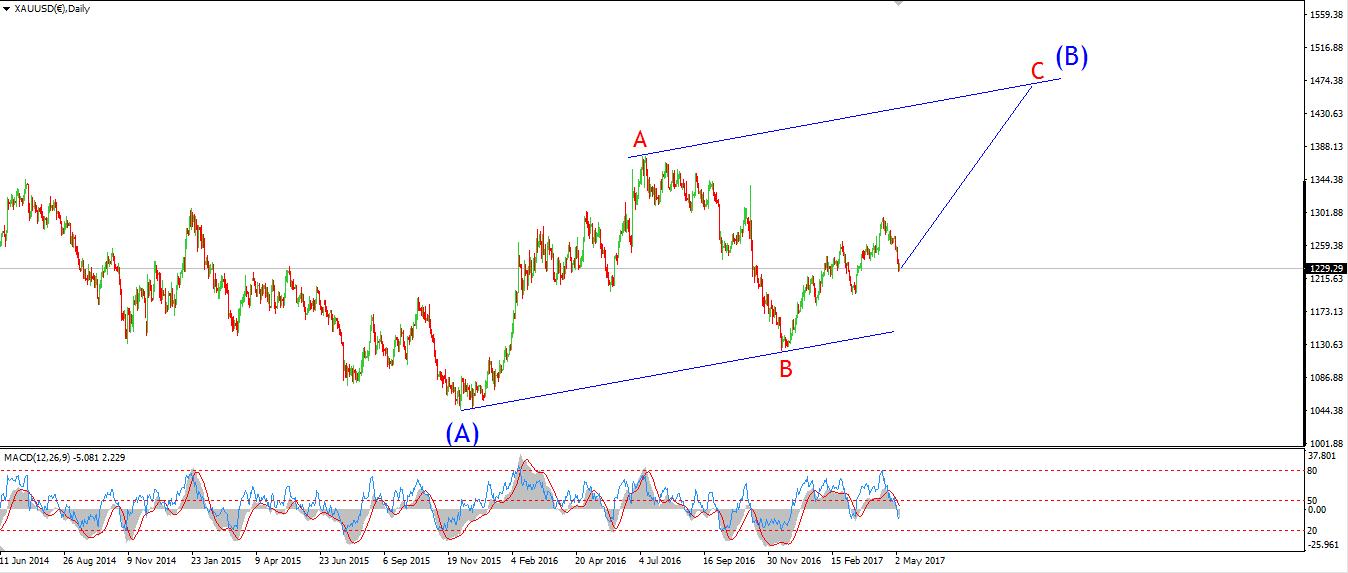 [/vc_column_text][/vc_column][/vc_row][vc_row][vc_column][vc_column_text]My Bias: Long towards 1550
Wave Structure: ZigZag correction to the upside.
Long term wave count: Topping in wave (B) at 1550
Important risk events: USD: Unemployment Claims, Philly Fed Manufacturing Index.
What a difference a day makes.
I have been cautiously bullish over the last week or so,
And then in one foul swoop, the market rockets into a clear impulsive form.
just like magic!
It is still hard to decipher the internal wave form of the recent overlapping upside drift.
After todays rally, it looks like the market has been lurching higher in a series of wave 1,2 rallies off the lows.
This leads me to believe that the price will likely continue to unfurl higher above resistance at 1271.
In order to create a completed five wave structure to the upside.
Todays rally could well have turned the tide in this market.
The long awaited rally in wave (iii) blue has just arrived.[/vc_column_text][/vc_column][/vc_row]