
[vc_row][vc_column][vc_separator border_width="5"][/vc_column][/vc_row]
[vc_row][vc_column][vc_column_text]
Hello everyone,
welcome back to a new trading week.
I want to share some charts I track on the Irish housing market with you.
What the hell has the Irish housing market got to do with anything you might ask!
The answer is CREDIT!
And CREDIT drives economic activity.
And I advise you to seek the same DATA from your own local housing market to see if it is flashing the same warning signals as my local market is.
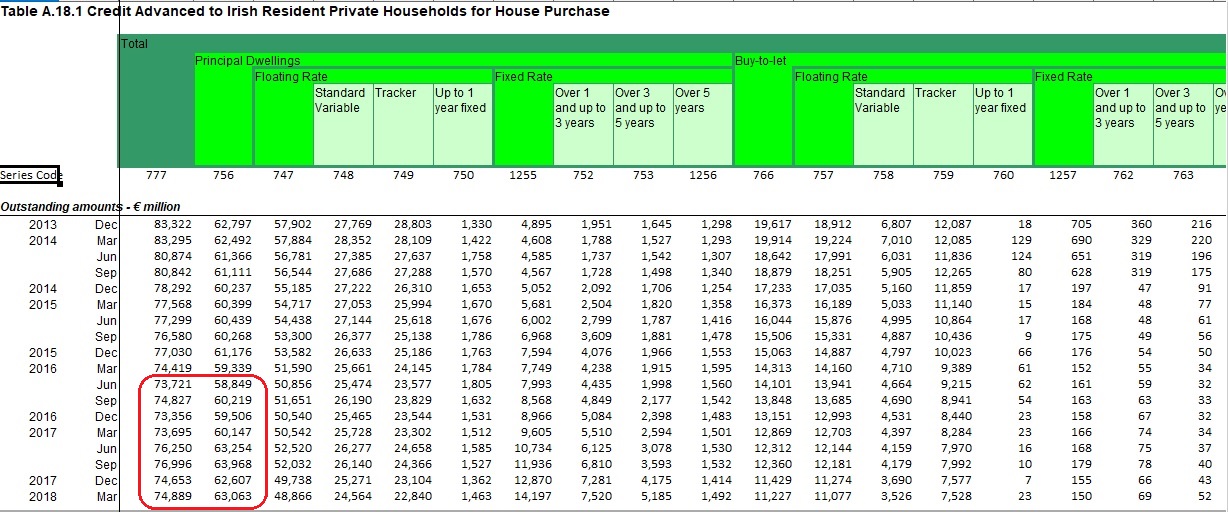
The first chart is outstanding credit to households for the purchase of houses.
Outstanding Mortgages basically.
This figure bottomed in 2016 and rose since then, until now that is.
Outstanding mortgage debt has begun declining again this year, at a surprising rate!
The next chart is the rate of change of prices on a 1mth 3mth and yearly basis since 2005.
note the first circled area, summer 2006 to summer 2007 on the blue line.
The market creates a three month peak acceleration every year until 2007, this is house buying season.
Notice in 2007 that the blue line failed to peak,
And the market slipped into a free fall which took down the Irish economy and banking system with it.
Notice that the very same failure to peak has occurred this year.............
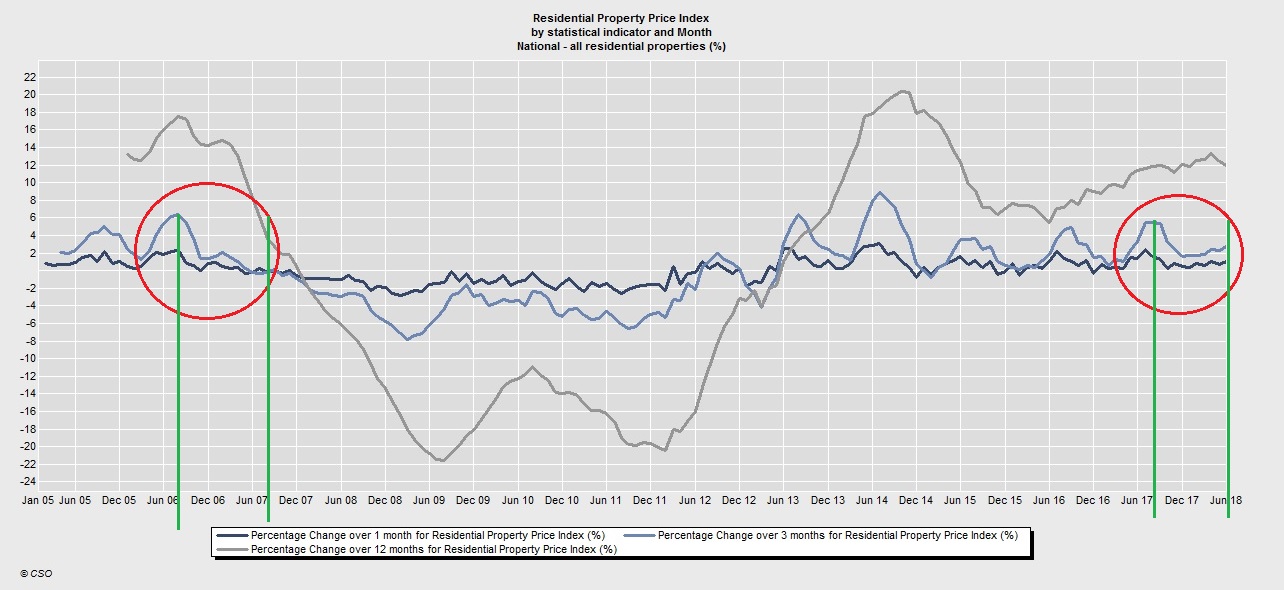
The recovery in the Irish housing market is on its last legs.
And this should lead to a very similar outcome in the Irish banking system and economy this time, as happened in 2007.
Do you think anyone here is prepared for another recession?
The answer is of course a resounding NO!
Down to business.
Check out the latest wave count in the DOW.
[/vc_column_text][/vc_column][/vc_row]
[vc_row][vc_column][vc_separator border_width="5"][/vc_column][/vc_row][vc_row][vc_column][vc_column_text]
DOW JONES INDUSTRIALS
[/vc_column_text][/vc_column][/vc_row][vc_row][vc_column][vc_separator border_width="5"][/vc_column][/vc_row][vc_row][vc_column width="2/3"][vc_custom_heading text="30 min" use_theme_fonts="yes"][vc_column_text]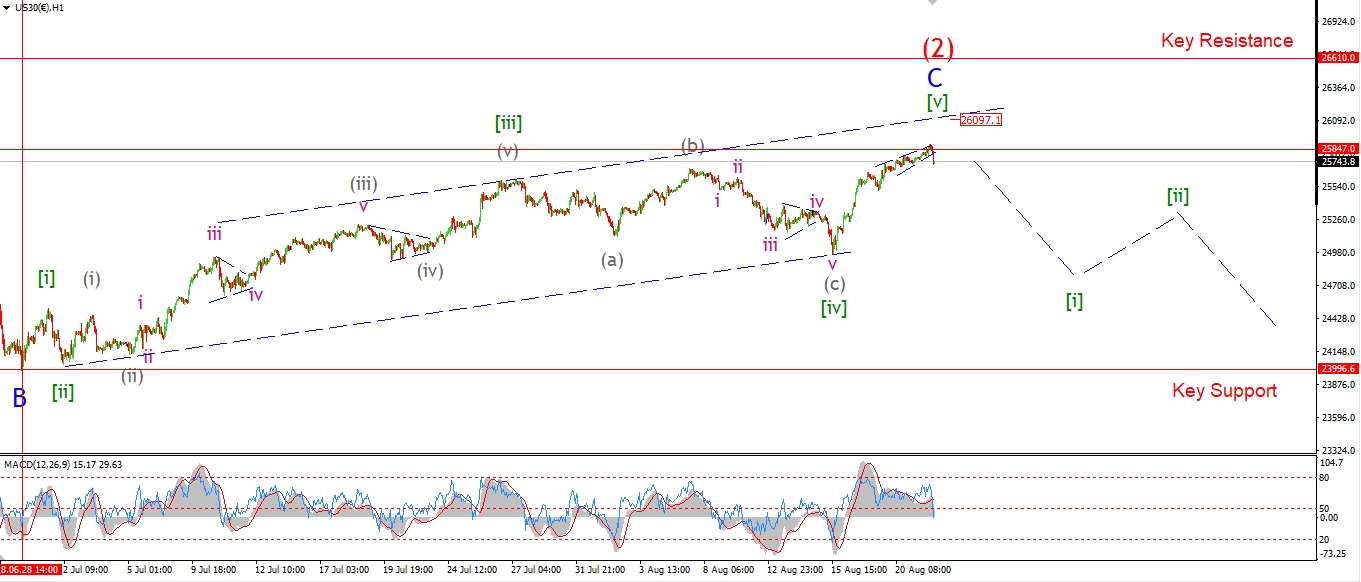 [/vc_column_text][/vc_column][vc_column width="1/3"][vc_custom_heading text="4 Hours" use_theme_fonts="yes"][vc_column_text]
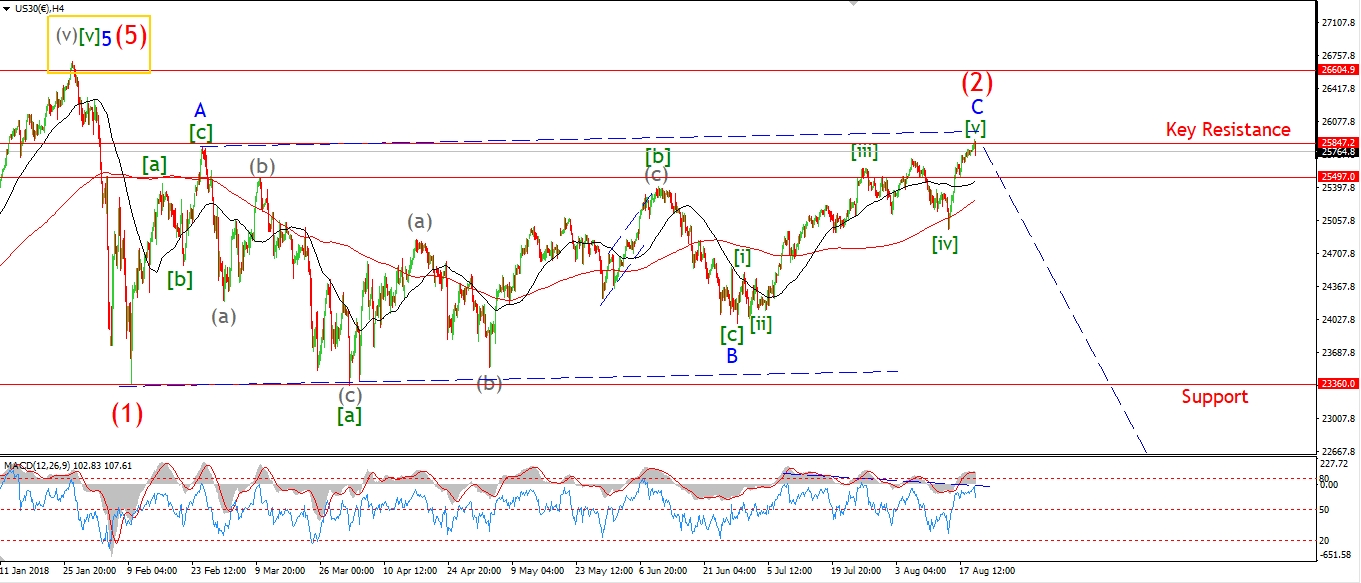 [/vc_column_text][vc_custom_heading text="Daily" use_theme_fonts="yes"][vc_column_text]
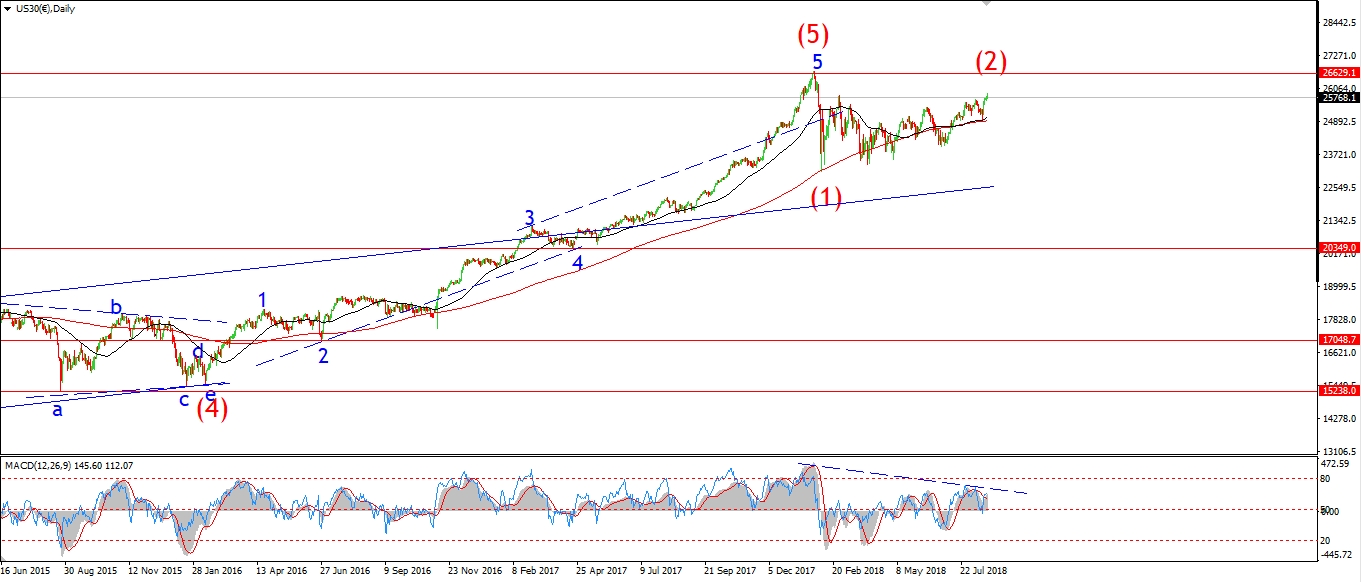 [/vc_column_text][/vc_column][/vc_row]
[vc_row][vc_column][vc_column_text]
I suppose I am earning the title off perma-bear,
well I'm working hard for it anyway!
The DOW pipped over the invalidation line at 25847 this afternoon.
Price is back below that level again.
But,
this action has triggered the alternate wave count which views the correction at one higher degree again.
The price is topping out, in a large degree wave (2) red.
You can see on the 4hr chart that wave (2) red is a flat correction.
Wave's 'A' and 'B' are in three waves,
With wave 'C' in five waves, with an extension in wave [iii] of 'C', as shown.
Wave [v] green has already surpassed the length of wave [i] green,
So I expect that wave [v] is nearing completion.
Tomorrow;
I will be tracking this new count to see if we get some action that points to a topping out process.
If the upper trendline of the trend channel is met,
That will bring us to the 26000 level again.
[/vc_column_text][/vc_column][/vc_row]
[vc_row][vc_column][vc_separator border_width="5"][/vc_column][/vc_row]