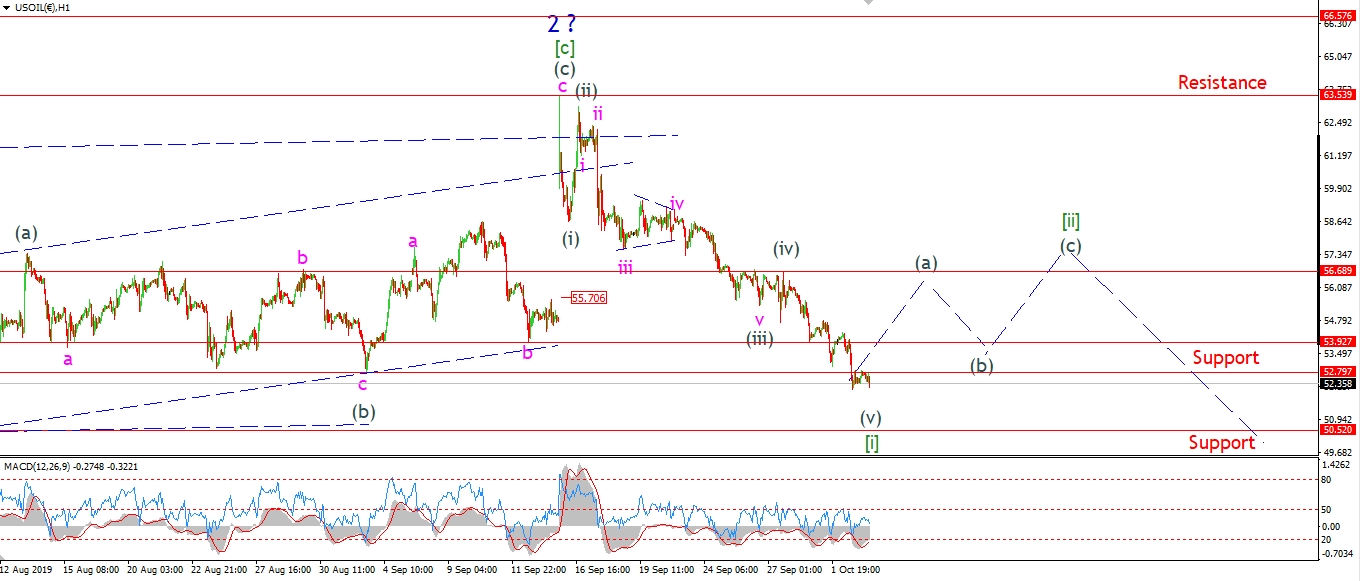
On September 16th Crude oil just completed a large second wave corrective rally,
And the wave count was calling for a large move lower into a third wave to begin immediately.
The market dropped impulsively off that high in a very bearish wave formation.
All the signs were pointing to a sharp decline ahead.
Here is the chart I released that night showing the setup.

Waves (i) and (ii) created a bearish lower high at 63.00,
And now it was time for wave (iii) down to begin.
The wave count was calling for a drop in wave [i] to take out most of the recent rally.
Here is what I wrote that night;
If waves ‘1’ and ‘2’ are now done,
then we should now expect wave ‘3’ down to begin to track lower over the coming week.
A break of 50.50 will confirm wave ‘3’ has begun,
and we should see a five wave decline occur in wave [i] over the coming week.Tomorrow;
Todays sell off and recovery to a lower high may be waves (i) and (ii).
Watch for wave (iii) to push lower again tomorrow and break 59.00 again.
The scene was set, wave [i] down was ready to go!
Heres what happened next!
Crude oil quickly moved lower off that second wave high,
as the price fell 1100 points over the following two weeks!
That big call went against everything the media was saying at the time.
But the wave count caught the move that no-one else could see!
What is next for crude oil?
Check out the membership to find out now.
This is a great example of how you can spot major turns on the fly,
using simple Elliott wave patterns.
Check out the membership options today!